 Open Access Article
Preparation and heat-insulating properties of Al2O3–ZrO2(Y2O3) hollow fibers derived from cogon using an orthogonal experimental design†
Changhao Dai ,
Zihao Zhang and
Tianchi Wang*
School of Materials Science and Engineering, Nanjing University of Science and Technology, 200 Xiaolingwei Street, Nanjing 210094, China. E-mail: tianchiwang@aliyun.com; Tel: +86-13951610863
First published on 11th April 2019
Abstract
Bionic design is efficient to develop high-performance lightweight refractories with sophisticated structures such as hollow ceramic fibers. Here, we report a four-stage procedure for the preparation of Al2O3–ZrO2(Y2O3) hollow fibers using the template of cogon—a natural grass. Subsequently, to optimize the thermal performance of the fibers, four sets of preparation parameters, namely, x(Al2O3), solute mass ratio of the mixture, dry temperature, and sintering temperature were investigated. Through an orthogonal design, the optimal condition of each parameter was obtained as follows: x(Al2O3) was 0.70, solute mass ratio of the mixture was 15 wt%, dry temperature was 80 °C, and sintering temperature was 1100 °C. Overall, Al2O3–ZrO2(Y2O3) hollow fibers show relatively low thermal conductivity (0.1038 W m−1 K−1 at 1000 °C), high porosity (95.0%), and low density (0.05–0.10 g cm−3). The multiphase compositions and morphology of Al2O3–ZrO2(Y2O3) hollow fibers, which may contribute to their thermal properties, were also discussed.
1 Introduction
It is acknowledged that natural species have developed specific structures, which perform more efficiently than artificial materials.1 Recently, fabricating structures and functions similar to those like species in nature, such as morphology genetic materials (MGMs)1 and functional biomimetic synthesis (FBS),2 has received considerable interest. In addition, there are a wide variety of natural structures that can be imitated, including butterfly wings,1,3 leaves,1 cotton fiber,4 metallic wood5 and so on.2 Assisted by the unusual microstructures of metallic wood, Wan et al. fabricated a composite material with anisotropic thermal conductivity and electrical conductivity,5 which has sufficiently shown the value of MGMs and FBS.Alumina (Al2O3) is extensively used in lightweight refractories6,7 and structural elements8 for the modification of polymers,9 batteries,10 and so forth. Similarly, zirconia (ZrO2) possesses a relatively low thermal conductivity, a high melting point,11 and high temperature strength,7 thereby leading to its significant potential in thermal applications.11,12 In many cases, composite materials with certain structures show properties beyond those of single compositions.5 Herein, it is, in principle, feasible to develop novel lightweight refractories by synthesizing Al2O3–ZrO2 composites.13–17 Using solution blow spinning and atomic layer deposition (ALD), Xu et al. produced novel Al2O3 nanotube aerogels having a pore size of 1–2 μm, whose thermal conductivity is only 0.022 W m−1 K−1 at room temperature.7 Nevertheless, few studies have reported the thermal performance of Al2O3–ZrO2 composites at a high temperature (900–1600 °C) till now. In addition, there are some universal problems in ceramic preparation. For example, it is a tedious and expensive process to design ceramic materials with certain components, as there are always much varying factors, including dry temperature and sintering temperature.18,19 Hence, to solve this problem, we applied an orthogonal experimental design, i.e., an experimental arrangement in which orthogonal arrays and mathematical analysis is used to determine the optimal condition with limited experiments20–24 for the preparation of Al2O3–ZrO2(Y2O3) hollow fibers.
In this study, we developed a four-stage procedure for preparing Al2O3–ZrO2(Y2O3) hollow fibers using the template of cogon—Imperata cylindrica (the scientific name). Cogon is commonly known as cogon grass or kunai grass and is a species of grass in the family Poaceae.25 More importantly, cogon is mainly made of cellulose, hemicellulose, and lignin,26 most of which would burn out between 300 and 1000 °C.
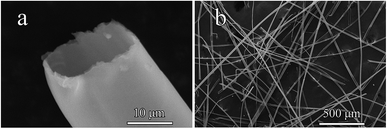
Fig. 1a and b shows the hollow structure and micromorphology of cogon fibers, which act as a template for fabricating Al2O3–ZrO2(Y2O3) hollow fibers. It is obvious that cogon fibers have a length of 2–3 mm and an internal diameter of about 20 μm. Given Hu's theory about hollow-structured materials (HSMs),27 it can be feasible to decrease the thermal conductivity of Al2O3–ZrO2(Y2O3) hollow fibers using a hollow structure.
In short, we prepared lightweight Al2O3–ZrO2(Y2O3) hollow fibers with relatively low thermal conductivity (0.1038 W m−1 K−1 at 1000 °C) and high porosity (95.0%). In addition, we also discussed two main mechanisms that may affect Al2O3–ZrO2(Y2O3) hollow fibers' thermal properties, including their multiphases and structures.
2 Experimental
2.1 Preparation of Al2O3–ZrO2(Y2O3) hollow fibers
Table 1 lists the chemical compositions of the mixture of AlCl3·6H2O (AR), ZrOCl2·8H2O (AR), and Y(NO3)3·6H2O (99.5%) made with ion-free water and ethanol, which was prepared initially. Cogon was immersed in the mixture for 5–15 min to obtain precursors, which were readily modified into Al2O3–ZrO2(Y2O3) hollow fibers. Next, the precursors were dried at a temperature ranging from 80 °C to 120 °C in a vacuum drying oven for 14–16 h. In the last stage, the arid precursors were sintered from room temperature to a certain temperature ranging from 1100 °C to 1300 °C at a rate of 10 °C min−1 using a muffle furnace.| Sample no. | AlCl3·6H2O (wt%) | ZrOCl2·8H2O (wt%) | Y(NO3)3·6H2O (wt%) |
|---|---|---|---|
| 1, 2, 3 | 47.8 | 44.6 | 7.6 |
| 4, 5, 6 | 62.0 | 30.8 | 7.2 |
| 7, 8, 9 | 74.7 | 18.5 | 6.8 |
| V1, 2, 3 | 74.7 | 18.5 | 6.8 |
| V4 | 82.3 | 11.0 | 6.7 |
| V5 | 89.3 | 4.0 | 6.7 |
| V6 | 100.0 | 0 | 0 |
2.2 Orthogonal experimental arrangement
Based on our previous studies18,19 and some references,13,14,28 the composition of the ceramic fiber, solute mass ratio of the mixture, dry temperature, and sintering temperature were the major contributing factors in the preparation of Al2O3–ZrO2(Y2O3) hollow fibers. Additionally, each parameter has a different effect on the thermal performance of the hollow fibers. Consequently, the theoretical molar fraction of Al2O3 (x) in the composite xAl2O3–(1 − x − 0.04)ZrO2(0.04Y2O3), solute mass ratio of the mixture (wt%), dry temperature, and sintering temperature labeled as A, B, C, and D, respectively, were investigated in this study using an orthogonal table L9(34) designed by the Orthogonal Designing Assistant II. In the orthogonal table L9(34) (see Table S1, ESI†), 9 refers to the experimental times and 3 is the level of the factors set in the work.21In our preceding experiments, the density of Al2O3–ZrO2(Y2O3) hollow fibers drastically increased if the sintering temperature was above 1300 °C, thus leading to the increase in the thermal conductivity. However, it is difficult to get partly stabilized ZrO2 (t-ZrO2) below 1100 °C. In addition, with regard to the dry temperature, it can be time-consuming to dry the precursors below 80 °C. Overall, taking the influence of the above parameters into account, Table 2 lists the levels of the factors set in this study (more experimental details of the fiber preparation are listed in Table S2, ESI†).
| Levels | Factors | |||
|---|---|---|---|---|
| A (x) | B (wt%) | C (°C) | D (°C) | |
| 1 | 0.40 | 5 | 80 | 1100 |
| 2 | 0.55 | 15 | 100 | 1200 |
| 3 | 0.70 | 25 | 120 | 1300 |
2.3 Characterization
3 Results and discussion
3.1 The optimal preparation condition
Table 3 lists the evaluation index (thermal conductivity) for the orthogonal design experiment as well as the corresponding mathematical analysis. According to the R value range, in which a higher R value means more significant impact,20,21 it is apparent that factor D, i.e., the sintering temperature, has a maximum R value of 0.025, which represents the most important effect among these four factors set in this study. In contrast, the R value of factor A, B, and C ranges from 0.04 to 0.07. Correspondingly, the order of these factors' importance is D > B > A > C.| A | B | C | D | |
| K1 | 0.139 | 0.128 | 0.126 | 0.101 |
| K2 | 0.136 | 0.124 | 0.132 | 0.120 |
| K3 | 0.123 | 0.145 | 0.139 | 0.176 |
| m1 | 0.046 | 0.043 | 0.042 | 0.034 |
| m2 | 0.045 | 0.041 | 0.044 | 0.040 |
| m3 | 0.041 | 0.048 | 0.046 | 0.059 |
| R | 0.005 | 0.007 | 0.004 | 0.025 |
| Order of importance | D > B > A > C | |||
| Optimal lever | A3 | B2 | C1 | D1 |
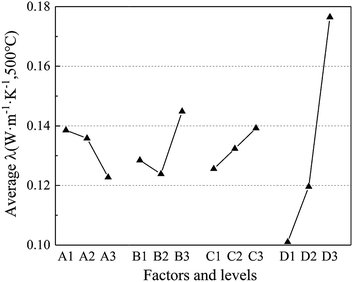
Furthermore, Table 3 also shows K1, K2, and K3, which represent the mean values of evaluation index for each level of one factor. For example, when the factor is C (dry temperature) and the level is 1 (80 °C), then K1 = (0.09648 + 0.1287 + 0.1515)/3 = 0.126. Herein, by comparing dissimilar K values, the optimized level corresponding to each factor to prepare Al2O3–ZrO2(Y2O3) hollow fibers can be obtained: D1, B2, A3, and C1. Thus, the optimal criterion was confirmed: x(Al2O3) was 0.70, solute mass ratio of the mixture was 15 wt%, dry temperature was 80 °C and sintering temperature was 1100 °C.
Fig. 2 demonstrates the relationship between average thermal conductivity with the four factors and levels. It is obvious that most factors are monotonously increasing or decreasing with the increase in levels except for factor B, which reaches its valley at level 2 (15 wt%). As for factor A, the factors of mole fraction of Al2O3 (x), i.e., the average thermal conductivity, drops with the increase of x(Al2O3). Moreover, when it comes to factor C and D, they share a similar tendency, i.e., both increase with the increase in levels. However, it is noteworthy that factor D increased much more drastically with the growth in the sintering temperature, leading to the highest R value (0.025) in Table 3.
Fig. 3a shows dissimilar morphologies of nine types of Al2O3–ZrO2(Y2O3) hollow fibers (Sample 1–9) prepared using the parameters in the orthogonal experiment in Table 3, while Fig. 3b shows thermal conductivities at 500 °C of Sample 1–9 and V1-3 (prepared using the optimal condition: D1, B2, A3, and C1). Obviously, Sample V1-3 has the lowest average thermal conductivity (0.08395 W m−1 K−1), which effectively proves the rationality of the optimal preparation condition obtained by R values and K-analysis. However, further experiments are required to explain why these samples' thermal conductivities were distinct.
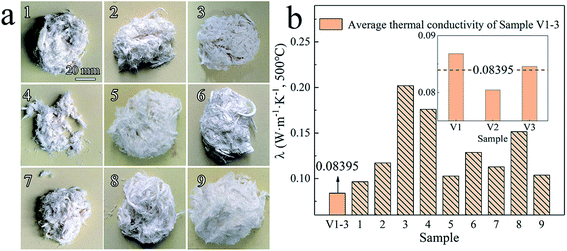 | ||
| Fig. 3 (a) Morphologies of Al2O3–ZrO2(Y2O3) hollow fibers (Sample 1–9) and (b) their thermal conductivities. | ||
3.2 Microstructures and pore size distribution
Fig. 4 shows the morphologies and microstructures of Al2O3–ZrO2(Y2O3) hollow fibers prepared at optimal conditions (Fig. 4a–c) and other conditions (Fig. 4d–l). The ceramic fibers maintained the microstructures and hollow structures of the cogon fibers (Fig. 1). Moreover, their internal diameters varied from 5 to 10 μm. Due to the sintering process, the pores of Al2O3–ZrO2(Y2O3) hollow fibers shrink in contrast to that of the cogon fiber (20 μm) (see Fig. 1). In addition, various chemical compositions may lead to various thermal conductivities for the Al2O3–ZrO2(Y2O3) hollow fibers.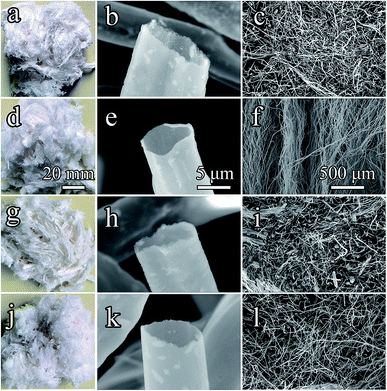 | ||
| Fig. 4 Morphologies and microstructures of Al2O3–ZrO2(Y2O3) hollow fibers ((a–c): x(Al2O3) = 0.70; (d–f): x(Al2O3) = 0.80; (g–i): x(Al2O3) = 0.90; (j–l): x(Al2O3) = 1.00). | ||
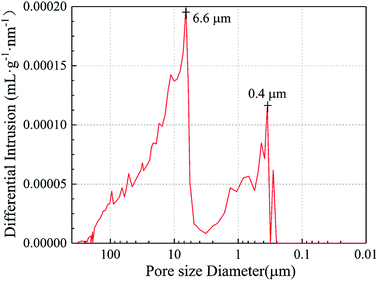
Fig. 5 illustrates the pore-size distributions of Al2O3–ZrO2(Y2O3) hollow fibers, whose actual density was 0.11 g cm−3 during the test. It is noticeable that their pore sizes are mainly distributed between 6.6 μm and 0.4 μm, which connected well with the hollow structures of the fibers shown in Fig. 4. Moreover, the porosity of Al2O3–ZrO2(Y2O3) hollow fibers is high (95.0%), which may contribute to its ultra-low thermal conductivity at a high temperature.27
3.3 Phase analysis
Fig. 6 demonstrates the XRD patterns of Al2O3–ZrO2(Y2O3) hollow fibers prepared with different x(Al2O3). Evidently, when x(Al2O3) is 0.70, the major phases of Al2O3–ZrO2(Y2O3) composite are c-ZrO2 and t-ZrO2, whose thermal stability is better than that of m-ZrO2.13,26–28 In addition, as the intensity of ZrO2 is quite stronger than that of Al2O3, it is only when x(Al2O3) is 1.00 can its peak appear. It is also noteworthy that in such composite ceramic, SiO2 exists as well, which may be mainly due to the natural cogon. Ref. 19 has explained its positive effect with the decrease in thermal conductivities of such hollow fibers.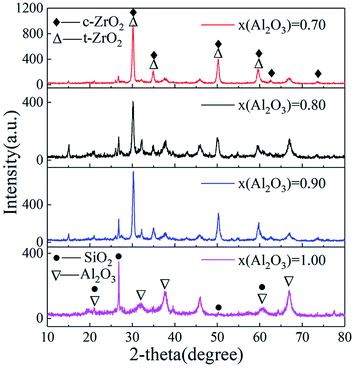 | ||
| Fig. 6 XRD patterns of Al2O3–ZrO2(Y2O3) hollow fibers (▽: PDF#47-1292 Al2O3; △: PDF#50-1089 t-ZrO2; ◆; PDF#49-1642 c-ZrO2; ●: PDF#46-1045 SiO2). | ||
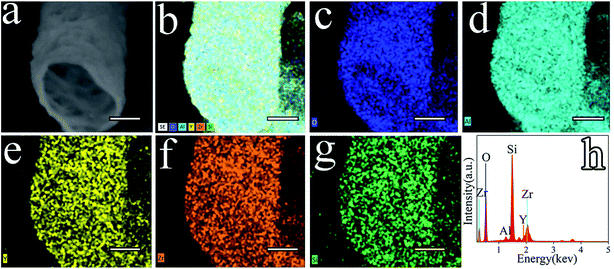
Fig. 7 shows a wide variety of elements diffusing in the Al2O3–ZrO2(Y2O3) composite such as O, Al, Y, Zr, and Si. As confirmed by the XRD results (Fig. 6), Al2O3–ZrO2(Y2O3) hollow fibers are supposed to contain SiO2, Y2O3, Al2O3, Al2SiO5, t-ZrO2 and c-ZrO2 when x(Al2O3) is 0.70. More importantly, the coexistence of multiphases including ZrO2, Al2O3 and SiO2 might hinder the transport of phonons—the main carrier of heat in ceramic materials27,31—thereby leading to the decrease in thermal conductivity of Al2O3–ZrO2(Y2O3) hollow fibers. In addition, ref. 19 has demonstrated the effect of silicon-based compounds from cogon, which can help decrease the thermal conductivity of Al2O3–ZrO2(Y2O3) hollow fibers to some degrees. However, it is difficult to distinguish t-ZrO2 and c-ZrO2 merely from EDS and XRD patterns.28 Therefore, the Raman spectra of Sample V2, V4, V5 and V6 was detected.
Fig. 8 demonstrates the Raman spectra of Al2O3–ZrO2(Y2O3) hollow fibers. The reciprocal effect between ZrO2 and Al2O3 is significant due to the similar peaks at 462 cm−1 and 639 cm−1. For example, with the increase in x(Al2O3), the gap between different peaks drastically decreases and the intensity of the peak at 600 cm−1 marginally increases. Furthermore, a band at 269 cm−1 that only relates to t-ZrO2 moved to a shorter wavelength in the presence of Al2O3.29 It is noticeable that the peak at 639 cm−1 has higher intensity than that at 462 cm−1 in t-ZrO2, while the opposite is true when it comes to c-ZrO2.27,30 Moreover, when x(Al2O3) = 0.70, two major crystalline structures of ZrO2 can be successfully distinguished from their Raman intensities.
Overall, it can be concluded that with varying amounts, t-ZrO2 and c-ZrO2 are the two primary phases for the Al2O3–ZrO2(Y2O3) composite. In addition, their first-order phase transformation also helps to reduce the thermal conductivity to some extent because of the extra energy consumed and scattering of phonons during the phase transition.32,33
3.4 Thermal conductivity
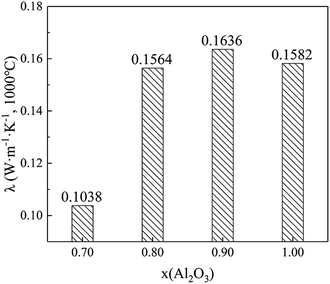
We conducted further investigations for thermal conductivities at 1000 °C on the variation of x(Al2O3) between 0.70 and 1.00; the samples' apparent density was set at 0.2 g cm−3. Thereafter, the testing results are shown in Fig. 9. It can be noted that Sample V2 (x(Al2O3) = 0.70) has the lowest thermal conductivity, which is only 0.1038 W m−1 K−1 at 1000 °C. More importantly, this value is approximately 60% lower than that of traditional ZrO2 solid fibers19 and 34% lower than that of Al2O3 hollow fibers (prepared by the identical four-stage procedure). When the x(Al2O3) increases from 0.80 to 1.00, thermal conductivities of Al2O3–ZrO2(Y2O3) hollow fibers fluctuate between 0.1564 W m−1 K−1 and 0.1636 W m−1 K−1, which adequately shows the effect of compositions in this composite.To summarize, this study presents two mechanisms of thermal conductivity drop: (1) the hollow structure and high porosity hinder the transportation of phonons at a high temperature, thus leading to the low thermal conductivity. (2) Both the coexistence of multiphases and the phase transition between t-ZrO2 and m-ZrO2 could contribute to the decrease in the thermal conductivity of Al2O3–ZrO2(Y2O3) hollow fibers.
3.5 TG-DSC
Fig. 10a shows the TG-DSC thermograms of natural cogon fibers. Having experienced a sintering process in the range of 0–1100 °C, they have lost 87.3% mass in total, leaving stable remnants such as SiO2, MgSiO3, Ca2SiO4, and Al2SiO5.19,25,26 In this course, the reaction was exothermic at 340.2 °C and 440.4 °C due to the burning of cogon fibers,18,19 with an approximate weight loss of 64.5% and 22.8%, respectively.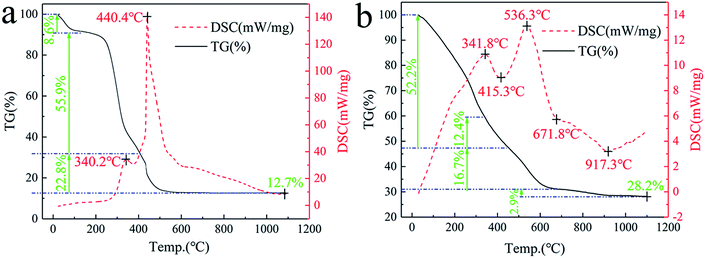 | ||
| Fig. 10 TG-DSC thermograms ((a) cogon fibers; (b) cogon fibers immersed in a mixed solution of ZrOCl2, AlCl3 and Y(NO3)3). | ||
Fig. 10b shows the TG-DSC thermograms of precursors (the cogon fibers immersed in a mixed solution of 74.7 wt% AlCl3, 18.5 wt% ZrOCl2, and 6.8 wt% Y(NO3)3). In contrast to natural cogon fibers, the burning process of the cogon fiber in the precursors changed to 341.8 °C and 536.3 °C, with a weight loss of 39.8% and 16.7%, respectively, as a result of the effect of the inorganic salts.28 The endothermic peak at 415.3 °C corresponding to a 12.4% mass decrease might be caused by the loss in the water of crystallization in ZrOCl2·8H2O, AlCl3·6H2O, and Y(NO3)3·6H2O. The process associated with the phase change from ZrOCl2·2H2O (non-crystal) to t-ZrO2 (unstable at this temperature) contributed to the endothermic peak at around 617.8 °C. Finally, the transition between t-ZrO2 and m-ZrO2 could lead to the endothermic peak at 917.3 °C.34 Thereafter, there was no further mass loss and heat exchange, which indicates the thermal stability of Al2O3–ZrO2(Y2O3) hollow fibers.
4 Conclusion
In this study, we reported a four-stage procedure for the preparation of Al2O3–ZrO2(Y2O3) hollow fibers. Using an orthogonal design, the optimal combination was found as follows: the x(Al2O3) was 0.70, solute mass ratio of the mixture was 15 wt%, dry temperature was 80 °C and the sintering temperature was 1100 °C.Through the optimized conditions, the synthesized Al2O3–ZrO2(Y2O3) hollow fibers have high porosity (95.0%), low thermal conductivity of 0.1038 W m−1 K−1 (at 1000 °C) and low density (0.05–0.10 g cm−3). This adequently showed the effect of orthogonal design in the biomimetic synthesis of natural species. In addition, we discussed the hollow structure and multiphases in the hollow fibers, which are supposed to assist in the decrease of thermal conductivity. Herein, it is worthwhile to apply an orthogonal design for the preparation of Al2O3–ZrO2(Y2O3) hollow fibers and other lightweight refractory fibers with multiphases.
However, as there is no detailed experimental data on the thermal conductivity of Al2O3–ZrO2(Y2O3) hollow fibers, it is difficult to confirm the findings of the study. We hope that our exploratory experiment will help the development of Al2O3–ZrO2(Y2O3) lightweight refractory fibers. Importantly, it is highly desirable to investigate the dynamic process of thermal conductivity of Al2O3–ZrO2(Y2O3) hollow fibers, which could help generalize this four-stage procedure for the preparation of other ceramic fibers.
Conflicts of interest
There are no conflicts to declare.Acknowledgements
The authors wish to express thanks to the National Natural Science Foundation of China (51672131) and the Extracurricular Academic Research Foundation for Undergraduate of NJUST.References
- J. J. Gu, W. Zhang, H. L. Su, T. X. Fan, S. M. Zhu, Q. L. Liu and D. Zhang, Adv. Mater., 2015, 27, 464–478 CrossRef CAS PubMed.
- G. T. Zan and Q. S. Wu, Adv. Mater., 2016, 28, 2099–2147 CrossRef CAS PubMed.
- Z. Y. Chen, F. F. Fu, Y. R. Yu, H. Wang, Y. X. Shang and Y. J. Zhao, Adv. Mater., 2018, 8, 1805431 Search PubMed.
- P. Song, Q. Wang, Z. Zhang and Z. X. Yang, Sens. Actuators, B, 2010, 147, 248–254 CrossRef CAS.
- J. Y. Wan, J. W. Song, Z. Yang, D. Kirsch, C. Jia, R. Xu, J. Q. Dai, M. W. Zhu, L. S. Xu, C. J. Chen, Y. B. Wang, Y. L. Wang, E. Hitz, S. D. Lacey, B. Yang and L. Hu, Adv. Mater., 2017, 29, 1703331 CrossRef PubMed.
- L. P. Fu, Y. S. Zhou, A. Huang, H. Z. Gu and H. W. Ni, J. Am. Ceram. Soc., 2018, 00, 1–10, DOI:10.1111/jace.16205.
- C. C. Xu, H. L. Wang, J. N. Song, X. P. Bai, Z. L. Liu, M. H. Fang, Y. S. Yuan, J. Y. Sheng, X. Y. Li, N. Wang and H. Wu, J. Am. Ceram. Soc., 2018, 101, 1677–1683 CrossRef CAS.
- A. N. Samant and N. B. Dahotre, J. Eur. Ceram. Soc., 2009, 29, 969–993 CrossRef CAS.
- S. J. Kwon, B. M. Jung, T. Kim, J. Byun, J. W. Lee, S. B. Lee and U. H. Choi, Macromolecules, 2018, 51, 10194–10201 CrossRef CAS.
- S. K. Das, Angew. Chem., Int. Ed., 2018, 57, 16606–16617 CrossRef CAS PubMed.
- W. L. Huo, X. Y. Zhang, Y. G. Chen, Y. J. Lu, W. T. Liu, X. Q. Xi, Y. L. Wang, J. Xu and J. L. Yang, J. Am. Ceram. Soc., 2016, 99, 3512–3515 CrossRef CAS.
- K. Ning, H. Ju and K. Lu, J. Am. Ceram. Soc., 2019, 102, 569–577 CAS.
- J. LLorca, J. Y. Pastor and P. Poza, J. Am. Ceram. Soc., 2004, 87, 633–639 CrossRef CAS.
- C. P. Romao, B. A. Marinkovic, U. Werner-Zwanziger and M. A. White, J. Am. Ceram. Soc., 2015, 98, 2858–2865 CrossRef CAS.
- L. Fu, G. Chen, X. S. Fu and W. L. Zhou, J. Am. Ceram. Soc., 2019, 102, 498–507 CrossRef CAS.
- J. Luo, S. Luo, C. X. Zhang, Y. H. Xue and G. Q. Chen, J. Am. Ceram. Soc., 2018, 101, 5151–5156 CrossRef CAS.
- D. Sarkar, B. S. Reddy and B. Basu, J. Am. Ceram. Soc., 2018, 101, 1333–1343 CrossRef CAS.
- T. C. Wang, Q. K. Yu and J. Kong, Int. J. Appl. Ceram. Technol., 2018, 15, 472–478 CrossRef CAS.
- T. C. Wang, Z. H. Zhang, C. H. Dai, Q. Li, Y. C. Li, J. Kong and C. P. Wong, Ceram. Int., 2019, 45, 7120–7126 CrossRef CAS.
- C. M. Pang and H. Huang, Optimal Design of Testing and Data Analysis, Southeast University Press, Nanjing, 2018 Search PubMed.
- G. Xie, Z. Chen, S. Ramakrishna and Y. Liu, J. Appl. Polym. Sci., 2015, 132, 42574, DOI:10.1002/app.42574.
- X. Yang, M. Yang, B. Hou, S. Q. Li, Y. Zhang, R. H. Lu and S. B. Zhang, J. Sep. Sci., 2014, 37, 1996–2001 CrossRef CAS PubMed.
- W. G. Cui, X. H. Li, S. B. Zhou and J. Weng, J. Appl. Polym. Sci., 2007, 103, 3105–3112 CrossRef CAS.
- D. C. Liu, S. X. Xia, H. W. Tang, D. Zhong, B. H. Wang, X. Cai and R. Lin, Int. J. Energy Res., 2018, 1–12, DOI:10.1002/er.4131.
- M. A. Haque, D. N. Barman, M. K. Kim, H. D. Yun and K. M. Cho, J. Sci. Food Agric., 2016, 96, 1790–1797 CrossRef PubMed.
- Y. S. Lin and W. C. Lee, Bioresources, 2011, 6, 2744–2756 CAS.
- F. Hu, S. Wu and Y. G. Sun, Adv. Mater., 2018, 1801001, DOI:10.1002/adma.201801001.
- M. Kogler, E. M. Kock, S. Vanicek, D. Schmidmair, T. Gotsch, M. S. Pollach, C. Heiny, B. Klotzer and S. Penner, Inorg. Chem., 2014, 53, 13247–13257 CrossRef CAS PubMed.
- A. Sobolev, A. Musin, G. Whyman, K. Borodianskiy, O. Krichevski, A. Kalashnikov and M. Zinigrad, J. Am. Ceram. Soc., 2018, 1–8, DOI:10.1111/jace.16232.
- A. R. Krause, H. F. Garces, C. E. Herrmann and N. P. Padture, J. Am. Ceram. Soc., 2017, 100, 3175–3187 CrossRef CAS.
- H. G. Zhu and X. L. Wang, Research and Testing Methods of Material Science, Southeast University Press, Nanjing, 2nd edn, 2015 Search PubMed.
- H. Chen, Z. Yue, D. Ren, H. R. Zeng, T. R. Wei, K. P. Zhao, R. G. Yang, P. F. Qiu, L. D. Chen and X. Shi, Adv. Mater., 2018, 31, 1806518 CrossRef PubMed.
- Z. Q. Hu, Fundamental Course of Inorganic Material Science, Chemical Industry Press, Beijing, 2nd edn, 2011 Search PubMed.
- D. M. Jiang, L. J. Wang and X. K. Che, Preparation and Application of Zirconium Oxychloride, Metallurgical Industry Press, Beijing, 2012 Search PubMed.
Footnote |
| † Electronic supplementary information (ESI) available. See DOI: 10.1039/c9ra01176e |
| This journal is © The Royal Society of Chemistry 2019 |

