 Open Access Article
One-pot synthesis of vanadium-containing silica SBA-3 materials and their catalytic activity for propene oxidation†
Ewa Janiszewska *,
Agnieszka Held
 *,
Krystyna Nowińska and
Stanisław Kowalak
Adam Mickiewicz University, Faculty of Chemistry, Umultowska 89b, 61614 Poznan, Poland. E-mail: eszym@amu.edu.pl; awaclaw@amu.edu.pl
First published on 6th February 2019
Abstract
V-containing silica SBA-3 mesoporous catalysts were prepared by means of one-pot hydrothermal procedure with NH4VO3 or VOSO4 as vanadium precursors under various acidic medium of the reaction mixture (pH < 1, 2.2 or 3.1). The combined spectral techniques (DR UV-vis, FTIR, EPR) as well H2-TPR allowed to determine the nature of vanadium species in the studied samples. A successful incorporation of vanadium into the structure of silica SBA-3 was attained for the samples with low V content (<1 wt%), whereas the V-rich samples (i.e. >5 wt%) exhibited the presence of isolated vanadium and also of polynuclear surface species. The resulting V-bearing samples contain the Brønsted and Lewis acidic centres evidenced by FTIR spectra of adsorbed pyridine and by catalytic activity for 2-propanol decomposition and cumene cracking. Ammonia TPD allowed to estimate the number and strength of acid sites in regards to the vanadium content. Propene oxidation with N2O revealed noticeable activity of the synthesised V-SBA-3 samples in epoxidation reaction. On the basis of TOF analysis indicating the activity of particular vanadium ions it seems that not all of the introduced V atoms take part in the formation of mild electrophilic oxygen species responsible for propene oxide formation.
Introduction
Ordered mesoporous materials with their unique textural properties such as high surface area and large pore volume with a narrow pore size distribution have attracted considerable attention during last decades.1,2 Investigations on synthesis and properties of the mesoporous molecular sieves developed enormously due to their potential application in the field of catalysis, separation and adsorption, host–guest systems, especially for bulky molecules.3–5 The absence of active sites in the framework of these pure siliceous materials limits their direct application as catalysts6,7 but their high surface area makes them good supports of many active phase due to ability to form highly dispersed active species on their surface even at relatively high loadings.Vanadium species supported on mesoporous silica materials such as MCM-41, SBA-15, HMS or MCF are known to be effective catalysts in oxidative dehydrogenation (ODH) of alkanes,8–12 partial oxidation of methane13,14 or methanol oxidation to formaldehyde.15,16 There are some literature reports showing that vanadium containing mesoporous materials obtained by the direct synthesis show better catalytic performance than their vanadium supported counterparts. Their high performance has been attributed to the wide dispersion of highly reducible vanadium-isolated species with tetrahedral coordination.17–22 On the other hand, it was shown that all silica mesoporous materials modified with vanadium are active catalyst in propene epoxidation with N2O as an oxidant. The best results were obtained with catalysts prepared by impregnation of silica SBA-3 with vanadium ions.23 It was evidenced that isolated vanadium species are responsible for high selectivity towards propene oxide (PO), whereas the oligomeric vanadium species or bulk vanadia result in propene oxide isomerization and total oxidation reactions. Since the above mentioned vanadium catalysts, prepared by means of impregnation method, indicated various vanadium species such as isolated, oligomeric, and even bulk vanadia at high V loadings, it was interested to check if the vanadium containing SBA-3 materials prepared by direct synthesis with well-dispersed isolated vanadium species could present enhanced catalytic activity in the studied reaction.
The main aim of the presented work was a direct synthesis of the vanadosilicate SBA-3 molecular sieves. The influence of vanadium source as well as the pH of the initial mixture on the textural and surface properties of the obtained samples was investigated. The resulted materials were characterized by means of standard physicochemical methods to describe the nature of introduced vanadium species and to assess their structural/textural properties. The catalytic activity of the obtained samples was tested in the reactions requiring acidic sites (2-propanol decomposition, cumene cracking) and examined in selective propene oxidation.
Experimental
Material preparation
The mesoporous vanadosilicates SBA-3 materials were synthesized by slightly modified procedure reported by Stucky et al.24 Cetyltrimethylammonium bromide (CTABr, Aldrich) and tetraethylorthosilicate (TEOS, Aldrich) were used as a surfactant and silica source, respectively. Vanadyl sulfate hydrate (VOSO4·5H2O, Aldrich) or ammonium metavanadate (NH4VO3, POCh, Poland) were used as vanadium precursors. Concentrated HCl aqueous solution (37%, POCh) was used as the acid source. Aqueous ammonia (25%, POCh) was used to adjust the acidity of the initial mixture. The vanadosilicate SBA-3 samples were synthesized in strongly acidic condition. The following procedure was conducted: CTABr was dissolved in diluted HCl and then solution of vanadium source was admitted dropwise to the acidic CTABr solution. After stirring for 15 minutes, TEOS was added gradually (Si/V = 10) with continuous stirring for next 30 min., which resulted in formation of white gel. The molar composition of the gel was 1 Si![[thin space (1/6-em)]](https://www.rsc.org/images/entities/char_2009.gif) :
:![[thin space (1/6-em)]](https://www.rsc.org/images/entities/char_2009.gif) 0.1 V
0.1 V![[thin space (1/6-em)]](https://www.rsc.org/images/entities/char_2009.gif) :
:![[thin space (1/6-em)]](https://www.rsc.org/images/entities/char_2009.gif) 0.125 CTABr
0.125 CTABr![[thin space (1/6-em)]](https://www.rsc.org/images/entities/char_2009.gif) :
:![[thin space (1/6-em)]](https://www.rsc.org/images/entities/char_2009.gif) 10.9 HCl
10.9 HCl![[thin space (1/6-em)]](https://www.rsc.org/images/entities/char_2009.gif) :
:![[thin space (1/6-em)]](https://www.rsc.org/images/entities/char_2009.gif) 164 H2O. The strongly acidic medium (pH < 1) was used for preliminary syntheses. In further experiments pH of the suspension was increased with aqueous ammonia up to the value of 2.2 or 3.1, respectively. Stirring was continued for another 2 h and then the mixture was left at ambient, static condition for 22 h. The resulting precipitate was filtered, dried and calcined in air at 500 °C for 8 h. The calcined samples were colorless, but they turned yellow when exposed to atmospheric humidity. The samples were labeled as follows: Vxy-SBA-3, where: x stands for vanadium precursor (s – vanadyl sulfate, m – ammonium metavanadate), y stands for pH value of the synthesis mixture: 1 for synthesis at pH < 1, 2 for synthesis at pH = 2.2, 3 for synthesis at pH = 3.1.
164 H2O. The strongly acidic medium (pH < 1) was used for preliminary syntheses. In further experiments pH of the suspension was increased with aqueous ammonia up to the value of 2.2 or 3.1, respectively. Stirring was continued for another 2 h and then the mixture was left at ambient, static condition for 22 h. The resulting precipitate was filtered, dried and calcined in air at 500 °C for 8 h. The calcined samples were colorless, but they turned yellow when exposed to atmospheric humidity. The samples were labeled as follows: Vxy-SBA-3, where: x stands for vanadium precursor (s – vanadyl sulfate, m – ammonium metavanadate), y stands for pH value of the synthesis mixture: 1 for synthesis at pH < 1, 2 for synthesis at pH = 2.2, 3 for synthesis at pH = 3.1.
For comparison, pure silica SBA-3 were synthesized at pH <1 and 2.2 using the same procedure in the absence of vanadium precursor. The silica SBA-3 materials were synthesized as a benchmark matrix for the vanadosilicate SBA-3 samples.
Material characterization
The products were characterized by means of standard methods. Powder X-ray diffraction patterns were collected on a Philips Bruker D8 Advance diffractometer using Cu Kα radiation (λ = 1.54056 Å). Vanadium content in the calcined samples was determined by ICP-OES on a Varian Vista-MPX spectrometer. Transmission electron microscope (TEM) images were recorded on a JEOL 2000 microscope operating at accelerating voltage of 80 kV. The materials studied were deposited on nickel grids coated with a carbon film. The N2 adsorption/desorption isotherms were measured at −196 °C on a Quantachrome Nova 1000 apparatus. The samples were outgassed at 300 °C prior to the measurement. The specific surface area was determined using the BET method. The total volume of pores (at p/p0 = 0.98) was calculated using the single point model. Mesopore size distributions were determined using the BJH model. UV-vis diffuse reflectance spectra of vanadium modified samples were recorded at room temperature on a Cary 100 UV-vis spectrometer (Varian) in the range of 190–800 nm. Before the measurement, the samples were heated for 1 h at 400 °C in order to remove water. The spectra of the samples were deconvoluted using multi-peaks fit in OriginPro 8 software. The above calculations were useful for determining the location and area of the bands. The electron spin resonance (ESR) spectra of the as-synthesized and calcined samples were recorded at −196 °C at X-band frequency using a RADIOPAN SE/X 2547 spectrometer. The g value was calculated according to the commonly used equation g = μB /hν.25 The Fourier transform infrared spectra (KBr and self-supported wafers) were recorded with Bruker Tensor 27 spectrophotometer. The acidity of the samples was estimated using pyridine as a basic probe. The samples were pressed into a thin wafer and placed in the vacuum cell. Then they were outgassed at 400 °C for 2 h, followed by pyridine adsorption at room temperature. The pyridine desorption was carried out for 30 min at each of the selected temperatures (100, 200, 300, and 400 °C). The spectra were recorded at room temperature. The NH3-TPD measurements of acidity were performed in a flow reactor. In a typical experiment, about 40 mg of sample was heated in He at the rate of 10° min−1 to 500 °C and kept at that temperature for 0.5 h, then cooled down to 120 °C and afterwards saturated with ammonia for 0.5 h. The physically adsorbed NH3 was removed by purging with helium flow at 120 °C for 1 h. The TPD analysis was carried in the range 100–600 °C with a heating rate 10° min−1. The desorbed NH3 was detected by a TCD analyzer. All TPD-NH3 profiles presented in this work were normalized to the same sample weight. The H2-TPR measurements were carried out in a homemade quartz micro-reactor where the sample (30 mg) was placed and gradually heated (10° min−1) up to 900 °C in reducing flowing gas (5% molar H2 in Ar, 70 ml min−1). The H2 consumption was recorded by means of TCD. A gas condenser operated at −80 °C and placed prior TCD was used to remove water possibly formed by reduction. All TPR-H2 profiles presented in this work were normalized to the same sample weight.Catalytic activity measurement
The catalytic activity of the samples was examined in the 2-propanol (POCh) decomposition and cumene cracking (Aldrich). The catalytic tests were conducted in a pulse microreactor attached to the gas chromatograph (GC) equipped with TCD. The catalyst powder samples (0.015 g) were activated in helium stream at 350 °C (2-propanol) or 450 °C (cumene) for 0.5 h prior to the catalytic tests. The decomposition of 2-propanol was carried out at 230 °C and cumene cracking at 350 °C. The volume of the injected substrate was 1 μl.The catalytic tests for propene oxidation were performed in continuous flow reactor. Catalytic experiments were carried out at 380 and 400 °C, under atmospheric pressure, with WHSV = 3420 ml h−1 gcat−1, related to contact time of 1.1 s. Prior the measurements, the catalysts were heated in flowing helium at 450 °C for 30 min. Substrates: propene and N2O were diluted with helium (molar ratio of propene![[thin space (1/6-em)]](https://www.rsc.org/images/entities/char_2009.gif) :
:![[thin space (1/6-em)]](https://www.rsc.org/images/entities/char_2009.gif) nitrous oxide
nitrous oxide![[thin space (1/6-em)]](https://www.rsc.org/images/entities/char_2009.gif) :
:![[thin space (1/6-em)]](https://www.rsc.org/images/entities/char_2009.gif) helium = 1
helium = 1![[thin space (1/6-em)]](https://www.rsc.org/images/entities/char_2009.gif) :
:![[thin space (1/6-em)]](https://www.rsc.org/images/entities/char_2009.gif) 15
15![[thin space (1/6-em)]](https://www.rsc.org/images/entities/char_2009.gif) :
:![[thin space (1/6-em)]](https://www.rsc.org/images/entities/char_2009.gif) 12.5). The products were analyzed using on-line GC, equipped with FID and TCD detectors. The catalytic performance was expressed as propene conversion (%), selectivity to oxygen-bearing products (%) and yield of propene oxide (%). The calculation is described elsewhere.23
12.5). The products were analyzed using on-line GC, equipped with FID and TCD detectors. The catalytic performance was expressed as propene conversion (%), selectivity to oxygen-bearing products (%) and yield of propene oxide (%). The calculation is described elsewhere.23
TOF was evaluated on the basis of the number of propene (moles) transformed to propene oxide related to quantity of vanadium in the SBA-3.26 Space time yields (STY) were calculated as amount (g) of PO per mass of catalyst (kg) per hour.
The results recorded after 20 min of the reaction course were shown and used for discussion, unless otherwise stated.
Results and discussion
Catalyst characterization
Table 1 comprises the main textural properties of all synthesized samples, as derived from ICP analysis and N2 physisorption isotherms. The elemental analysis of all samples obtained with vanadium sulfate shows much lower V content in the products than in the starting gels (Table 1). It indicates that only a small fraction of vanadium is included into the walls of SBA-3 material. In the series synthesized with VOSO4 the amount of vanadium in the samples is similar regardless of pH of the synthesis mixture. At low pH (<1) in the synthesis mixture exist VO2+ cations and positive charge of silica species that do not interact with each other because of the same charge.6,27 Therefore, vanadium atoms are not introduced to the structure. If the pH of the synthesis mixture rises above the zero net charge of silica (pH > 2), the Si species become negatively charged which should enhance the interaction with the V species. Surprisingly, the amount of vanadium is comparable in all the samples regardless of pH of the synthesis mixture. VO2+ cations during synthesis at pH > 2 transform into vanadyl hydroxyl species according to eqn (1) and generate H+.27 It can probably cause lowering the pH of synthesis mixture below the zero net charge of silica and impede the tendency of silica species to interact with the [O![[double bond, length as m-dash]](https://www.rsc.org/images/entities/char_e001.gif) V–OH]+ species.
V–OH]+ species.
VO2+ + H2O→ [HO–V![[double bond, length as m-dash]](https://www.rsc.org/images/entities/char_e001.gif) O]+ + H+ O]+ + H+
| (1) |
| Sample | V source | pH | Va [wt%] | Vat/nm2 | Si/V | SBETb [m2 g−1] | Vtc [cm3 g−1] | Dd [nm] |
|---|---|---|---|---|---|---|---|---|
| a Estimated from the ICP results.b BET specific surface area.c Total pore volume.d The average pore diameter. | ||||||||
| SBA-31 | — | <1 | — | — | ∞ | 1432 | 0.74 | 2.06 |
| SBA-32 | — | 2.2 | — | — | ∞ | 1213 | 0.69 | 2.27 |
| Vs1-SBA-3 | VOSO4 | <1 | 0.48 | 0.04 | 165 | 1411 | 0.74 | 2.09 |
| Vs2-SBA-3 | VOSO4 | 2.2 | 0.54 | 0.05 | 140 | 1275 | 0.73 | 2.29 |
| Vs3-SBA-3 | VOSO4 | 3.1 | 0.49 | 0.04 | 162 | 1327 | 0.71 | 2.14 |
| Vm1-SBA-3 | NH4VO3 | <1 | 0.26 | 0.02 | 354 | 1370 | 0.73 | 2.10 |
| Vm2-SBA-3 | NH4VO3 | 2.2 | 5.27 | 0.61 | 14 | 1020 | 0.58 | 2.27 |
| Vm3-SBA-3 | NH4VO3 | 3.1 | 5.97 | 0.73 | 12 | 965 | 0.54 | 2.24 |
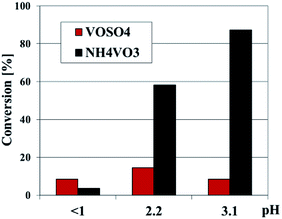
The sample obtained in very acidic medium with NH4VO3 contains the lowest amount of vanadium because lack of hydrolysis of NH4VO3 at pH values less than 1.3.19 The V species were successfully incorporated into the vanadosilicate SBA-3 structure by using NH4VO3 as vanadium precursor along with increasing pH. The V content in the samples prepared at pH of 2.2 and 3.1 were determined to be 5.27 wt% and 5.97 wt%, respectively. It is due to increasing hydrolysis rate of NH4VO3 that matched easily the silicon precursor. This might enhance the interaction between the V–OH and Si–OH species in the synthesis gel causing the increase in vanadium content in the resulting vanadosilicate. The ICP results imply that NH4VO3 seems to be more efficient agent than VOSO4 in forming of vanadosilicate SBA-3 structure.
Fig. 1 reports the FT-IR spectra of samples in KBr pellets in the 1400–600 cm−1 range, where vibrational modes are observed.
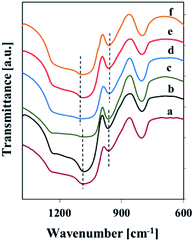 | ||
| Fig. 1 FT-IR spectra (with KBr) of silica and vanadosilicate SBA-3 samples: (a) SBA-31, (b) Vs1-SBA-3, (c) Vm1-SBA-3, (d) SBA-32, (e) Vs2-SBA-3, (f) Vm2-SBA-3. | ||
The FT-IR spectra (KBr) of silica and vanadosilicate SBA-3 samples show the bands typical of silica, namely at 800 cm−1 originating from the symmetric stretching vibration (Si–O–Si) and at 1090 cm−1 due to the asymmetric stretching vibration (Si–O–Si). The IR band at 960 cm−1 can be assigned to Si–OH stretching vibration or to Si–O–M asymmetric stretching vibration.28 Hence, the band in the 960 cm−1 region cannot be taken as a solid proof for the incorporation of vanadia in the structure of V-SBA-3 samples. However, the shift of this band towards higher wavenumber and the corresponding shift of the 1090 cm−1 band towards lower wavenumber for vanadosilicate samples shows a possible incorporation of vanadium in the SBA-3 structure.28
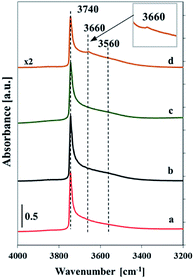 | ||
| Fig. 2 FTIR spectra recorded at room temperature of silica SBA-32 (a), Vs2-SBA-3 (b), Vm1-SBA-3 (c) and Vm2-SBA-3 (d) samples outgassed at 400 °C (10−3 Pa) for 2 h. | ||
The FTIR spectra of self-supported samples outgassed at 400 °C in the range of OH groups show a very sharp band at 3740 cm−1 with a tail at lower wavenumber (centered at ca. 3560 cm−1) (Fig. 2). The band at 3740 cm−1 indicates the presence of isolated silanols, whereas the broad band at lower wavenumber is ascribed to the silanol groups involved in hydrogen bonding and indicates the occurrence of a heterogeneous hydroxyl population.20,21 The profile of the spectrum of silica SBA-3 matrix is similar to the spectra of low-loaded vanadium samples, which may result from very low vanadium concentration. The vanadosilicate samples with high vanadium content exhibit additional band at 3660 cm−1 assigned to the V–OH stretching mode.21 The lower intensity of the spectra of the samples with high vanadium content is caused by diminished transparency upon their evacuation. It is caused by turned the color of the samples to dark-green due to reduction of external vanadium oxide species.
The pore ordering of the samples was confirmed by the low angle XRD analysis (Fig. 3). The presence of vanadium in the reacting mixture did not disturb the formation of SBA-3 structure. Samples synthesized in strong acidic medium (pH < 1) showed three distinct reflections characteristic of SBA-3 structure, matching well these reported in the literature and indicating a highly ordered mesopore system.29 The intensity of reflections is similar to that of pure silica SBA-3 sample (Fig. 3A). It suggests comparable ordering of V-SBA-3 samples with ordering of pure silica SBA-3 synthesized in similar conditions (pH < 1). The increase in pH of the initial mixture resulted in a little lower intensity of XRD reflections for series obtained with VOSO4 (Fig. 3B). The more dramatic decrease in intensity of XRD reflections is observed for the series prepared with NH4VO3 (Fig. 3C). The reduction of the reflection intensity for this series can be explained by higher X-ray adsorption factor of vanadia in comparison to X-ray factor of silicon and implied the increase of vanadium content in the structure of mesoporous materials.18 These results are in agreement with ICP analysis showing the highest amount of vanadium for the samples synthesized with NH4VO3 at higher pH (Table 1). Nevertheless, the presence of two weak reflections attributed to (110) and (200) in XRD patterns of Vm2-SBA-3 and Vm3-SBA-3 samples suggests their ordered structure. The increase in the (100) peak width may suggest some distortion of the structure of the samples of both series synthesized at higher pH.19
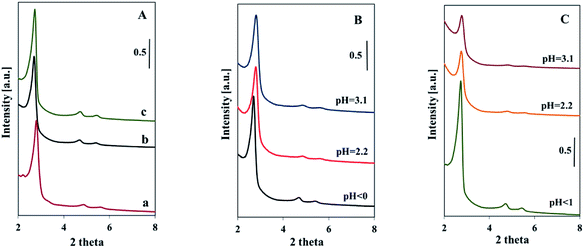 | ||
| Fig. 3 Low-angle XRD patterns of samples synthesized: in strongly acidic medium (pure SBA-3 (a), with VOSO4 (b), with NH4VO3 (c)) (A); at indicated pH: with VOSO4 (B), with NH4VO3 (C). | ||
XRD patterns in the wide angle range were recorded in order to check the presence of any bulk crystalline vanadium oxides species on the outer sample surface. However, there are known the limitations of the XRD analysis concerning the concentration of the investigated species and the size of crystallites. Fig. S1 (ESI†) shows the wide angle XRD patterns of V-SBA-3 materials of both series. No distinct diffraction reflections corresponding to any crystalline vanadium oxides were observed at higher angles (lack of reflection at 16, 22, 26 and 32°). Only a very broad signal in the 2θ range 15–30° has been noticed, which confirms the amorphous nature of the samples. The moieties of vanadium oxides in the samples, if any, might be highly dispersed in the channels or on the external surface. The only exception are samples synthesized with NH4VO3 at pH > 1 (with the highest amount of vanadium). The XRD patterns of these samples showed diffraction reflections at 25.8 and 50.6° corresponding to some external vanadium oxide species.
The ordered structure of vanadosilicate SBA-3 samples was also confirmed by transmission electron microscopy (TEM). Fig. 4 depicts the images of selected samples: silica SBA-3, Vm2-SBA-3 and Vs2-SBA-3 materials synthesized at pH = 2.2. The micrographs of all samples show well-ordered hexagonal arrays of mesoporous channels which is in accordance with the results of low angle XRD and of nitrogen adsorption–desorption data. In the case of the low vanadium samples no V-species are deposited inside the hexagonally arranged mesopores (Fig. 4B). The images of samples with high amount of vanadium (samples Vm2-SBA-3 and Vm3-SBA-3) show well dispersed aggregates assigned to external VxOy species. These results are consistent with the XRD as well as with the UV-Vis data discussed hereafter.
 | ||
| Fig. 4 TEM images of samples synthesized at pH = 2.2: silica SBA-3 (A) and vanadosilicate SBA-3 obtained with VOSO4 (B) and with NH4VO3 (C). | ||
The N2 adsorption–desorption isotherms and pore size distribution obtained from the desorption branch of calcined V-SBA-3 and pure silica materials are shown in Fig. 5. All the isotherms are of type IV according to IUPAC classification, which is typical for mesoporous materials. As the relative pressure increases to ca. p/p0 ∼ 0.25 the isotherms of silica and vanadosilicate SBA-3 samples synthesized at low pH exhibit a sharp step attributed to capillary condensation of nitrogen within uniform mesopores (Fig. 5A). This step for samples synthesized at higher pH, especially these obtained with NH4VO3, is less prominent. This indicates broader pore size distribution for these samples and is well visible in pore size distribution curves (Fig. 5B).29 The pore size distribution presented in Fig. 5B indicates narrow pore size range for all the samples, which become broader along with pH values increase, especially for series synthesized with NH4VO3. The isotherms of samples obtained at pH 2.2 and 3.1 with NH4VO3 show additional hysteresis loop at high partial pressure (p/p0 > 0.8). According to the literature it is indicative of some amount of interparticle mesoporosity.30
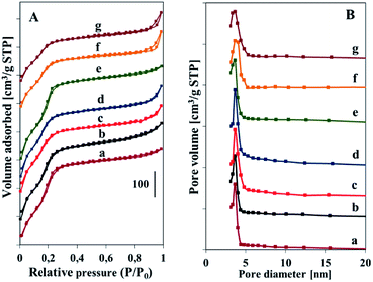 | ||
| Fig. 5 N2 adsorption–desorption isotherms (A) and pore size distribution (B) of calcined samples: (a) SBA-31, (b) Vs1-SBA-3, (c) Vs2-SBA-3, (d) Vs3-SBA-3, (e) Vm1-SBA-3, (f) Vm2-SBA-3, (g) Vm3-SBA-3. | ||
The textural properties of the obtained samples are given in Table 1. The series obtained with VOSO4 show higher value of surface area and pore volume in comparison to samples obtained with NH4VO3, whereas the pore diameters are lower for these series. With growing pH of the synthesis mixture (regardless of the vanadium precursor) the surface area and pore volume decreases. This effect can be explained regarding the rate of silica condensation. At an elevated pH value a higher degree of silicate condensation is attained. The more rapid condensation should not impair the micelles markedly and subsequently less pronounced interaction lead to a lower surface area and pore volume.6 This effect is more pronounced for series obtained with NH4VO3. The slight decrease in surface areas with increasing pH for the samples obtained with VOSO4 (less than 10%) can be caused by lowering the pH of synthesis mixture during synthesis by protons generated during transformation of VO2+ cation to vanadyl hydroxyl species (eqn (1)). Such changing the pH of synthesis gel influences the rate of silica condensation leading to materials with higher surface area and pore volume in comparison to the materials synthesized with NH4VO3. The much lower surface areas as well as pore volume of the samples synthesized at higher pH with NH4VO3 can be additionally a result of reducing the overall accessible porosity by the external vanadium species that are seen in the TEM micrographs (Fig. 4C). Similar decrease of surface area and pore volume for high V loading samples (above 3 wt%) was also observed by other authors for vanadium containing SBA-15 materials.17,18
The average pore diameters of vanadosilicate SBA-3 synthesized at low pH (<1) of both series are higher than these of their silica counterparts synthesized at the same pH. The pore size for both series increases with the pH applied during synthesis up to value 2.2 and then declines along with further pH increase. Similar tendency was observed by Gao et al.19 These changes are connected with the variation of hydrolysis and condensation time with changing the pH of reaction mixture.
H2-TPR curves of vanadosilicates SBA-3 are reported in Fig. 6. It can be noted that silica SBA-3 samples did not exhibit any reduction peaks and therefore are not shown here for the sake of brevity. The TPR profiles of vanadosilicate SBA-3 samples show only one reduction peak for all the samples with maximum at 475–510 °C assigned to the reduction of isolated tetrahedral vanadium species or low polymeric V–O–V groups.21,31 The profiles of the vanadium richest samples with external VxOy species (determined by XRD and TEM analysis) do not exhibit any additional reduction peak above 650 °C attributed to reduction of bulk V2O5. However, a width of their TPR profiles and shift of the reduction peak to a higher temperature of 510 °C, suggests also the formation of oligomeric and polymeric vanadium species which slightly retard the reduction of V5+. The lack of separate maximum of reduction located at higher temperatures implies, that VxOy on the surface of Vm2-SBA-3 and Vm3-SBA-3 materials is very well dispersed and indicates small size, what can results in its facile reduction. As a consequence, it can cause the overlapping of the reduction peaks of isolated tetrahedral and of VxOy-like polymeric vanadium species.31
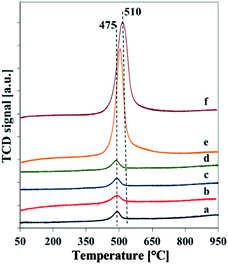 | ||
| Fig. 6 Normalized H2-TPR profiles of calcined samples: (a) Vs1-SBA-3, (b) Vs2-SBA-3, (c) Vs3-SBA-3, (d) Vm1-SBA-3, (e) Vm2-SBA-3, (f) Vm3-SBA-3. | ||
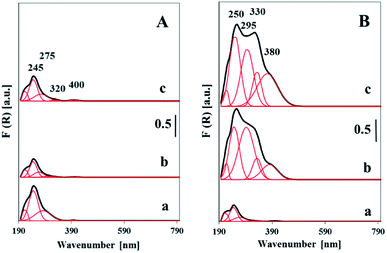
The nature and the coordination of vanadium ions in the vanadosilicate SBA-3 materials were analyzed by DR UV-vis technique (Fig. 7). UV-vis spectra were recorded for both dehydrated and hydrated samples. To distinguish between different vanadium species, the presented spectra have been deconvoluted into four Gaussian curves. All the UV-vis spectra recorded for the samples of both dehydrated series exhibited absorption bands with maxima located in the region of 210 to 400 nm. The intensity of these bands was clearly affected by vanadium loading. The spectra of the samples with low vanadium content (<1 wt%) show bands below 300 nm which overlap. The maximum at ca. 250 nm is attributed to highly dispersed isolated tetrahedral vanadium species combined with oxygen atoms from silica tetrahedral. The band at 280 nm is due to the isolated tetrahedral vanadium species on the surface of silica walls. Similar opinion was presented in literature.32,33 The UV-vis spectra of the high loaded samples (>5 wt%) contrary to aforementioned show much higher intensity. Moreover, two additional intense bands with maxima at 330 and 400 nm have appeared. The latter bands are assigned to V ions with higher (penta- or hexacoordinated) coordination in oligonuclear V–O–V nano-clusters.32,34 The comparison of UV-vis spectra recorded for the samples with different V-loading gives rise to the conclusion that along with growing vanadium concentration the significant increase of the contribution of oligomeric and polymeric vanadium species is observed (Fig. 7, Table S1†). For high-loaded samples the width of the band at 400 nm suggests the presence of some fraction of nano VxOy phase. This corresponds to the XRD and TEM data indicating the presence of dispersed nano-vanadia species.
The comparison of hydrated and dehydrated samples (ESI, Fig. S2†) indicates that the spectra of the hydrated samples are widened towards higher wavelengths contrary to those of dehydrated ones. Which is worth to underline, the absorption band at 250 nm is not sensitive to moisture treatments, whereas the bands above 300 nm are significantly altered (Fig. S2†). Broadening of the bands at 300 and 400 nm indicates the coordination bonding of water molecules to vanadium species. It leads to the conclusion, that the both groups of synthesized catalysts, Vsy-SBA-3 and Vmy-SBA-3 comprise the vanadia species located inside the walls which are thermally and chemically stable and also the accessible to water vanadium species located on the wall surface and as the surface VxOy species.
The ESR spectra collected at −196 °C are shown in Fig. S3 (ESI†). The samples of both series exhibit paramagnetic V(IV) signals with slightly different spectroscopic features for as-synthesized and for calcined samples. The spectra indicate an axially symmetric set of eight lines originating from vanadyl species coupled to its own nuclear spin. It indicates that during hydrothermal synthesis some vanadium ions maintain the VO2+ form in series synthesized with VOSO4, whereas in series obtained with NH4VO3 they are transformed into V(IV). The spin Hamiltonian parameters values of g∥ ∼ 1.93, g⊥ ∼ 1.98 and the hyperfine coupling constant A∥ ∼ 202 G, A⊥ ∼ 77 G (Table 2S, ESI†) are in good agreement with the values for vanadyl ions with distorted pseudo-octahedral coordination which frequently occurred in molecular sieves containing vanadium.35–37 The ESR spectra of the as synthesized samples show lower resolution of the hyperfine structure than the calcined samples which became sharper due to partial conversion of V4+ to V5+.38 The well-resolved hyperfine splitting patterns obtained for calcined samples indicate that the VO2+ ions are well dispersed inside the pore channels of SBA-3 materials.36 The absence of a broad ESR spectrum for calcined samples indicates the absence of vanadium in form of agglomerated clusters.39
The total acidity of the samples was assessed by TPD of adsorbed ammonia (Fig. 8 and Table 2). Generally, the TPD profiles show one broad desorption peak in the temperature range of 210–540 °C, which corresponds to the weak, medium and strong acid sites.6 The number of acid sites, estimated from the amount of chemisorbed ammonia (Table 2), corresponds to vanadium content in the samples and is the highest for the vanadium richest one. The maximum of ammonia desorption is shifted to the higher temperatures for the samples prepared at increased pH of the initial mixtures for both series of catalysts. It indicates a formation of stronger acid sites in the samples synthesized at higher pH.
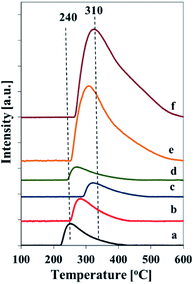 | ||
| Fig. 8 NH3-TPD profiles of calcined samples: (a) Vs1-SBA-3, (b) Vs2-SBA-3, (c) Vs3-SBA-3, (d) Vm1-SBA-3, (e) Vm2-SBA-3, (f) Vm3-SBA-3. | ||
| Sample | NH3 desorbed [μmol g−1] |
|---|---|
| Vs1-SBA-3 | 36 |
| Vs2-SBA-3 | 38 |
| Vs3-SBA-3 | 35 |
| Vm1-SBA-3 | 23 |
| Vm2-SBA-3 | 485 |
| Vm3-SBA-3 | 661 |
The acidity of the vanadosilicate SBA-3 samples was also confirmed by their catalytic activity for reactions requiring acid sites. The samples under study show the activity in 2-propanol decomposition (Fig. 9). The activity correlates with the number of introduced vanadium and the highest activity show the samples synthesized at elevated pH with NH4VO3 as a vanadium precursor. All the samples initiate only dehydration of alcohol, what indicates the presence of acid active sites on the surface of catalysts due to the presence of V atoms. The activity in cumene cracking is negligible (∼1.0% only for vanadium rich samples), which points out a weak strength of the acid sites. These results confirm the data obtained from TPD of ammonia.
The nature of the acid sites was characterized by FT-IR studies of adsorbed pyridine (Fig. 10). All the samples indicate the FTIR band assigned to pyridine bound to weak Lewis acid centers (1575 cm−1), bands attributed to pyridine combined with strong Lewis acid sites (1455 cm−1, 1608 cm−1), bands due to pyridine adsorbed on Brönsted acid sites (1550 cm−1, 1640 cm−1), and a band attributed to pyridine associated with both Lewis and Brönsted acid sites (1490 cm−1).40,41 The spectra taken after low temperature desorption of pyridine (Fig. 10, spectra a) indicate additional band at 1596 cm−1 due to pyridine forming hydrogen bonds with silanol groups. This band, vanished after evacuation at 200 °C, is more intensive for the samples with the low vanadium content. The band attributed to weak Lewis acid sites (at 1575 cm−1) decays after evacuation at 200 °C. The intensity of bands assigned to strong Lewis and Brönsted acid sites is drastically reduced after evacuation at 200 °C, which indicates a high contribution of weak acid sites of both types. The diminishing of these bands is more pronounced for the samples with low content of vanadium. It clearly evidences that the higher vanadium content results in higher strength of Lewis and Brönsted acid sites. The intensity of bands attributed to Lewis acid sites is much higher compared to that of Brönsted acid sites for all samples. It confirms predominance of Lewis acid sites in the studied samples. The intensity of bands attributed to both, Lewis and Brönsted acid sites, correlates with the amount of vanadium in the samples and it is higher for the vanadium richer catalysts. The FTIR spectra of pyridine adsorbed on the pure silica SBA-3 (not shown) indicates only the bands originating from pyridine hydrogen-bonded to silanol groups (1596 cm−1) and that assigned to pyridine bound to weak Lewis acid centers (1575 cm−1). There are no bands at 1455 or 1550 cm−1 attributed to Lewis and Brönsted acid sites, respectively.
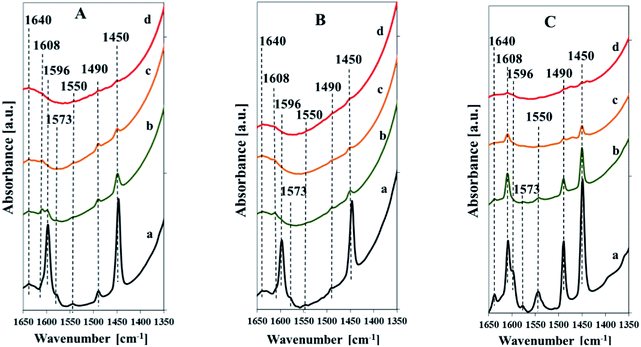 | ||
| Fig. 10 FTIR spectra of Vs2-SBA-3 (A), Vm1-SBA-3 (B) and Vm2-SBA-3 (C) after adsorption of pyridine and desorption at different temperatures: 100 °C (a), 200 °C (b), 300 °C (c), 400 °C (d). | ||
Interaction of reagents (propene and N2O) with the surface of catalysts at various temperatures was followed by means of IR spectroscopy (Fig. 11). Reaction mixture contacted with catalysts surface at RT and 200 °C showed IR bands related to adsorbed propene species (1640 and 1450 cm−1). Starting from 300 °C, propene and nitrous oxide adsorption resulted in the appearance of the bands at about 1715, 1695, 1680, and 1620 cm−1. The first three bands (1715, 1695 and 1680 cm−1) can be assigned to carbonyl C![[double bond, length as m-dash]](https://www.rsc.org/images/entities/char_e001.gif) O stretching vibration, whereas the last one (1620 cm−1) may indicate the formation of water or surface carbonates as a result of total oxidation reaction.42,43 The band at about 1620 cm −1 was markedly more intensive in the case of the vanadium rich samples than for the catalyst with low vanadium loading. For the sample with higher V loading (about 5 wt%) the band at 1560 cm−1 appeared, which according to Davydov et al.44 could be assigned to carboxylates (i.e. formates and acetates). The appearance of this band is accompanied by additional broad band with maximum at 1440 cm−1 attributed to C–H bending vibrations which implies a formation of acetone. An increase in the temperature of the interaction results in increasing intensity of the bands at 1560 and 1440 cm−1.
O stretching vibration, whereas the last one (1620 cm−1) may indicate the formation of water or surface carbonates as a result of total oxidation reaction.42,43 The band at about 1620 cm −1 was markedly more intensive in the case of the vanadium rich samples than for the catalyst with low vanadium loading. For the sample with higher V loading (about 5 wt%) the band at 1560 cm−1 appeared, which according to Davydov et al.44 could be assigned to carboxylates (i.e. formates and acetates). The appearance of this band is accompanied by additional broad band with maximum at 1440 cm−1 attributed to C–H bending vibrations which implies a formation of acetone. An increase in the temperature of the interaction results in increasing intensity of the bands at 1560 and 1440 cm−1.
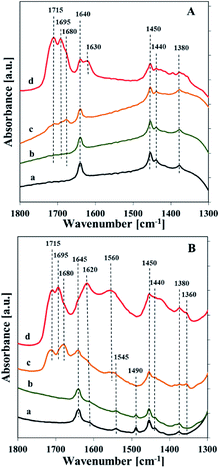 | ||
| Fig. 11 FTIR spectra of Vs2-SBA-3 (A) and Vm2-SBA-3 (B) recorded after contact with reagents (propene and N2O) at different temperatures: room temperature (a), 200 °C (b), 300 °C (c), 400 °C (d). | ||
Catalytic test for selective propene oxidation
Vanadium modified SBA-3 mesoporous materials have been tested as catalysts for propene epoxidation with N2O at 380 and 400 °C. The results of catalytic reaction were correlated with vanadium content and with synthesis conditions as well as with vanadium sources (VOSO4 or NH4VO3). The vanadium species distribution and their localization in the SBA-3 structure as well as number, nature and strength of generated acidic sites are also taken into consideration. According to earlier paper,22 and consistently to the characterization presented above, isolated vanadium species in tetrahedral coordination are especially active in selective propene oxidation. Propene oxide is the most desirable product in the catalytic oxidation of propene.All the V-SBA-3 samples show activity in propene conversion, which depends on the reaction temperature, vanadium precursor and vanadium content (Fig. 12). For the series prepared with VOSO4 a small decrease of propene conversion is observed along with growing pH of the sample synthesis. Since all the samples contain similar V content (i.e. ∼0.5 wt%) the decreasing propene conversion could be assigned to lower surface area indicating lower ordering of SBA-3 structure. On the other hand, the activity of the series prepared with NH4VO3 is strongly affected by synthesis conditions. According to ICP analysis, at higher pH (i.e. 2.2 and 3.1) much larger amount of vanadium (above 5 wt%) could be introduced into the SBA-3 materials. We have already reported in our previous work45 that the best catalytic results in propene oxidation were achieved for the catalysts with vanadium content in the range of 3–5 wt%. In the present studies, conversion of propene at 400 °C reached even 15% for Vm2-SBA-3 and Vm3-SBA-3 samples.
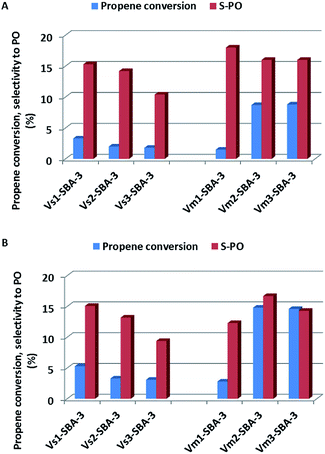 | ||
| Fig. 12 Catalytic activity (propene conversion and selectivity to PO: propene oxide) of V-SBA-3 samples in propene epoxidation at different reaction temperatures: (A) at 380 °C and (B) at 400 °C. | ||
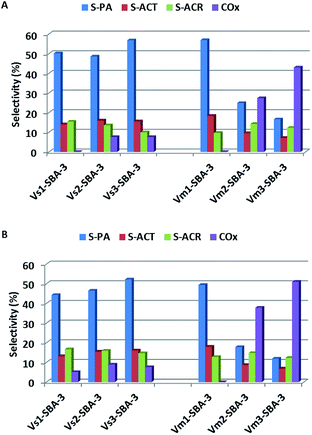
V-SBA-3 samples show noticeable activity towards propene epoxidation. However, neither vanadium content nor vanadium precursor affect markedly the selectivity to propene oxide and it never exceed 20%. Besides PO, other organic oxygen-bearing products, such as propionaldehyde (PA), acetone (ACT), and acrolein (ACR) were also detected in the reaction products (Fig. 13). At lower vanadium loading (<1 wt%), regardless of vanadium precursor and synthesis conditions, the main oxidation product of propene was propionaldehyde reaching about 50%. Selectivity to acrolein and acetone was in the range of 8–15% and it was not noticeably affected neither by the synthesis conditions nor by the reaction temperature. Those results are consistent with FTIR analysis indicating the formation of products with carbonyl group (Fig. 11). Along with the increase of vanadium content in the samples the selectivity to PA significantly decreased at the expense of carbon oxides. Similar observation has been reported for vanadium modified SBA-3 materials prepared by means of impregnation procedure.45 On the basis of UV-vis spectra (Fig. 7B) and also from H2-TPR measurements (Fig. 6) we can assume that the catalysts with higher V concentration comprise different forms of vanadium species, including the isolated tetrahedral forms as well as some polymeric moieties. According to Bell et al.46 the oligomeric vanadium species have been recognized as the centers responsible for the total oxidation reaction. Furthermore, the evaluations of the selectivity to COx with the vanadium loading matches very well the acidity of the samples. The increasing vanadium concentration results in the growing number of acidic centers (especially of the Lewis nature). It has been shown in literature, that the interaction of oxygenates resulting from propene oxidation with acidic sites is responsible for their strong adsorption.42 Interaction of polymeric vanadium species with species adsorbed on acidic sites results in their transformation to carbon oxides. This opinion is consistent with FTIR data obtained after adsorption of reagents (Fig. 11), where higher intensity of the band at 1620 cm−1, assigned to COx formation, and at 1440 and 1560 cm−1 have been observed for catalysts with high vanadium content synthesized in the presence of NH4VO3.
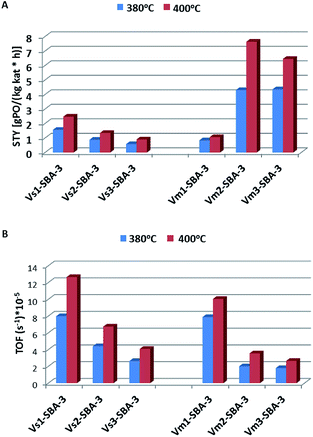
Fig. 14A shows the formation rates of PO per unit mass of catalyst per unit time, STY, obtained on V-SBA-3 catalysts. The catalytic results presented here suggest that the specific activity expressed as STYPO increases along with rising vanadium content. The activity of both series of V-SBA-3 catalysts, prepared with various vanadium precursor, was also estimated regarding an amount of propene transformed to propene oxide related to the number of vanadium species per second (expressed as turn over frequency – TOF) (Fig. 14B). Considering the UV-vis spectra and H2-TPR measurements it could be suggested that mainly small amount of tetrahedral V(V) species are present in the samples with low V loading, while in Vm2-SBA-3 and Vm3-SBA-3 both tetrahedral and pseudo-octahedral V(V) species located on the surface are present. Regarding the high value of the surface area (usually exceeding 1000 m2 g−1) and relatively low V loading the surface coverage with vanadium is in the range of 0.02 to 0.073 V/nm−2 (Table 1). Therefore, according to Wachs et al.47 we can assume that all these centers located on the surface form a monolayer coverage. Fig. 14B shows the variation of the TOF values for the tested catalysts. Although the catalysts with low vanadium content (<1 wt%) result in lower propene conversion and much lower STY of PO, the propene epoxidation expressed as TOF, which indicates activity of the particular active site, is much higher for the latter catalysts. It indicates that in the vanadium rich samples (>5 wt%) a significant amount of vanadium species (showing penta and octahedral coordination – from UV-vis spectra) is either less or completely inactive in generation of mild electrophilic oxygen species. The samples with high vanadium content indicate a high activity towards COx formation which suggests vanadium polymeric species action towards combustion reaction.
Conclusions
Silica SBA-3 molecular sieves with incorporated vanadium can be directly prepared in the acidic medium with VOSO4 or NH4VO3 as V precursors. The nature of precursor as well as pH of the synthesis mixture influence the properties of the resulting products including their catalytic activity. Using of VOSO4 allowed to introduce only small amount of vanadium regardless of the pH of the synthesis mixture, whereas in the presence of NH4VO3 and at higher pH value the high V content samples have been obtained. The combined use of UV-vis, H2-TPR, FTIR, and EPR techniques allowed to determine the nature and environment of vanadium. These results reveals successful incorporation of vanadium into SBA-3 structure in the case of low V loading (<1 wt%), whereas the formation of various forms of vanadium species was evidenced for the samples with V concentration >5 wt%. All the investigated samples show highly dispersed, isolated tetrahedrally coordinated VOx species including both monomeric VO4 vanadyl and oligomeric VOx species, regardless of vanadium content. The samples exhibit the presence of acid sites whose number corresponds to the V content. The sites (mostly weak Lewis type) show some activity in catalytic reactions requiring the presence of acidic sites.The catalytic activity tests in propene oxidation evidenced that vanadium modified SBA-3 materials show noticeable activity in the formation of epoxide. The activity is significantly affected by vanadium content attained by using relevant V precursor and respective pH of synthesis mixture. The highest propene oxide productivity was achieved over V-SBA-3 samples with high vanadium content (>5 wt%), obtained with NH4VO3. The V-SBA-3 catalysts with low vanadium content (<1 wt%) showed higher TOF values than vanadium rich series what suggests that some vanadium species do not show activity towards mild electrophilic oxygen species generation.
Conflicts of interest
There are no conflicts to declare.Acknowledgements
This work was supported by National Science Centre (grant no. 2016/23/B/ST5/00615).References
- R. Xu, W. Pang, J. Yu, Q. Huo and J. Chen, Chemistry of Zeolites and Related Porous Materials: Synthesis and Structure, J. Wiley & Sons (Asia) Pte LTD, Singapore, 2007 Search PubMed.
- V. Meynen, P. Cool and E. F. Vansant, Microporous Mesoporous Mater., 2009, 125, 170–223 CrossRef CAS.
- A. Corma, Chem. Rev., 1997, 97, 2373–2420 CrossRef CAS PubMed.
- R. M. Martín-Aranda and J. Čejka, Top. Catal., 2010, 53, 141–153 CrossRef.
- A. Taguchi and F. Schüth, Microporous Mesoporous Mater., 2005, 77, 1–45 CrossRef CAS.
- E. Janiszewska, Microporous Mesoporous Mater., 2014, 193, 77–84 CrossRef CAS.
- E. Janiszewska, M. Zieliński, M. Kot, E. Kowalewski and A. Śrębowata, ChemCatChem, 2018, 10, 4109–4118 CrossRef CAS.
- M. L. Pena, A. Dejoz, V. Formés, F. Rey, M. I. Vásquez and J. M. LópezNieto, Appl. Catal., A, 2001, 209, 155–164 CrossRef CAS.
- R. Zhou, Y. Cao, S. Yan, J. Deng, Y. Liao and B. Hong, Catal. Lett., 2001, 75, 107–112 CrossRef CAS.
- Y.-M. Liu, Y. Cao, N. Yi, W.-L. Feng, W.-L. Dai, S.-R. Yan, H.-Y. He and K.-N. Fan, J. Catal., 2004, 224, 417–428 CrossRef CAS.
- Y.-M. Liu, W.-L. Feng, T.-C. Li, H.-Y. He, W.-L. Dai, W. Huang, Y. Cao and K.-N. Fan, J. Catal., 2006, 239, 125–136 CrossRef CAS.
- S. A. Karakoulia, K. S. Triantafyllidis and A. A. Lemonidou, Microporous Mesoporous Mater., 2008, 110, 157–166 CrossRef CAS.
- L. D. Nguyen, S. Loridant, H. Launay, A. Pigamo, J. L. Dubois and J. M. M. Millet, J. Catal., 2006, 237, 38–48 CrossRef CAS.
- H. Berndt, A. Martin, A. Brückner, E. Schreier, D. Müller, H. Kosslick, G.-U. Wolf and B. Lücke, J. Catal., 2000, 191, 384–400 CrossRef CAS.
- M. Baltes, P. Van Der Voort, O. Collartand and E. F. Vansant, J. Porous Mater., 1998, 5, 317–324 CrossRef.
- M. Baltes, K. Cassiers, P. Van Der Voort, B. M. Weckhuysen, R. A. Schoonheydt and E. F. Vansant, J. Catal., 2001, 197, 160–171 CrossRef CAS.
- L. Zhao, Y. Dong, X. Zhan, Y. Cheng, Y. Zhu, F. Yuan and H. Fu, Catal. Lett., 2012, 142, 619–626 CrossRef CAS.
- M. Piumetti, B. Bonelli, M. Armandi, L. Gaberova, S. Casale, P. Massiani and E. Garrone, Microporous Mesoporous Mater., 2010, 133, 36–44 CrossRef CAS.
- F. Gao, Y. Zhang, H. Wan, Y. Kong, X. Wu, L. Dong, B. Li and Y. Chen, Microporous Mesoporous Mater., 2008, 110, 508–516 CrossRef CAS.
- M. Piumetti, B. Bonelli, P. Massiani, S. Dzwigaj, I. Rossetti, S. Casale, L. Gaberova, M. Armandi and E. Garrone, Catal. Today, 2012, 179, 140–148 CrossRef CAS.
- M. Piumetti, B. Bonelli, P. Massiani, Y. Millot, S. Dzwigaj, M. Armandi, L. Gaberova and E. Garrone, Microporous Mesoporous Mater., 2011, 142, 45–54 CrossRef CAS.
- R. Bulánek, P. Čičmanec, H. Sheng-Yang, P. Knotek, L. Čapek and M. Setnička, Appl. Catal., A, 2012, 415–416, 29–39 CrossRef.
- A. Held, J. Kowalska-Kuś and K. Nowińska, Catal. Commun., 2012, 17, 108–113 CrossRef CAS.
- Q. Huo, D. I. Margolese, U. Ciesla, D. G. Demuth, P. Feng, T. E. Gier, P. Sieger, A. Firouzi, B. F. Chmelka, F. Schüth and G. D. Stucky, Chem. Mater., 1994, 6, 1176–1191 CrossRef CAS.
- M. Symons, ESR spectroscopy in Chemistry and Biochemistry, PWN, Warsaw, 1987 Search PubMed.
- J. Lu, X. Zhang, J. J. Bravo-Suárez, K. K. Bando, T. Fujitani and S. T. Oyama, J. Catal., 2007, 250, 350–359 CrossRef CAS.
- M. Selvaraj and D. W. Park, Appl. Catal., A, 2010, 388, 22–30 CrossRef CAS.
- J. George, S. Shylesh and A. P. Singh, Appl. Catal., A, 2005, 290, 148–158 CrossRef CAS.
- F. Chen, S. Shen, X.-J. Xu, R. Xu and F. Kooli, Microporous Mesoporous Mater., 2005, 79, 85–91 CrossRef CAS.
- J. M. Campelo, D. Luna, R. Luque, J. M. Marinas, A. A. Romero, J. J. Calvino and M. P. Rodríguez-Luque, J. Catal., 2005, 230, 327–338 CrossRef CAS.
- L. Rivoira, M. L. Martínez, O. Anunziata and A. Beltramone, Microporous Mesoporous Mater., 2017, 254, 96–113 CrossRef CAS.
- C. M. Chanquía, A. L. Cánepa, E. L. Winkler, E. Rodríguez-Castellon, S. G. Casuscelli and G. A. Eimer, Mater. Chem. Phys., 2016, 175, 172–179 CrossRef.
- Y. Shiraishi, M. Morishita, Y. Teshima and T. Hirai, J. Phys. Chem. B, 2006, 110, 6587–6594 CrossRef CAS PubMed.
- C. M. Chanquía, A. L. Cánepa, K. Sapag, P. Reyes, E. R. Herrero, S. G. Casuscelli and G. A. Eimer, Top. Catal., 2011, 54, 160–169 CrossRef.
- R. Baran, Y. Millot, T. Onfroy, F. Averseng, J.-M. Krafft and S. Dzwigaj, Microporous Mesoporous Mater., 2012, 161, 179–186 CrossRef CAS.
- S. Shylesh and A. P. Singh, J. Catal., 2005, 233, 359–371 CrossRef CAS.
- M. Wark, A. Brückner, T. Liese and W. Grünert, J. Catal., 1998, 175, 48–61 CrossRef CAS.
- Ch. Subrahmanyam, B. Louis, B. Viswanathan, A. Renken and T. K. Varadarajan, Appl. Catal., A, 2005, 282, 67–71 CrossRef CAS.
- B. R. Jermy, S.-Y. Kim, K. V. Bineesh and D.-W. Park, Microporous Mesoporous Mater., 2009, 117, 661–669 CrossRef CAS.
- Y. Li, W. Zhang, L. Zhang, Q. Yang, Z. Wei, Z. Feng and C. Li, J. Phys. Chem. B, 2004, 108, 9739–9744 CrossRef CAS.
- T. Klimova, J. Reyes, O. Gutiérrez and L. Lizama, Appl. Catal., A, 2008, 335, 159–171 CrossRef CAS.
- G. Mul, A. Zwijnenburg, B. Linden, M. Makkee and A. Moulijn, J. Catal., 2001, 201, 128–137 CrossRef CAS.
- G. Busca, T. Zerlia, V. Lorenzello and A. Girelli, J. Catal., 1984, 88, 125–130 CrossRef CAS.
- A. Davydov, in Molecular Spectroscopy of Oxide Catalyst Surface, ed. N. T.Sherppad, John Wiley & Sons Ltd. England, 2003, vol. 321, p. 507 Search PubMed.
- A. Held and P. Florczak, Catal. Today, 2009, 142, 329–334 CrossRef CAS.
- K. Chen, A. T. Bell and E. Iglesia, J. Phys. Chem. B, 2000, 104, 1292–1299 CrossRef CAS.
- X. Gao and I. E. Wachs, J. Phys. Chem. B, 2000, 104, 1261–1268 CrossRef CAS.
Footnote |
| † Electronic supplementary information (ESI) available: XRD, UV-vis, ESR. See DOI: 10.1039/c8ra10171j |
| This journal is © The Royal Society of Chemistry 2019 |

