 Open Access Article
Enhanced catalytic activity over palladium supported on ZrO2@C with NaOH-assisted reduction for decomposition of formic acid†
Tong Wang,
Fang Li,
Hualiang An,
Wei Xue * and
Yanji Wang*
Hebei Provincial Key Lab of Green Chemical Technology and High Efficient Energy Saving, Tianjin Key Laboratory of Chemical Process Safety, School of Chemical Engineering and Technology, Hebei University of Technology, Tianjin 300130, China. E-mail: weixue@hebut.edu.cn; yjwang@hebut.edu.cn
First published on 24th January 2019
Abstract
A ZrO2@C support based on t-ZrO2 embedded in amorphous carbon was obtained via the pyrolysis of a UiO-66 precursor. Highly dispersed Pd nanoparticles (NPs) were subsequently deposited onto this support, using NaOH-assisted reduction, to obtain a formic acid (FA) decomposition catalyst. This material showed a turnover frequency (TOF) for the heterogeneously-catalyzed decomposition of FA of 8588 h−1 at 60 °C, with 100% H2 selectivity. This performance is ascribed to the uniform dispersion of smaller palladium nanoparticles and a synergistic effect between the metal NPs and support. Even at 30 °C, the complete decomposition of FA was achievable in FA/SF (SF, sodium formate) solution, with a TOF as high as 1857 h−1.
1. Introduction
As concerns regarding issues such as climate change and air pollution caused by the burning of fossil fuels continue to grow, it has become urgent to develop clean, efficient and sustainable energy sources. Hydrogen, an environmentally-friendly energy carrier that can be widely used in fuel cells, has been regarded as one of the most promising candidates for the replacement of fossil fuels.1 However, at present, the safe storage and efficient use of hydrogen is still a major impediment to the realization of a hydrogen economy. Formic acid (FA) is a major byproduct from biorefinery processing and has several beneficial characteristics, including being non-toxic, biodegradable, readily storable and transportable, and having a high hydrogen content of 4.4 wt%. Thus, this compound has becoming an economically appealing candidate for the chemical storage of hydrogen.2FA decomposition (FAD) typically proceeds via either decomposition or dehydration, the latter of which produces CO that is toxic to fuel cell catalysts, and so should be avoided. In recent years, heterogeneous catalysis has also been applied to the decomposition of FA. Supported metal catalysts based on Au,3 Rh4 and Pt5 and other precious metals have been widely studied, and Pd-based materials have shown superior catalytic activity together with relatively low costs. To improve FAD performance, some studies have introduced a second metal or used bimetallic or metal oxide components to improve the reaction activity as a result of a synergistic catalytic effect between polymetals.6–10 As an example, the introduction of the base metals Co and Ni, or of MnOx oxides, can improve the catalytic performance while reducing costs. In addition, different supports have been assessed, such as carbon materials,11–17 metal oxides,18 silica and molecular sieves,19–22 together with modifications to these supports to further improve catalytic performance for the support itself also plays an important role in optimizing the local geometry and electronic structure of the metal.
Recently, metal–organic framework materials (MOFs) have received increasing attention in the field of catalysis because they possess the advantages of ultra-high specific surface areas, adjustable pore diameters and structural diversity.23 There have been some reports regarding the application of catalysts prepared with MOFs as carriers in the liquid phase decomposition of FA.24–28 However, the catalytic performance during FAD is not ideal at present, and so further improvements are required. The use of MOFs as sacrificial templates for the preparation of nanocomposite materials by simple pyrolysis is an increasingly attractive catalyst preparation technique.29–31 Despite this, MOF-derived metal oxides and carbon complex supports have rarely been applied to FA decomposition.32–34
In terms of monometallic Pd catalysts, the size of the Pd NPs especially plays an important role in catalyst activity. For smaller metal NPs usually have a high surface-to-volume ratio and hence could able to provide a higher density of active sites exposed to reactants, which is significance for heterogeneous catalysis. In the present work, ZrO2@C support in which t-ZrO2 was embedded in amorphous carbon was obtained via pyrolysis Zr-MOF, UiO-66, under nitrogen. Subsequently, a highly dispersed Pd/ZrO2@C catalyst was prepared by NaOH-assisted reduction by NaBH4. The effects of NaOH addition and the interaction between support and Pd NPs on catalytic performance were also examined, based on characterization by X-ray diffraction (XRD), X-ray photoelectron spectroscopy (XPS), transmission electron microscopy (TEM) and energy-dispersive X-ray spectroscopy (EDS) mapping. Finally, the reaction conditions were optimized.
2. Experimental
2.1. Catalyst preparation
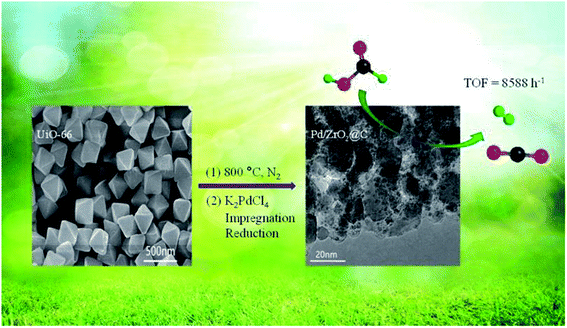
UiO-66 was prepared according to a previously reported procedure.35 In a typical synthesis, 1.2 mmol (280 mg) ZrCl4, 1.2 mmol (199 mg) terephthalic acid (H2BDC) and 4 mL glacial acetic acid were dissolved in 40 mL of DMF. The mixture was subjected to ultrasonication for complete dissolution and transferred into a 100 mL Teflon-lined stainless steel autoclave and then heated to 120 °C for 24 h. A white powder was collected by centrifugation, washed three times with DMF and ethanol. After that it was dried at 80 °C overnight, followed by calcination at 800 °C for 5 h at a heating rate of 5 °C min−1 in a nitrogen flow. The resulting black powder was denoted as ZrO2@C.The Pd/ZrO2@C catalyst was prepared via a wet impregnation method. An aqueous K2PdCl4 solution was prepared using a PdCl2 to KCl molar ratio of 1![[thin space (1/6-em)]](https://www.rsc.org/images/entities/char_2009.gif) :
:![[thin space (1/6-em)]](https://www.rsc.org/images/entities/char_2009.gif) 2. A 100 mg quantity of the pre-synthesized ZrO2@C support was dispersed in 5 mL of ultrapure water via ultrasonication for 5 min, after which the K2PdCl4 solution was added to the suspended support and the mixture was stirred for 12 h, followed by the addition of 1 mL of a NaOH solution. After reduction with an aqueous NaBH4 solution (0.038 g dissolved in 5 mL water) at room temperature and drying under vacuum at 60 °C, the Pd/ZrO2@C catalyst was obtained. For comparison, a catalyst was also prepared without NaOH, and is denoted herein as Pd/ZrO2@C–W (Scheme 1).
2. A 100 mg quantity of the pre-synthesized ZrO2@C support was dispersed in 5 mL of ultrapure water via ultrasonication for 5 min, after which the K2PdCl4 solution was added to the suspended support and the mixture was stirred for 12 h, followed by the addition of 1 mL of a NaOH solution. After reduction with an aqueous NaBH4 solution (0.038 g dissolved in 5 mL water) at room temperature and drying under vacuum at 60 °C, the Pd/ZrO2@C catalyst was obtained. For comparison, a catalyst was also prepared without NaOH, and is denoted herein as Pd/ZrO2@C–W (Scheme 1).
Pd/activated carbon (AC) and Pd/ZrO2 were prepared using the same method.
2.2. Catalyst characterization
Powder XRD was performed with a Bruker D8 Advance X-ray powder diffractometer, while thermogravimetric (TG) analysis was carried out using an SDT/Q600 thermogravimetric analyzer, with heating from 25 to 900 °C at a rate of 10 °C min−1 under air. High resolution TEM (HRTEM) and EDS mapping were carried out with an FEI Tecnai G2F20 instrument operating at 200 kV. XPS data were acquired using a Thermo Fisher ESCALAB 250Xi spectrometer. The surface area and total pore volume of the samples were measured at 77 K by nitrogen adsorption using a Micromeritics ASAP 2460 instrument.2.3. Catalytic test and calculation methods
The molar ratios of nMetal/nFA were fixed at 0.01. Typically, a mixture of a suitable amount of catalyst and distilled water (0.5 mL) was first added in a round-bottomed flask (25 mL), which was placed in an oil bath at a preset temperature (30–60 °C) under ambient atmosphere. A gas burette filled with water was connected to the reaction flask to measure the volume of released gas. Then 0.5 mL of a mixed aqueous solution containing 1.5 mmol FA and 4.5 mmol SF was injected into the flask using a syringe to initiate the reaction. The volume of the evolved gas was monitored by recording the displacement of water in the gas burette.Here FA conversion and general TOF values were calculated as the following equations:
 | (a) |
Here ngas is the mole of final generated gas (H2 + CO2), and nFA is the mole of charged FA reactant.
 | (b) |
 | (c) |
Here VInitial gas and VTotal gas are the volume of generated gas corresponding to conversions of 20% and 100% toward the conversion of FA, respectively; nMetal is the mole number of Pd of added catalyst; tInitial and tTotal are the reaction time corresponding to 20% and 100% conversion toward the decomposition of FA.
3. Results and discussion
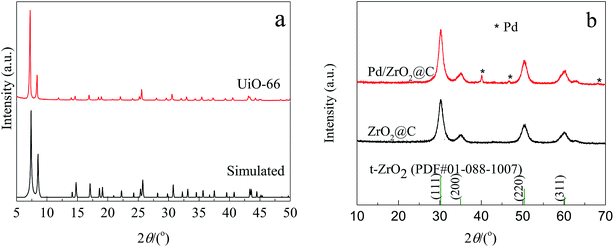
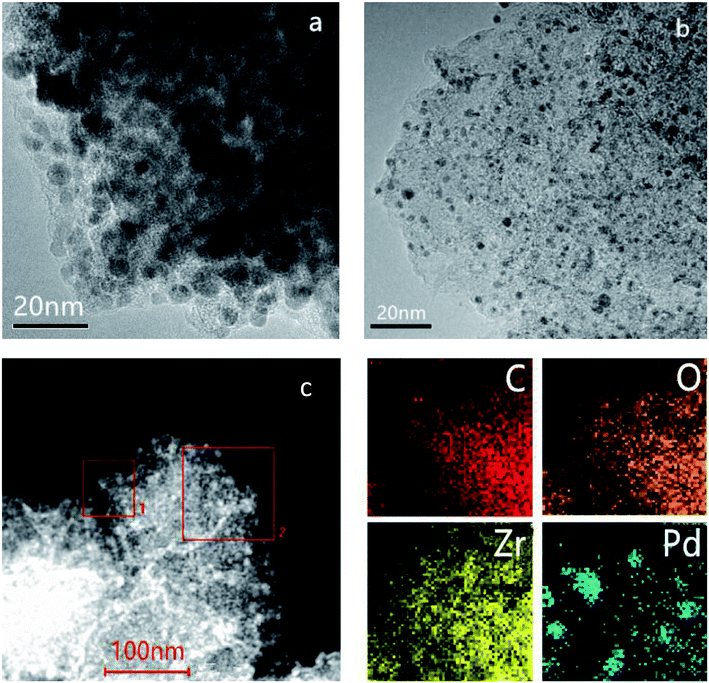
The experimental XRD pattern obtained from the synthesized UiO-66 along with a simulated pattern are shown in Fig. 1a, and there is good agreement between the two. After pyrolysis at 800 °C under a N2 atmosphere, new diffraction peaks appeared at 2θ values of 30.3°, 35.1°, 50.5° and 60.0° in the pattern generated by the resulting ZrO2@C (Fig. 1b). These respectively correspond to the (111), (200), (220) and (311) lattice planes of tetragonal ZrO2 (t-ZrO2). There is no diffraction peak for crystallized carbon, indicating the formation of amorphous carbon. And the TG analysis determined that the carbon content of the ZrO2@C material was 26 wt%. After impregnation and reduction, a strong diffraction peak appeared at 40.1° and weaker peaks are also evident at approximately 46.6° and 67.6°, corresponding to the (111), (200) and (220) planes of fcc Pd (JCPDS No. 05-0681).The morphologies of Pd NPs immobilized on ZrO2@C were investigated by TEM, and ultrafine Pd NPs (average particle size = 2.5 ± 0.3 nm and the size distribution shown in Fig. S1†) were found to be highly dispersed on the ZrO2@C surface (Fig. 2a). In addition, an elemental mapping analysis based on EDS (Fig. 2b) demonstrated homogeneous distributions of carbon, oxygen, zirconium and palladium over the catalyst, confirming the uniform dispersion of ZrO2 throughout the carbon matrix together with the presence of highly dispersed metallic Pd.
 | ||
| Fig. 2 TEM image of (a) Pd/ZrO2@C and (b) HAADF-STEM images and energy dispersive X-ray spectroscopy elemental mapping results of Pd/ZrO2@C (the region of square 1 was chosen for elemental maps). | ||
The XPS data acquired from the Pd/ZrO2@C is shown in Fig. 3a. The Pd 3d5/2 signal at a binding energy of 335.50 eV and the Pd 3d3/2 signal at 340.97 eV are attributed to the presence of metallic Pd, while evidence for the presence of Pd2+ ions is provided by the Pd 3d5/2 and Pd 3d3/2 signals at 336.14 and 341.97 eV, respectively. The peaks at approximately 333.3 and 347.0 eV are ascribed to Zr 3p3/2 and Zr 3p1/2 respectively, indicating that ZrO2 was also situated on surface of the material.36 Deconvolution of the XPS spectrum shows that Pd0 was the major species in Pd/ZrO2@C catalyst (shown in Table 1).
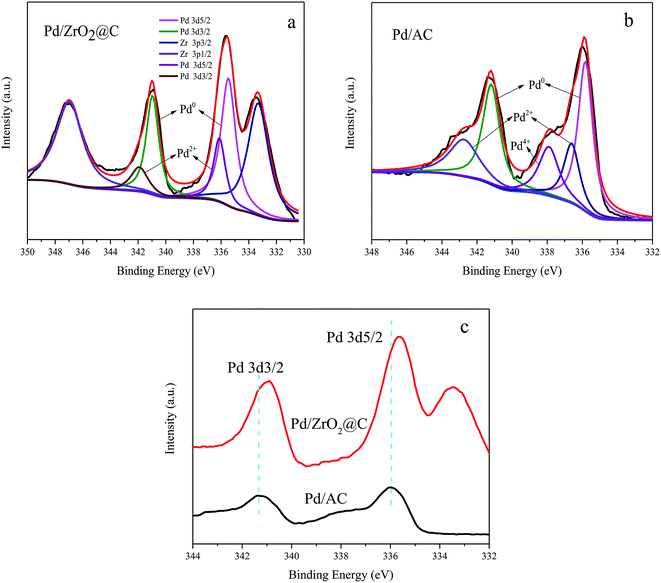 | ||
| Fig. 3 XPS spectra of (a) Pd/ZrO2@C, (b) Pd/AC and (c) comparison of the XPS spectra of Pd 3d for Pd/AC and Pd/ZrO2@C. | ||
| Catalyst | Fraction of Pd speciesa (%) | Support surface area (m2 g−1) | Pore volume (cm3 g−1) | TOF (h−1) | ||
|---|---|---|---|---|---|---|
| Pd4+ | Pd2+ | Pd0 | ||||
a Surface Pd components based on XPS deconvolution.b TOF values of H2 generation for the decomposition of FA/SF (1![[thin space (1/6-em)]](https://www.rsc.org/images/entities/char_2009.gif) : :![[thin space (1/6-em)]](https://www.rsc.org/images/entities/char_2009.gif) 3) catalyzed by Pd/ZrO2@C, Pd/AC and Pd/ZrO2 (nPd/nFA = 0.01, 50 °C).c Initial TOF. 3) catalyzed by Pd/ZrO2@C, Pd/AC and Pd/ZrO2 (nPd/nFA = 0.01, 50 °C).c Initial TOF. |
||||||
| Pd/ZrO2@C | 0 | 27.6 | 72.4 | 241.1 | 0.067 | 4978 b, 9815 c |
| Pd/AC | 14.1 | 29.3 | 56.6 | 938.1 | 0.381 | 3064 b, 5726 c |
| Pd/UiO-66 | — | — | — | 869.1 | 0.066 | 2987 c |
| Pd/ZrO2 | — | — | — | 13.7 | 0.039 | 242 c |
The effect of NaOH during the preparation of Pd/ZrO2@C catalyst was studied. TEM characterization demonstrated that the Pd NPs were significantly larger (6.0 ± 0.5 nm) in Pd/ZrO2@C–W catalyst without NaOH addition (Fig. 4a). In addition, EDS mapping showed higher local densities and uneven dispersion of the Pd NPs, indicating partial agglomeration (Fig. 4c). According to the literature,35 the K2PdCl4 precursor will be present in aqueous solution in the form of hydrated ions: [PdCl3(H2O)]−. However, the addition of NaOH results in a rapid ligand exchange to produce [PdCl3(OH)]2− and [PdCl2(OH)2]2−. This process affects the nucleation rate of Pd NPs so as to inhibit rapid growth. In addition, these new species formed through ligand exchange may undergo electronic interactions with the support,15 further reducing the Pd NPs size. These smaller NPs will, in turn, increase the catalytic activity.
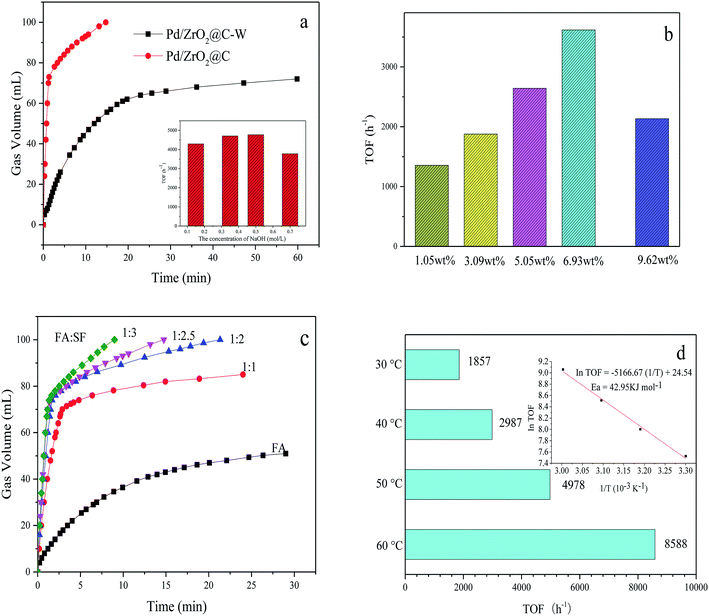
Fig. 5a shows the difference between the activities of Pd/ZrO2@C and Pd/ZrO2@C–W for FA decomposition. It can be concluded that high Pd NPs dispersion, resulted from the addition of NaOH, showed positive effect for FAD over Pd/ZrO2@C catalysts. Furthermore, Pd/ZrO2@C samples were prepared while adding varying concentrations of NaOH solution to the 5 mL precursor solution (K2PdCl4, 0.07 mmol). The evaluation results showed that the Pd/ZrO2@C prepared with 1 mL of 0.5 mol L−1 NaOH exhibited the best catalytic performance for FAD.
For comparison purposes, a catalyst comprising Pd NPs supported on AC was also synthesized. Surprisingly, despite the Pd particles being of a similar size to those in the Pd/ZrO2@C (Fig. 4b and the corresponding size distribution of Pd NPs shown in Fig. S1†), the catalytic activity of the Pd NPs grown on AC was lower than that of those on ZrO2@C during the FAD reaction (Table 1). This result suggests that the ZrO2 was possibly responsible for the drastic enhancement in the catalytic activity of the latter material. To confirm this possibility, an XPS analysis of the Pd/AC was performed (Fig. 3b), and deconvolution of the resulting spectrum demonstrated the proportions shown in Table 1. This result is consistent with a prior study37 in which Li reported approximately 14% Pd4+ on a Pd/C sample containing 2.6 nm Pd NPs. According to the literature, the fraction of oxidized Pd species increases significantly with decreases in the Pd particle size, likely due to the particle size effect and interactions between Pd and the carbon support.38 In contrast, although the present work with relatively small NPs, the Pd/ZrO2@C still exhibited a low fraction of oxidized Pd species. However, it can be seen that the Pd 3d binding energies for the Pd/ZrO2@C were negatively shifted as compared with those for the Pd/AC (Fig. 3c). It appears that the presence of ZrO2 modified the electronic structure of the Pd NPs to generate a more electron-rich surface.28 The more electron-rich Pd NPs would be expected to promote the dissociation of the O–H bonds of FA molecules and therefore favor the formation of Pd-formate intermediates during the initial step of the decomposition reaction. This effect, in turn, would improve the catalytic performance. To further determine the effect of the choice of the underlying support on the catalytic performance, we also evaluated Pd NPs supported on ZrO2, obtained via the thermal decomposition of ZrO2@C in air at 550 °C. This material showed significantly lower activity under the same conditions (Table 1). The data confirm that calcination of the ZrO2@C in air greatly decreased the Brunauer–Emmett–Teller surface area to the lowest value among the various supports used in this work. This loss of surface area may account for the lowest activity for poor dispersion of Pd NPs. In order to further confirm the advantage of ZrO2@C, Pd/UiO-66 was also prepared and evaluated (Fig. S2†). The initial turnover frequency is 2987 h−1, which is higher than Pd/ZrO2, but is still lower than Pd/ZrO2@C. Based on the above results, it appears that ZrO2@C having a suitable specific surface area is capable of acting as a support by undergoing specific interactions with Pd NPs. This may be the key factor in terms of facilitating the decomposition of FA.
Subsequently, the effect of Pd loading on the catalytic activity was investigated by testing various Pd loadings of the Pd/ZrO2@C (Fig. 5b). As Pd loading was increased from 1.05 wt% to 6.93 wt%, the TOF was greatly enhanced, although the catalytic performance decreased with further increases in the active metal content. Therefore, the optimal Pd loading value was 6.93 wt%.
The effect of the FA to SF molar ratio on the hydrogen generation efficiency was investigated by employing ratios of 1![[thin space (1/6-em)]](https://www.rsc.org/images/entities/char_2009.gif) :
:![[thin space (1/6-em)]](https://www.rsc.org/images/entities/char_2009.gif) 1, 1
1, 1![[thin space (1/6-em)]](https://www.rsc.org/images/entities/char_2009.gif) :
:![[thin space (1/6-em)]](https://www.rsc.org/images/entities/char_2009.gif) 2, 1
2, 1![[thin space (1/6-em)]](https://www.rsc.org/images/entities/char_2009.gif) :
:![[thin space (1/6-em)]](https://www.rsc.org/images/entities/char_2009.gif) 2.5 and 1
2.5 and 1![[thin space (1/6-em)]](https://www.rsc.org/images/entities/char_2009.gif) :
:![[thin space (1/6-em)]](https://www.rsc.org/images/entities/char_2009.gif) 3. The results (Fig. 5c) demonstrate that a 1
3. The results (Fig. 5c) demonstrate that a 1![[thin space (1/6-em)]](https://www.rsc.org/images/entities/char_2009.gif) :
:![[thin space (1/6-em)]](https://www.rsc.org/images/entities/char_2009.gif) 3 ratio gave the highest hydrogen generation efficiency. Typically, gas generation from pure FA was very slow and the conversion reached a maximum of only 80% (the final volume of gas produced is about 55 mL, while the theoretical yield of total decomposition of 1.5 mmol FA is 67.2 mL) and in pure SF solution, there was almost no gas generated from pure SF solution within 1.2 minutes which further confirms the volume of gas mainly comes from the contribution of formic acid and the important role of SF as a promoter (Fig. S3†). It was believed that HCOO− is an important active intermediate species in the decomposition process of formic acid, adding basic formate additive is believed can increase the concentration of HCOO− and contact chance of formate ions with metal catalytic sites and significantly accelerate the kinetics of FA decomposition. At present, the consensus is that FA decomposition proceeds via the dissociation of FA to form H+ and HCOO−. The H+ ions are adsorbed on the catalyst surface, following which the protonated catalyst accepts the HCOO− ions to form HCOO−-cat species. The protonated catalyst then promotes hydride elimination from the HCOO−-cat followed by C–H bond cleavage, generating H2 and CO2.39 The presence of electron-rich Pd NP surfaces could promote the dissociation of the FA molecule to form a Pd-formate intermediate during the initial step of the decomposition reaction. This mechanism explains why the addition of SF increases catalytic activity in the presence of alkaline reactants, because the FA is more likely to dissociate and therefore to protonate the catalyst.
3 ratio gave the highest hydrogen generation efficiency. Typically, gas generation from pure FA was very slow and the conversion reached a maximum of only 80% (the final volume of gas produced is about 55 mL, while the theoretical yield of total decomposition of 1.5 mmol FA is 67.2 mL) and in pure SF solution, there was almost no gas generated from pure SF solution within 1.2 minutes which further confirms the volume of gas mainly comes from the contribution of formic acid and the important role of SF as a promoter (Fig. S3†). It was believed that HCOO− is an important active intermediate species in the decomposition process of formic acid, adding basic formate additive is believed can increase the concentration of HCOO− and contact chance of formate ions with metal catalytic sites and significantly accelerate the kinetics of FA decomposition. At present, the consensus is that FA decomposition proceeds via the dissociation of FA to form H+ and HCOO−. The H+ ions are adsorbed on the catalyst surface, following which the protonated catalyst accepts the HCOO− ions to form HCOO−-cat species. The protonated catalyst then promotes hydride elimination from the HCOO−-cat followed by C–H bond cleavage, generating H2 and CO2.39 The presence of electron-rich Pd NP surfaces could promote the dissociation of the FA molecule to form a Pd-formate intermediate during the initial step of the decomposition reaction. This mechanism explains why the addition of SF increases catalytic activity in the presence of alkaline reactants, because the FA is more likely to dissociate and therefore to protonate the catalyst.
The hydrogen evolution kinetics over Pd/ZrO2@C was greatly accelerated by elevating the reaction temperature (Fig. 5d). At 60 °C, the reaction was complete after just 69 s (nPd/nFA = 0.01), providing a high TOF of 8588 h−1. Thus, the as-prepared Pd/ZrO2@C exhibited significant catalytic activity, with TOF values higher than those reported for most heterogeneous catalysts for this reaction (Table 2), except the two catalysts from the latest reports.33,34 The apparent activation energy (Ea) of this process was estimated to be 42.95 kJ mol−1. Finally, the recycling stability of the Pd/ZrO2@C is tested (Fig. S4†). The catalyst was recovered using centrifugation and washed with water and ethanol, and then reused under the same conditions. But it is a great pity that there is a significant decrease in catalytic activity in the process of reuse. We subsequently tested the sample that once-used by TEM, as shown in Fig. S5.† There is a slight aggregation of the catalyst which may account for the decrease of catalytic activity.
| Catalysts | Additive | T (°C) | TOF (h−1) | Ref. |
|---|---|---|---|---|
| a TOF is the total turnover frequency when the conversion reaches 100%.b TOF is the initial turnover frequency when the conversion reaches 20%.c TOF = mol H2/mol catalyst × time (h).d The TOF value is measured during the first 10 min.e TOF is calculated during the first 5 min of the reaction.f TOF value is measured during the first 20 min. | ||||
| Pd/ZrO2@C | SF | 60 | 8588a | This work |
| Pd/ZrO2@C | SF | 50 | 4978a | This work |
| Pd/AC | SF | 50 | 3064a | This work |
| Pd-MnOx/SiO2–NH2 | None | 50 | 1300b | 10 |
| Pd/N-MSC-30 | SF | 60 | 8414a | 11 |
| (Co6)Ag0.1Pd0.9/rGO | SF | 50 | 2739a | 12 |
| Ni0.4Pd0.6/NH2–N-rGO | None | 25 | 954.3b | 13 |
| Ag3Pd12/MOF-5-C-900 | SF | 50 | 1774b | 14 |
| Pd/MSC-30 | SF | 50 | 2623a | 15 |
| Au1Pd2/GO | SF | 25 | 954.2b | 16 |
| Au0.75Pd0.25/C-L-7.5 | SF | 50 | 2972a | 17 |
| Au/ZrO2 | NEt3 | 50 | 1593f | 18 |
| Pd/S-1-in-K | SF | 50 | 3027a | 19 |
| PdAu-MnOx/N–SiO2 | None | 25 | 785c | 22 |
| AuPd@ED-MIL-101 | SF | 90 | 106d | 24 |
| Ag18Pd82@ZIF-8 | SF | 80 | 580e | 26 |
| Au0.28Pd0.47Co0.25/MIL-101–NH2 | SF | 25 | 347a | 28 |
| PdAg@ZrO2/C | PF (potassium formate) | 50 | 9206a | 33 |
| Pd@CN900K | SF | 60 | 14![[thin space (1/6-em)]](https://www.rsc.org/images/entities/char_2009.gif) 400 a 400 a |
34 |
4. Conclusions
Pd/ZrO2@C was prepared via NaOH-assisted reduction employing UiO-66-derived ZrO2@C as the support. Adding NaOH regulates the microenvironment prior to reduction to adjust the Pd NP nucleation rate and growth process, leading to smaller particle sizes and greater dispersion. The presence of ZrO2 modifies the electronic structure of the Pd NPs via electron transfer, resulting in a more electron-rich Pd surfaces that promote the formic acid decomposition reaction. Thus, the combination of distinct interactions between the metal and support and the high dispersion of the NPs drastically enhances the performance of the catalyst. This technique may assist in developing viable systems in which FA acts as a chemical hydrogen storage material.Conflicts of interest
There are no conflicts to declare.Acknowledgements
This work was financially supported by the National Natural Science Foundation of China (Grant No. 21236001 and 21776057) and Natural Science Foundation of Tianjin (17JCYBJC20100).References
- L. Schlapbach and A. Züttel, Nature, 2002, 414, 353–358 CrossRef PubMed.
- B. Loges, A. Boddien, F. Gärtner, H. Junge and M. Beller, Top. Catal., 2010, 53, 902–914 CrossRef.
- Q. G. Liu, X. F. Yang, Y. Q. Huang, S. T. Xu, X. Su, X. L. Pan, J. M. Xu, A. Q. Wang, C. H. Liang, X. K. Wang and T. Zhang, Energy Environ. Sci., 2015, 8, 3204–3207 RSC.
- J. K. Sun, W. W. Zhan, T. Akita and Q. Xu, J. Am. Chem. Soc., 2015, 137, 7063–7066 CrossRef PubMed.
- F. Solymosi, Á. Koós, N. Liliom and I. Ugrai, J. Catal., 2011, 279, 213–219 CrossRef CAS.
- A. Bulut, M. Yurderi, Y. Karatas, Z. Say, H. Kivrak, M. Kaya, M. Gulcan, E. Ozensoy and M. Zahmakiran, ACS Catal., 2015, 5, 6099–6110 CrossRef CAS.
- Y. Q. Jiang, X. L. Fan, X. Z. Xiao, X. Huang, M. J. Liu, S. Q. Li, H. W. Ge and L. X. Chen, Int. J. Hydrogen Energy, 2017, 42, 9353–9360 CrossRef CAS.
- Z. L. Wang, Y. Ping, J. M. Yan, H. L. Wang and Q. Jiang, Int. J. Hydrogen Energy, 2014, 39, 4850–4856 CrossRef CAS.
- Z. L. Wang, J. M. Yan, Y. Ping, H. L. Wang, W. T. Zheng and Q. Jiang, Angew. Chem., Int. Ed., 2013, 52, 4406–4409 CrossRef CAS PubMed.
- A. Bulut, M. Yurderi, Y. Karatas, M. Zahmakiran, H. Kivrak, M. Gulcan and M. Kaya, Appl. Catal., B, 2015, 164, 324–333 CrossRef CAS.
- Z. P. Li, X. C. Yang, N. Tsumori, Z. Liu, Y. Himeda, T. Autrey and Q. Xu, ACS Catal., 2017, 7, 2720–2724 CrossRef CAS.
- Y. Chen, Q. L. Zhu, N. Tsumori and Q. Xu, J. Am. Chem. Soc., 2015, 137, 106–109 CrossRef CAS PubMed.
- J. M. Yan, S. J. Li, S. S. Yi, B. R. Wulan, W. T. Zheng and Q. Jiang, Adv. Mater., 2018, 30, 1703038 CrossRef PubMed.
- C. Feng, Y. N. Wang, S. T. Gao, N. Z. Shang and C. Wang, Catal. Commun., 2016, 78, 17–21 CrossRef CAS.
- Q. L. Zhu, N. Tsumori and Q. Xu, Chem. Sci., 2014, 5, 195–199 RSC.
- P. L. Liu, X. J. Gu, H. Zhang, J. Cheng, J. Song and H. Q. Su, Appl. Catal., B, 2017, 204, 497–504 CrossRef CAS.
- J. Cheng, X. J. Gu, X. L. Sheng, P. L. Liu and H. Q. Su, J. Mater. Chem. A, 2016, 4, 1887–1894 RSC.
- Q. Y. Bi, X. L. Du, Y. M. Liu, Y. Cao, H. Y. He and K. N. Fan, J. Am. Chem. Soc., 2012, 134, 8926–8933 CrossRef CAS PubMed.
- N. Wang, Q. M. Sun, R. S. Bai, X. Li, G. Q. Guo and J. H. Yu, J. Am. Chem. Soc., 2016, 138, 7484–7487 CrossRef PubMed.
- M. H. Jin, J. H. Park, D. Oh, S. W. Lee, J. S. Park, K. Y. Lee and D. W. Lee, Int. J. Hydrogen Energy, 2018, 43, 1451–1458 CrossRef CAS.
- Z. Z. Wang, X. F. Hao, D. W. Hu, L. Li, X. J. Song, W. X. Zhang and M. J. Jia, Catal. Sci. Technol., 2017, 7, 2213–2220 RSC.
- Y. Karatas, A. Bulut, M. Yurderi, I. E. Ertas, O. Alal, M. Gulcan, M. Celebi, H. Kivrak, M. Kaya and M. Zahmakiran, Appl. Catal., B, 2016, 180, 586–595 CrossRef CAS.
- H. C. Zhou and S. Kitagawa, Chem. Soc. Rev., 2014, 43, 5415–5418 RSC.
- X. J. Gu, Z. H. Lu, H. L. Jiang, T. Akita and Q. Xu, J. Am. Chem. Soc., 2011, 133, 11822–11825 CrossRef CAS.
- F. Ke, L. H. Wang and J. F. Zhu, Nanoscale, 2015, 7, 8321–8325 RSC.
- H. M. Dai, B. Q. Xia, L. Wen, C. Du, J. Su, W. Luo and G. Z. Cheng, Appl. Catal., B, 2015, 165, 57–62 CrossRef CAS.
- J. Cheng, X. J. Gu, P. L. Liu, H. Zhao, L. L. Ma and H. Q. Su, Appl. Catal., B, 2017, 218, 460–469 CrossRef CAS.
- J. Cheng, X. J. Gu, P. L. Liu, T. S. Wang and H. Q. Su, J. Mater. Chem. A, 2016, 4, 16645–16652 RSC.
- T. Wang, Q. Y. Zhou, X. J. Wang, J. Zheng and X. G. Li, J. Mater. Chem. A, 2015, 3, 16435–16439 RSC.
- Y. P. Su, C. Chen, X. G. Zhu, Y. Zhang, W. B. Gong, H. M. Zhang, H. J. Zhao and G. Z. Wang, Dalton Trans., 2017, 46, 6358–6365 RSC.
- X. Chen, S. C. Cai, J. Chen, W. J. Xu, H. P. Jia and J. Chen, Chem. Eng. J., 2018, 334, 768–779 CrossRef CAS.
- F. Z. Song, Q. L. Zhu, X. C. Yang, W. W. Zhan, P. Pachfule, N. Tsumori and Q. Xu, Adv. Energy Mater., 2017, 1701416 Search PubMed.
- C. Feng, S. T. Gao, N. Z. Shang, X. Zhou and C. Wang, Energy Technol., 2018, 6, 2120–2125 CrossRef CAS.
- Q. Wang, N. Tsumori, M. Kitta and Q. Xu, ACS Catal., 2018, 8, 12041–12045 CrossRef CAS.
- W. X. Cao, W. H. Luo, H. G. Ge, Y. Su, A. Q. Wang and T. Zhang, Green Chem., 2017, 19, 2201–2211 RSC.
- S. S. Cheng, N. Z. Shang, X. Zhou, C. Feng, S. T. Gao, C. Wang and Z. Wang, New J. Chem., 2017, 41, 9857–9865 RSC.
- J. J. Li, W. Chen, H. Zhao, X. S. Zheng, L. H. Wu, H. B. Pan, J. F. Zhu, Y. X. Chen and J. L. Lu, J. Catal., 2017, 352, 371–381 CrossRef CAS.
- X. Zhou, Y. Huang, W. Xing, C. Liu, J. Liao and T. Lu, Chem. Commun., 2008, 30, 3540–3542 RSC.
- K. Koh, J. E. Seo, J. H. Lee, A. Goswami, C. W. Yoon and T. Asefa, J. Mater. Chem. A, 2014, 2, 20444–20449 RSC.
Footnote |
| † Electronic supplementary information (ESI) available. See DOI: 10.1039/c8ra10198a |
| This journal is © The Royal Society of Chemistry 2019 |

