 Open Access Article
Electrical and electrochemical properties of Li2M(WO4)2 (M = Ni, Co and Cu) compounds
Karim Karoui *a,
Abdelfattah Mahmoudb,
Abdallah Ben Rhaiema and
Frèdéric Boschinib
aLaboratory of Condensed Matter, Faculty of Science of Sfax, University of Sfax, BP1171 – 3000 Sfax, Tunisia. E-mail: karouikarim36@yahoo.com
bGREENMAT, CESAM Research Unit, University of Liege, Chemistry Institute B6, Quartier Agora, Allée du 6 août, 13, B-4000 Liege, Belgium
First published on 27th February 2019
Abstract
Li2M(WO4)2 (M = Co, Cu or Ni) materials have been synthesized using the solid-state reaction method. X-ray diffraction measurements confirmed the single phase of the synthesized compounds in the triclinic crystal system (space group P![[1 with combining macron]](https://www.rsc.org/images/entities/char_0031_0304.gif) ). The SEM analyses revealed nearly spherical morphology with the particle size in the range of 1–10 μm. The IR spectra confirm the presence of all modes of WO42−. The impedance spectroscopy measurements showed the presence of grain boundaries and allow determination of the conductivity of the synthesized materials at room temperature. As positive electrode materials for lithium ion batteries, Li2M(WO4)2 (M = Co, Cu or Ni) cathode materials deliver initial discharge capacities of 31, 33 and 30 mA h g−1 for cobalt, nickel, and copper, respectively.
). The SEM analyses revealed nearly spherical morphology with the particle size in the range of 1–10 μm. The IR spectra confirm the presence of all modes of WO42−. The impedance spectroscopy measurements showed the presence of grain boundaries and allow determination of the conductivity of the synthesized materials at room temperature. As positive electrode materials for lithium ion batteries, Li2M(WO4)2 (M = Co, Cu or Ni) cathode materials deliver initial discharge capacities of 31, 33 and 30 mA h g−1 for cobalt, nickel, and copper, respectively.
1. Introduction
In recent years, tungsten (W) based electrode materials such as oxides, nitrides, and oxysalts have been proven to be feasible for electrochemical energy storage, thanks to their high specific capacity, good working voltage, abundant reserves, and environmental friendliness. In addition, metal tungstate as an independent entity, such as FeWO4, MnWO4 and ZnWO4, reveals excellent electrochemical performance on account of the synergistic effect of different metal elements.1–5 Among them, cobalt tungstate (CoWO4) and nickel tungstate (NiWO4) have been researched as promising replacements for catalysis.6Double tungstates materials have been considered to be attractive materials basically thanks to their interesting luminescence properties and possible application in the field of solid-state lasers.7–9 These materials have a general formula A2M(WO4)2 where A is a monovalent cation and M (Ni, Co and Cu…) is a divalent metal. Two different coordination have been found for tungsten: (i) tetrahedral for the scheelite-like double tungstates as in NaLa(WO4)2 (ref. 10) or (ii) octahedral for those adopting the wolframite type of structure as in LiFe(WO4)2.11 Nevertheless, a few double tungstates have been structurally investigated and not much has been study about their chemical and physical properties. The wolframite type structure is very common among MWO4 compounds (where M is a transition metal), and it can be described as made up of hexagonal close-packed oxygens with certain octahedral sites filled by M2+ and W6+ cations in an ordered way.12 As though the available information about this type of tungstates remains scarce, we explored the existence of new lithium metal(II) double tungstates and to investigate the electrical and electrochemical properties for which the previously published information was incomplete. The aim of this work is, to investigate and study the electrical and electrochemical properties of Li2M(WO4)2 (M = Ni, Co and Cu) compounds at room temperature. We report here for the first time the electrochemical tests of Li2M(WO4)2 as positive electrode material for Li-ion batteries and we investigate the electrical and SEM properties at room temperature to combine the electrochemical properties and conductivity measurements with morphological properties.
2. Experimental
In a typical procedure, polycrystalline Li2M(WO4)2 (M = Ni, Co and Cu) powder sample was prepared using mixtures of stoichiometric amounts of high purity (Sigma Aldrich) (≥99%) NiO, ZnO, CuO, Li2CO3, and WO3 via conventional solid state reaction method.Stoichiometric amounts of the starting reagents were mixed and intimately ground in an agate mortar. An excess of lithium was used during these preparations to compensate for the evaporation of the latter at high temperature. Initially the samples were fired at 550 °C under air for 60 hours to allow decarbonation and then between 650 and 700 °C for 160 hours as summarized in Table 1. After heat treatment, samples have been grounded and then reheated to ensure homogeneity. The colors of these synthesized samples, which depend on the used metal, are in good agreement with the reported colors in the literatures as indicated in Table 1.
| Sample | Synthesis | Color |
|---|---|---|
| Li2Ni(WO4)2 | 550 °C/60 h, 700 °C/160 h | Yellow |
| Li2Cu(WO4)2 | 550 °C/60 h, 700 °C/160 h | Green-yellow |
| Li2Co(WO4)2 | 550 °C/60 h, 650 °C/146 h | Purple |
The phase purity has been examined and confirmed using powder diffraction. Powder X-ray diffraction (XRD) data were collected with a Bruker D8 ECO powder diffractometer using Cu Kα radiation (λ = 1.5418 Å), operating from 2θ = 15 to 80°. The crystal structure was refined by the Rietveld method, starting from the observed powder diffraction pattern and using Fullprof software. The morphology and particle size were studied with a scanning electron microscope (XL 30 FEGESEM, FEI) with an accelerating voltage of 15 kV under high vacuum. Samples were deposited on carbon tapes. Sputtering deposition was done with gold target under argon atmosphere (Balzers, SCD004, Sputter coater).
To determine the particle size distribution, at least 10 micrographs were taken for each LTO-sample in different regions of the holder, and about 100 particles were analyzed using the commercial software IMAGEJ.13
The IR measurements were performed using a Perkin Elmer 1600FT spectrometer. Samples were dispersed with spectroscopic KBr and pressed into a pellet. Scans were run over the range 400–4000 cm−1 at room temperature.
The ATG analyze was carried out using a thermogravimetric balance TGA-50 Shimadzu in the temperature range from 30 to 600 °C under O2 atmosphere with a heating rate of 10 °C min−1.
The real (Z′) and imaginary (Z′′) parts of electrical impedance data were measured by means of Solartron1260A Impedance Analyzer coupled with a 1296A Dielectric Interface in the 1–106 Hz frequency range at room temperature. This measurement is realised on pellet disks of about 8 mm in diameter and 1.2 mm in thickness.
The working electrodes were prepared by dispersing 60 wt% active material (complex), 20 wt% conductive carbon, and 20 wt% binders (polyvinylidene fluoride) in 1-methyl-2-pyrrolidinone (NMP) to stir into homogeneous slurry during 2 hours. The slurry was coated on aluminum foil, dried at 110 °C in a vacuum oven for 8 h. The active material loading of electrodes was in the range of 1–2 mg cm−2. The electrochemical properties were studied using coin cells (2032, R-type), which were assembled in the Ar-filled glove box. Lithium metal (Aldrich) was used as counter and reference electrode, 1 M LiPF6 in ethylene carbonate and dimethylcarbonate (1/1, v/v) as electrolyte solution and celgard as separator.
The cyclic voltammetry (CV) analysis was performed in the range of 1.5–4.5 V at 0.1 mV s−1. The galvanostatic charge/discharge curves were measured using a multichannel Biologic potentiostat (VMP3) in the voltage range 1.5–4.5 V vs. Li+/Li0 at C/20 rate.
3. Result and discussions
3.1. X-ray powder
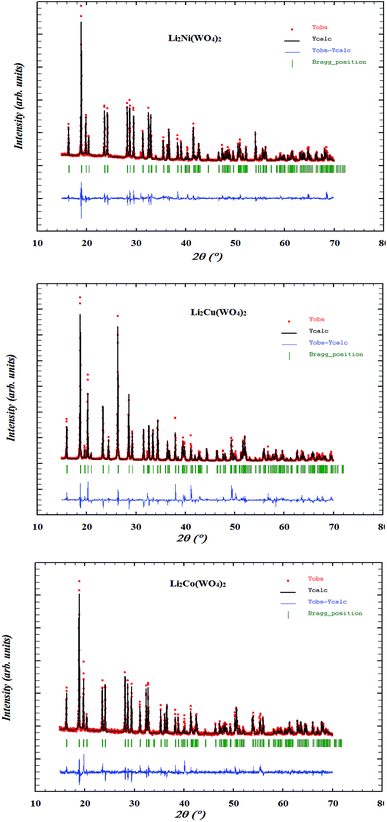
X-ray diffraction patterns, depicted in Fig. 1, corresponding to Li2M(WO4)2 for cobalt, nickel, and copper, respectively, show that the samples are single phase. Indeed, all the peaks can be indexed in the unique triclinic unit cell and the P![[1 with combining macron]](https://www.rsc.org/images/entities/char_0031_0304.gif) space group. The crystal structures of Li2M(WO4) (M = Ni, Co and Cu) materials were refined using Rietveld method. The obtained results of the Rietveld refinement are summarized in Table 2. The obtained results are in good agreement with the data reported in the literature.14 The XRD patterns of Li2Co(WO4)2 and Li2Ni(WO4)2 are very similar, suggesting that the two compounds are isostructural. It is worth pointing out that the main difference between the structures of Li2M(WO4)2 (M = Co or Ni) and Li2Cu(WO4)2 is the relative positions of the atoms and the symmetry elements. This seems to be due, most likely, to the strong Jahn–Teller effect found in the CuO6 octahedra in which an important elongation is produced.14
space group. The crystal structures of Li2M(WO4) (M = Ni, Co and Cu) materials were refined using Rietveld method. The obtained results of the Rietveld refinement are summarized in Table 2. The obtained results are in good agreement with the data reported in the literature.14 The XRD patterns of Li2Co(WO4)2 and Li2Ni(WO4)2 are very similar, suggesting that the two compounds are isostructural. It is worth pointing out that the main difference between the structures of Li2M(WO4)2 (M = Co or Ni) and Li2Cu(WO4)2 is the relative positions of the atoms and the symmetry elements. This seems to be due, most likely, to the strong Jahn–Teller effect found in the CuO6 octahedra in which an important elongation is produced.14
| Sample | System/space group | Parameter |
|---|---|---|
| Li2Ni(WO4)2 | Triclinic/P![[1 with combining macron]](https://www.rsc.org/images/entities/char_0031_0304.gif) |
a = 4.903/b = 5.597/c = 5.836 |
| α = 70.881/β = 88.548/γ = 115.436 | ||
| Li2Cu(WO4)2 | Triclinic/P![[1 with combining macron]](https://www.rsc.org/images/entities/char_0031_0304.gif) |
a = 4.962/b = 5.492/c = 5.884 |
| α = 70.741/β = 85.995/γ = 66.041 | ||
| Li2Co(WO4)2 | Triclinic/P![[1 with combining macron]](https://www.rsc.org/images/entities/char_0031_0304.gif) |
a = 4.916/b = 5.660/c = 5.875 |
| α = 69.491/β = 91.450/γ = 116.153 |
3.2. Particle morphology
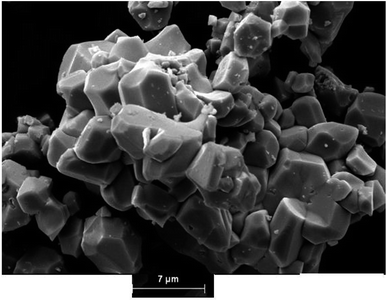
The morphology and particle size of the electrode materials for rechargeable batteries strongly affect the Li+ de-/insertion reaction. The morphological study was conducted by scanning electron microscopy (SEM) to perform an observation of the morphology and also for the determination of the particle size distribution of the Li2M(WO4)2 for cobalt, nickel, and copper compounds. Fig. 2a, 3a and 4a show the SEM micrographs of the synthesized materials. This morphological features, together with the X-ray data (Fig. 2) confirms the high crystallinity of the studied samples, The comparison of the micrographs shows clearly that the metal based Li2M(WO4)2 (M = Co, Ni, Cu) oxides materials has a great influence on the morphological properties. Strong agglomeration of the primary particles is observed mainly for the material Li2Co(WO4)2 (Fig. 5) which could have an effect on the conductivity and electrochemical properties of the Co-based compound.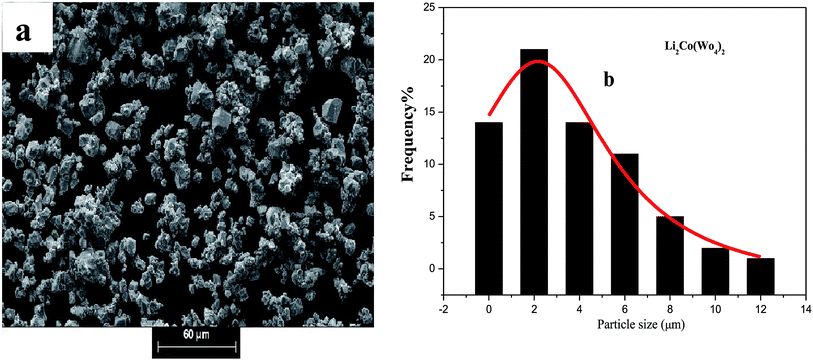 | ||
| Fig. 2 (a) SEM micro-graphs and (b) the corresponding histograms for statistical calculation of the particle size of Li2Co(WO4)2. | ||
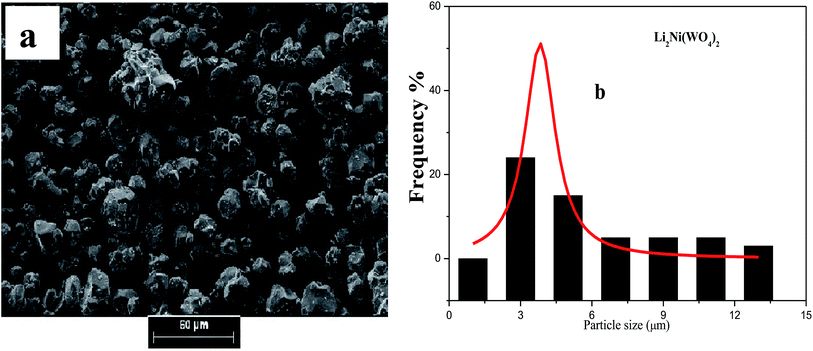 | ||
| Fig. 3 (a) SEM micro-graphs and (b) the corresponding histograms for statistical calculation of the particle size of Li2Ni(WO4)2. | ||
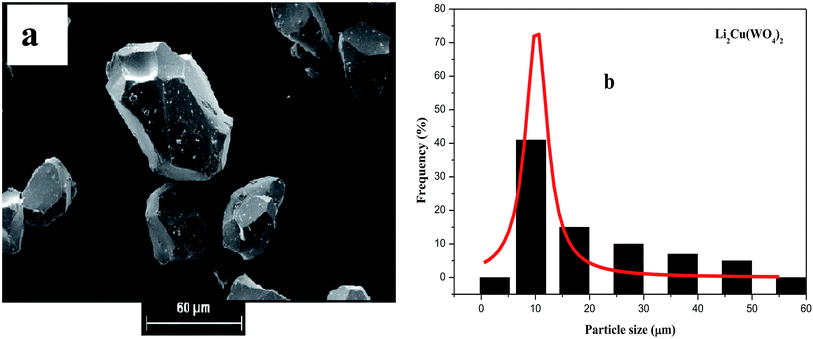 | ||
| Fig. 4 (a) SEM micro-graphs and (b) the corresponding histograms for statistical calculation of the particle size of Li2Cu(WO4)2. | ||
The analysis of SEM images using the software (image J) leads to the determination of the particle size distribution of the elementary particles. The statistical determination of the sizes was carried out on a hundred of the particles. Fig. 2b, 3b and 4b shows the histogram of the statistical calculation of the particle size. The size distribution of the particles is of Gaussian type and is relatively homogeneous with an average particle size of about 2.1 μm, 3.46 μm, and 9.81 μm for the Li2Co(WO4)2, Li2Ni(WO4)2, and Li2Cu(WO4)2 respectively. This result confirm the SEM micro-graphs (Fig. 3) and indicates that the nature of the metal has a strong effect on the average particle size and the particle size distribution of the primary particles of Li2M(WO4)2 materials.
3.3. Infrared spectroscopy
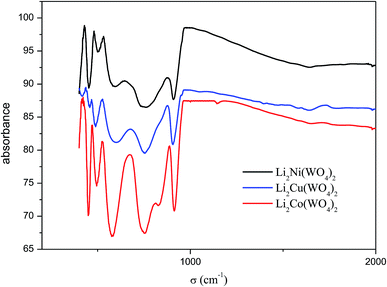
The IR spectra are presented in Fig. 6. Table 3 summarizes the observed vibrational wavenumbers and their assignments. A look at the spectra allows makes it possible to notice that these spectra are very similar and the frequencies of all the peaks observed are very close suggesting that these compounds are isostructural. The assignment of the internal modes are obtained by a comparison with previous studies compounds ZnWO4, LiIn(WO4)2, LiFe(WO4)2 and LiYb(WO4)2.15 This attribution shows the all modes observed in experimental spectra are assigned to the symmetric and asymmetric vibrational stretching of (WO4)2 and confirm the formation of the double oxygen bridges in these structures,16 the deformation modes of WO4 and the internal modes of MO6 which M = Ni, Cu and Co are located below 400 cm−1.| IR frequency (cm−1) | Symmetry and assignments | |||
|---|---|---|---|---|
| Li2Ni(WO4)2 | Li2Cu(WO4)2 | Li2Co(WO4)2 | ||
| 915 | 908 | 910 | Au | νs(W–O) |
| 826 | 816 | 822 | Bu | νas(W–O) |
| 751 | 748 | 750 | Au | νas(WOOW) |
| 594 | 581 | 584 | Bu | νas(WOOW) |
| 502 | 486 | 493 | Au | νas(WOOW) |
| 454 | 450 | 450 | Bu | νas(WOOW) |
3.4. Thermal analyze
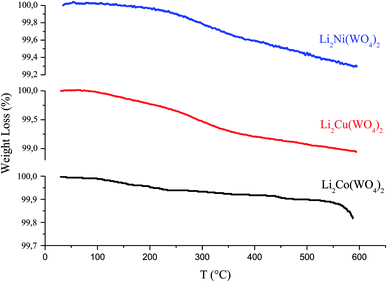
The thermal analysis of Li2MWO4 (M = Ni, Cu and Co) was carried out for the as prepared samples using thermogravimetric analysis (TGA) to determine the thermal stability and crystallization temperature of these compounds. Fig. 7 shows the TG curve of as-prepared s materials. From the TGA curve, it is evident that this compound undergoes a very low weight loss (between 100% and 99%) observed between 30 and 600 °C. The weight loss observed below 150 °C is associated with the solvent evaporation, whereas the major weight loss over the range of 150–600 °C is essentially ascribed to the precursor decomposition and evaporation of other organic functional groups.17 A larger loss above 550 °C for the cobalt-based compound indicates the existence of carbonates.3.5. Conductivity at room temperature
Fig. 8 presents the Nyquist plot of Li2M(WO4)2 for cobalt, nickel, and copper, respectively at room temperature. The Nyquist plot consists of a depressed semicircle in the high-frequency region and inclined line in low frequency region. The depressed semicircle in middle to high frequency region is attributed to the response of the grain and the inclined line in low frequency region corresponding to the response of the grain boundary and electrode effect.18,19 The three sample are described by the same equivalent circuit which is modeled by a combination series of two cell, the first is composed a parallel R and CPE circuits and the second is composed a parallel R, C and CPE elements, where R is resistance (bulk resistance), C is capacitance and CPE is the complex element: constant phase element (capacity of the fractal interface).20 The CPE element accounts for the observed depression of semicircles and also the non-ideal electrode geometry. The obtained values of the simulate Nyquist plots allows to determinate the conductivity of grain based in the following equation:21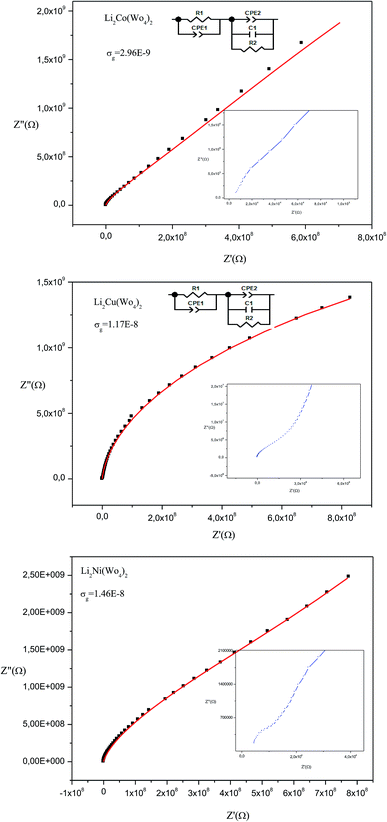 | ||
| Fig. 8 Complex impedance spectra as a function of temperature with electrical equivalent circuit of Li2M(WO4)2 (M = Co, Ni and Cu). | ||
The calculate value of conductivity are listed in Table 4 which indicate the weak conductivity of these materials at room temperature. We can also notice that the highest conductivity among the three synthesized compounds is attributed to the Ni-based compound and the lowest value attributed to the Li2Co(WO4)2. This result can be explain by the agglomeration observed in the SEM micro-graphs of the Li2Co(WO4)2 compound (Fig. 3) and not observed in the SEM micro-graphs of the of Ni and Cu based compounds.
| Sample | Conductivity at 300 K |
|---|---|
| Li2Ni(WO4)2 | 1.46 × 10⁻⁸ Ω−1 cm−1 |
| Li2Cu(WO4)2 | 1.17 × 10⁻⁸ Ω−1 cm−1 |
| Li2Co(WO4)2 | 0.29 × 10⁻⁸ Ω−1 cm−1 |
3.6. Electrochemical properties
In order to compare the electrochemical properties of the high purity Li2M(WO4)2 oxides synthesized in this work. The electrochemical performances of three Li2M(WO4)2 (M = Co, Ni, Cu) samples were evaluated as positive electrode in coin cells in voltage range 1.5–4.5 V at room temperature. The electrochemical properties of all samples were evaluated without any further optimization such as particle size reduction or carbon coating.Cyclic voltammetry (CV) is a convenient technique for evaluation of the electrochemical performance and electrode kinetics of oxide material. Fig. 9 displays the CV curves of Li2M(WO4)2 for cobalt, nickel, and copper at room temperature in the voltage range of 1.5–4.5 V at scan rate of 0.1 mV s−1. The CV curves show only one pair symmetrical and large redox peaks corresponding to the intercalation/deintercalation of Li+ ions into/from the structure of Li2M(WO4)2 materials. The anodic and cathodic peaks occur at about 4.35 and 1.8 V, respectively. To determine the electrochemical reaction reversibility, an important parameter of the separation potential (ΔEp) between anodic and cathodic peaks should be taking into account. The ΔEp of the Li2Co(WO4)2 is 2.15 V, for the Li2Cu(WO4)2 is 1.98 V and for the Li2Ni(WO4)2 is 1.93 V. This result confirm that the material Li2Ni(WO4)2 shows the best reversibility of lithium extraction/insertion during charge/discharge process.
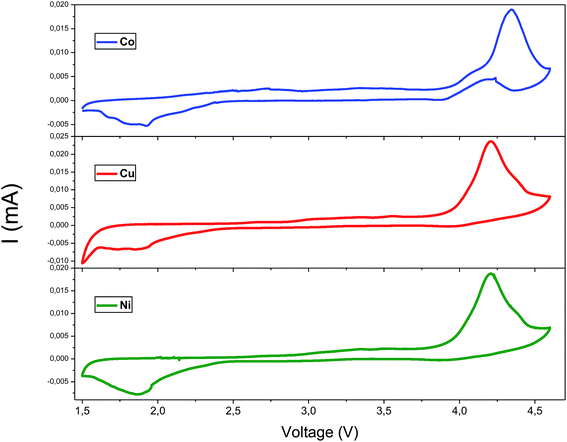 | ||
| Fig. 9 The cyclic voltammetry curves of Li2M(WO4)2 (M = Co, Ni and Cu) cathode materials in the voltage range 1.5–4.5 V. | ||
To study the influence of the nature of metal of Li2M(WO4)2 materials on their cycling performances, The electrode materials were galvanostatically evaluated in the voltage range of 1.5–4.5 V at room temperature.
The electrochemical charge/discharge measurements were carried at the charge/discharge rate C/20 for the Li2Ni(WO4)2, Li2Co(WO4)2 and Li2Cu(WO4)2 compounds. Initial charge/discharge curves recorded at room temperature are presented in Fig. 10 for the studied cathode materials. The three materials show a continuous increase of the voltage with Li-extraction (charge), than a pseudo plateau starting from 4.35 V with low polarization is observed for all samples, which corresponds to approximately 0.1–0.2 Li+-ion de-insertion during the charge processes. During the discharge, the reversible process is observed. The voltage decreases continuously until the appearance of small plateau at around 1.8 V in good agreement with the CV measurement. The analysis of the charge/discharge curves suggests the existence of the of a solid solution domain during the first charge and discharge process of Li2Ni(WO4)2, Li2Co(WO4)2 and Li2Cu(WO4)2 materials.22–24 Fig. 11 shows the evolution of the discharge capacity as function of the number of cycles during 50 cycles at C/20. Li2Ni(WO4)2, Li2Co(WO4)2 and Li2Cu(WO4)2 materials show initial discharge capacities of 35, 32 and 30 mA h g−1 respectively. However the three materials show different cycling behaviors. Noticeable capacity drop until the 15th cycle is observed Li2Co(WO4)2 and Li2Cu(WO4)2 electrode materials. However, Li2Ni(WO4)2 electrode material shows stable cycling during 15 cycles with a reversible discharge capacity of about 30 mA h g−1. This rapid decrease in capacity for Li2Co(WO4)2 and Li2Cu(WO4)2 materials is mainly due to their high particle size and to the strong agglomeration of the particles of these materials and was confirmed by the results obtained by SEM analyses. Li2Ni(WO4)2, Li2Co(WO4)2 and Li2Cu(WO4)2 materials deliver discharge capacity of about 23, 13 and 11 mA h g−1 respectively after 50 cycles. As shown, After 50 cycles, the sample Li2Ni(WO4)2 shows the best cycling behavior. This electrode exhibits the highest rechargeable capacity (30 mA h g−1) during 15 cycles, with highest capacity retention after 50 cycles (approximately 50% of capacity retention).
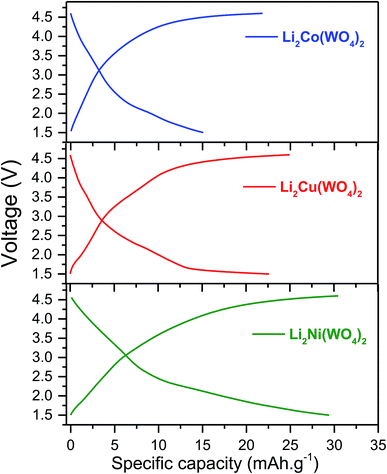 | ||
| Fig. 10 Selected voltage profiles vs. capacity of Li2Ni(WO4)2, Li2Co(WO4)2 and Li2Cu(WO4)2 cathode material for Li-ion batteries in the voltage range 1.5–4.5 V at C/20. | ||
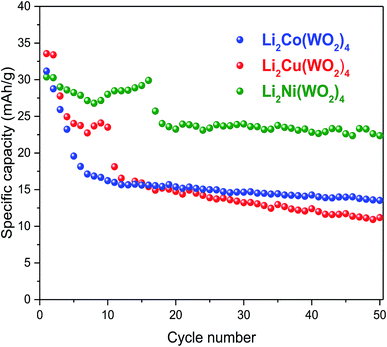 | ||
| Fig. 11 Evolution of the discharge capacity vs. cycle number the of Li2M(WO4)2 (M = Co, Ni and Cu) cathode materials for Li-ion batteries in the voltage range 1.5–4.5 V at C/20. | ||
It is easily understood that the capacity drop after first discharge for the samples based on Co and Cu should be related to their high particle size which leads to the unfavorable interaction with liquid electrolyte.25–27 Interestingly, Li2Ni(WO4)2 illustrates the best capacity retention compared to Li2Co(WO4)2 Li2Cu(WO4)2 during cycling. Indeed, among the studied samples, the Li2Ni(WO4)2 shows the best electrochemical performances due to its good crystallinity, the smallest particle size which benefits Li+-diffusion in Li2Ni(WO4)2 structure.
4. Conclusions
Li2M(WO4)2 for cobalt, nickel, and copper pure compounds with wolframite type were successfully synthesized by a solid-state reaction method. The powders have a triclinic structure with P![[1 with combining macron]](https://www.rsc.org/images/entities/char_0031_0304.gif) space group and the particle size is in the range 1–10 μm. IR spectra show that these compounds are similar and confirm the presence of the WO42−. Complex impedance analysis reveals the contribution of the bulk grain boundary in the electrical properties and allows to determinate the equivalent circuit. The conductivity of these compounds was determined and showed the insulating nature at room temperature. The cyclic voltammetry measurements suggest that the separation potential (ΔEp) between anodic peak and cathodic peak is high which explains the difficulty to use the studied compounds as a cathode material for Li-ion batteries battery systems. The electrochemical charge/discharge measurements suggest that material based on Ni metal provides the enhanced specific capacity (∼35 mA h g−1) in good agreement with the result obtained by the SEM results indicate the low particle size of the Li2Ni(WO4)2 compound that present low agglomeration of the primary particles and impedance spectroscopy results that confirmed that Li2Ni(WO4)2 material has the high conductivity.
space group and the particle size is in the range 1–10 μm. IR spectra show that these compounds are similar and confirm the presence of the WO42−. Complex impedance analysis reveals the contribution of the bulk grain boundary in the electrical properties and allows to determinate the equivalent circuit. The conductivity of these compounds was determined and showed the insulating nature at room temperature. The cyclic voltammetry measurements suggest that the separation potential (ΔEp) between anodic peak and cathodic peak is high which explains the difficulty to use the studied compounds as a cathode material for Li-ion batteries battery systems. The electrochemical charge/discharge measurements suggest that material based on Ni metal provides the enhanced specific capacity (∼35 mA h g−1) in good agreement with the result obtained by the SEM results indicate the low particle size of the Li2Ni(WO4)2 compound that present low agglomeration of the primary particles and impedance spectroscopy results that confirmed that Li2Ni(WO4)2 material has the high conductivity.
Conflicts of interest
There are no conflicts to declare.References
- C. Gong, Y. J. Bai, J. Feng, R. Tang, Y. X. Qi, N. Lun and R. H. Fan, ACS Appl. Mater. Interfaces, 2013, 5, 4209–4215 CrossRef CAS PubMed.
- H. W. Shim, A. H. Lim, J. C. Kim, G. H. Lee and D. W. Kim, Chem.–Asian J., 2013, 8, 2851–2858 CrossRef CAS PubMed.
- E. Zhang, Z. Xing, J. Wang, Z. C. Ju and Y. T. Qian, RSC Adv., 2012, 2, 6748–6751 RSC.
- L. S. Zhang, Z. T. Wang, L. Z. Wang, Y. Xing, X. F. Li and Y. Zhang, J. Mater. Sci., 2014, 305, 179–185 CAS.
- X. W. Xi, L. Yang, M. C. Liu and L. B. Kong, Ionics, 2017 DOI:10.1007/s11581-017-2200-0.
- G. Hitoki, T. Takata, S. Ikeda, M. Hara, J. N. Kondo, M. Kakihana and K. Domen, Catal. Today, 2000, 63, 175–181 CrossRef CAS.
- O. Musset and J. P. Boquillon, Appl. Phys. B: Lasers Opt., 1997, 65, 13 CrossRef CAS.
- M. C. Pujol, M. Rico, C. Zaldo, R. Sole, V. Nikolov, X. Solans, M. Aguilo and F. Diaz, Appl. Phys. B, 1999, 68, 187 CrossRef CAS.
- N. Faure, C. Borel, M. Couchand, G. Basset, R. Templier and C. Wyon, Appl. Phys. B, 1996, 63, 593 CAS.
- K. Byrappa and A. Jain, J. Mater. Res., 1996, 11, 2869 CrossRef CAS.
- R. Salmon, A. Casalot, G. Le Flem and P. Hegenmuller, Mater. Res. Bull., 1970, 5, 341 CrossRef CAS.
- R. O. Keeling, Acta Crystallogr., 1957, 10, 209 CrossRef CAS.
- M. D. Abramoff, P. J. Magelhaes and S. J. Ram, Image processing with Image J, Biophotonics International, 2004, 11, 36–42 Search PubMed.
- M. Alvarez-Vega, J. Rodríguez-Carvajal, J. G. Reyes-Cárdenas, A. F. Fuentes and U. Amador, Chem. Mater., 2001, 13, 3875 CrossRef.
- V. V. Fomichev and O. I. Kondratov, Spectrochim. Acta, Part A, 1994, 50, 1113 CrossRef.
- M. M. aczka, J. Hanuza, A. F. Fuentes and U. Amador, J. Raman Spectrosc., 2002, 33, 56–61 CrossRef.
- J. J. J. Joy and N. V. Jaya, J. Mater. Sci.: Mater. Electron., 2013, 24, 1788–1795 CrossRef.
- K. Karoui, A. Ben Rhaiem and K. Guidara, Ionics, 2011, 17, 517–525 CrossRef CAS.
- K. Karoui, A. Ben Rhaiem, F. Hlel, M. Arous and K. Guidara, Mater. Chem. Phys., 2012, 133, 1–7 CrossRef CAS.
- J. R. MacDonald, Impedance Spectroscopy: Emphasizing Solid Materials and Systems, John Wiley & Sons, New York, 1987 Search PubMed.
- C. Ben Mohamed, K. Karoui, S. Saidi, K. Guidara and A. Ben Rhaiem, Phys. B, 2014, 451, 87–95 CrossRef.
- A. Mahmoud, M. Yoshita, I. Saadoune, J. Broetz, K. Fujimoto and S. Ito, Mater. Res. Bull., 2012, 47, 1936–1941 CrossRef CAS.
- A. Mahmoud, I. Saadoune, J. M. Amarilla and R. Hakkou, Electrochim. Acta, 2011, 56, 4081–4086 CrossRef CAS.
- A. Mahmoud, I. Saadoune, S. Difi, M. T. Sougrati, P. E. Lippens and J. M. Amarilla, Electrochim. Acta, 2014, 135, 536–542 CrossRef CAS.
- C. L. Li and Z. W. Fu, Electrochim. Acta, 2008, 53, 4293–4301 CrossRef CAS.
- A. Mahmoud, J. M. Amarilla, K. Lasri and I. Saadoune, Electrochim. Acta, 2013, 93, 163–172 CrossRef CAS.
- A. Mahmoud, J. M. Amarilla and I. Saadoune, Electrochim. Acta, 2015, 163, 213–222 CrossRef CAS.
| This journal is © The Royal Society of Chemistry 2019 |

