 Open Access Article
Synthesis of fluorescent drug molecules for competitive binding assay based on molecularly imprinted polymers†
Muyasier Wubulikasimua,
Turghun Muhammad *a,
Mukhtar Imerhasan*a,
Nurmemet Hudaberdib,
Wenwu Yanga,
Jianzhang Zhao
 c and
Xiaojun Peng
 c
c
aCollege of Chemistry & Chemical Engineering, Xinjiang University, Xinjiang Key Laboratory of Oil and Gas Fine Chemicals, Urumqi 830046, P. R. China. E-mail: imerhasan@xju.edu.cn; turghunm@sina.com
bYili Chuanning Biotechnology Co., Ltd., Yining 835000, P. R. China
cState Key Laboratory of Fine Chemicals, Dalian University of Technology, Dalian 116024, P. R. China
First published on 26th February 2019
Abstract
Fluorescent immunosorbent assay (FIA) is very promising for sensitive and selective analysis in bio-medical applications. Here, we proposed an assay, using fluorescent engineering of analytes and the corresponding molecularly imprinted polymers (MIPs) as a plastic antibody. Three drug molecules (metronidazole, zidovudine and lamivudine) were condensed with 9-aminoacridine, using succinic anhydride as a spacer. The target products were characterized with 1H-NMR, IR and mass spectrometry. UV-vis absorption and fluorescent properties of the fluorophore-labeled drug molecules were investigated. Feasibility of the fluorescent biomimetic immunosorbent assay based on MIPs was demonstrated in the solution. This work will provide sound foundation for the future application in real sample.
1 Introduction
Fluorescence labeling with fluorescent protein or organic molecules is one of the most common methodologies used for bioanalytical purposes.1 Recently, the development and innovation of fluorescent labeling has greatly facilitated the drug analysis. Metronidazole, zidovudine, lamivudine are common and fundamental drugs which are playing important roles in treatment of several types of diseases. And safety use and research about these drugs have been attracted worldwide attention in medical and chemical communities. Metronidazole is a nitroimidazole antibiotic that was introduced in 1950s. It has been widely used for infections caused by protozoa (e.g., trichomoniasis, giardiasis, amoebiasis) and anaerobic bacteria (e.g., Clostridium spp., Bacteroides spp.).2 Nowadays metronidazole is still commonly used because of its potent activity, attractive pharmacokinetic and pharmacodynamic properties, favorable side-effect profile, and low cost.3 It has excellent bioavailability (>90%) and penetrates cerebrospinal fluid and hepatic abscesses. Zidovudine (AZT) belongs to the class of nucleoside reverse-transcriptase inhibitors (NRTIs),4 and it is a pyrimidine synthetic analogue active against human immunodeficiency virus type 1 (HIV-1).5 Zidovudine has been approved for the treatment of HIV-1, and even helping with prevention of maternal-fetal HIV-1 transmission.6 Lamivudine is a potent and effective anti-retroviral drug, which is prescribed in the human immune virus (HIV) therapy. It is a water-soluble nucleoside analog and plays a vital role to inhibit reverse transcriptase.7Currently, these drugs are often determined and analysed by HPLC and HPLC-MS. However, their fluorescence analysis is rarely reported in relevant field. Herein, it is important to develop a fluorescent biomimetic immunosorbent assay which is simple, selective and accurate.
Fluorescence reagents play an extremely important role and have always been the focus of research in the field of chemistry and biological analysis.8 Among them, 9-aminoacridine (9-AA) is the parent compound of a family of pharmacologically active model substances9 and is also a fluorescent dye of nitrogen heterocyclic bases. 9-AA has the active amino group which can be used to label other molecules. The molecules containing 9-AA moiety have been shown to have high biological activity such as antibacterial, mutagenic and antitumor effect.10,11 Owing to good fluorescence, physicochemical properties, biological activities, and as well as carrying with active amino group, 9-AA has been widely utilized in different areas such as pharmacology, toxicology, organic synthesis, and biochemistry.12,13 However, utilization this molecule for fluorescence labelling and further use in immune assay is not found in literature reports.
Now, labelling of proteins and drug molecules have been carried out using click-chemistry, condensation reaction, ester/amide bond formation, and thiol-ene reactions.14 It is well-known that the labelling reagent shouldn't bring obvious change about the properties of analyte such as chemical and biological activities. To address this issue, a spacer is often used to connect the target molecule with a fluorescence reagent. Carrying with reactive groups, the spacer can facilitate labelling reactions. As a spacer, succinic anhydride (SA) is often used to connect amines or alcohols by ester or amide bond.15,16 SA produces a four-carbon chain between the two molecules through two step reactions.17–19 SA is a good choice in the labelling of drug molecules.
It has been proved on many occasions that molecularly imprinted polymers (MIPs) have the potential to become cost-efficient and robust alternatives to natural antibodies as a recognition element in bioanalytical assays.20 MIPs, as a biomimetic synthetic receptor, have been widely used in all respects, due to specific recognition, high specificity, simple preparation, low cost and high temperature tolerance.21,22 Hence, MIPs were also commonly used in immunoassay.23,24 The immune adsorption experiment is simple and fast, meanwhile, fluorescence properties can improve the sensitivity of drug analysis.
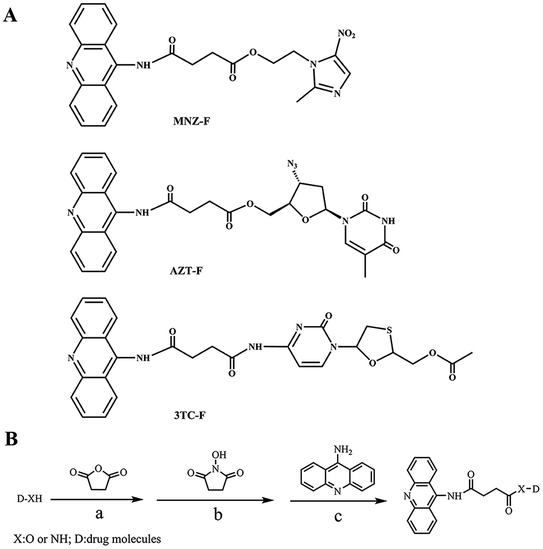
In this study, we selected 9-AA as a fluorescent reagent and succinic anhydride as a spacer to label drug molecules (metronidazole, zidovudine and lamivudine) in Scheme 1. The synthesized molecules (MNZ-F, AZT-F, 3TC-F) were further characterized and verified. Finally, the labeled drug molecules were used as competitors, to develop competitive binding assay for the three drugs using corresponding MIPs (plastic antibodies).
2 Results and discussion
2.1 Preparation
Structures of target compounds are depicted in Scheme 1(A). The target compounds MNZ-F, AZT-F, 3TC-F were obtained by conjugation of drug molecules with fluorescent labeling reagent 9-AA via spacer succinic anhydride. Synthetic routes of drug-linker-fluorophore was shown in Scheme 1(B). Nucleophilic addition reaction between the active group of succinic anhydrides and –OH or –NH2 group of drug molecules (MNZ, AZT, 3TC-ES) gives the intermediate (D-SA). Then, the intermediate was used as a building block for the synthesis of the target compounds. N-Hydroxysuccinimide was used to produce activated intermediates (D-SA-HAS). Then the intermediate was further labeled with 9-AA by nucleophilic substitution to yield the target compounds. Molecular structures of MNZ-F, AZT-F and 3TC-F were confirmed with 1H NMR, IR and MS spectra. The yields of MNZ-F, AZT-F and 3TC-F were 29%, 27% and 14%, respectively. Conjugating surface and steric hindrance of 3TC-F are larger than that of MNZ-F, AZT-F, so yield of 3TC-F is lower than that of other two products.2.2 Fluorescence characteristics
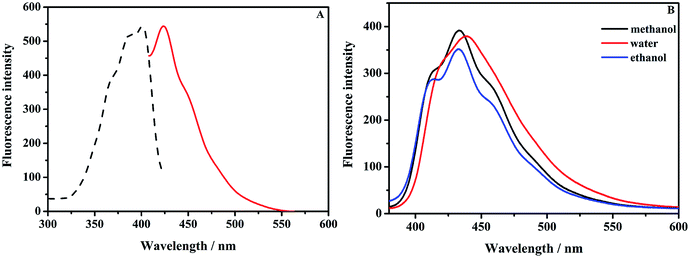
Firstly, optically matched solutions of 9-AA, MNZ-F and AZT-F were prepared. Excitation spectra (EX) and emission spectra (EM) of MNZ-F was shown in Fig. 1(A). The results showed that 9-AA has two strong peaks in the range of 300–600 nm in the excitation spectrum (Fig. S1A†). The maximum excitation wavelengths of 9-AA in methanol are at 405 nm and 425 nm, respectively. However, compared to labeling reagent, MNZ-F and AZT-F (Fig. S2A†) showed only a strong peak in the range of 300–600 nm. Excitation peak position of MNZ-F and AZT-F were blue-shifted to 400 nm and 366 nm. The maximum emission wavelength of 9-AA in methanol are 425 nm and 460 nm, while, emission peak position of MNZ-F and AZT-F were blue-shifted to 440 nm, 430 nm, respectively. The behavior differences in photoluminescence might be caused by the thiazole ring and pyrrolidine ring in the fluorescent labeling drugs.Generally, the polarity of a solvent influences the emission spectra of fluorophores in quantum yields and spectral shifts.25 A fluorescent probe is usually strongly fluorescent in hydrophobic environment but weakly fluorescent in hydrophilic environment (or in more polar solvents).25,26 Interestingly, the opposite behavior was observed on MNZ-F, 9-AA and AZT-F, shown in Fig. 1(B), S1B and S2B,† where fluorescence emission is stronger in water than in ethanol. This phenomenon was also reported in the case of acridine pyrene-3-carboxaldehyde27 and 7-methoxy-4-methylcoumarins.28,29 Moreover, AZT-F displayed the highest fluorescence intensity in water, but 9-AA and MNZ-F showed the highest in methanol.
The results showed that the fluorescent labelled drugs have good fluorescence properties. The molecule AZT-F has higher relative fluorescence quantum yield (0.564) as compared to that of MNZ-F (0.370) and 3TC-F (0.251). Relative fluorescence quantum yield was given in Table 1. Calibration curve parameters were listed in Table 2. The data showed that there was a good linear relationship between the concentration of the labeled drugs and the relative fluorescence intensity.
| Compound | Solvent | Refractive index η | Gradient (×10–5) | Relative quantum yield |
|---|---|---|---|---|
| Quinine sulfate | 0.1 M H2SO4 | 1.333 | 6.56 | 0.547 |
| 9-AA | Ethanol | 1.362 | 4.56 | 0.397 |
| MNZ-F | Water | 1.333 | 4.44 | 0.370 |
| AZT-F | Water | 1.333 | 6.76 | 0.564 |
| 3TC-F | Water | 1.333 | 3.01 | 0.251 |
| Labeled drug | Regression equation | Linear range (mmol) | R2 | Solvent |
|---|---|---|---|---|
| MNZ-F | y = 92.62 + 2401.77x | 0.006–0.18 | 0.9394 | Methane chloride |
| AZT-F | y = 48.81 + 4400.03x | 0.01–0.20 | 0.9975 | Acetonitrile |
| 3TC-F | y = −20.00 + 5405.00x | 0.01–0.20 | 0.9887 | Acetonitrile |
2.3 Competitive binding assay
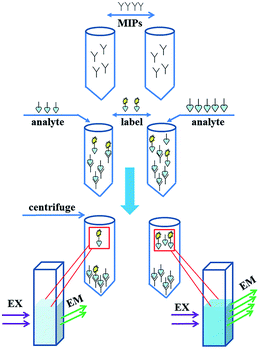
Principle of the fluorescent competitive binding assay is shown in Scheme 2. The imprinted polymers were utilized in a competitive assay to detect MNZ and AZT. The assay principle is based on the competition of the fluorescently labeled compound and unlabeled analyte in solution for the binding sites of the MIPs. If there is less analyte in the sample (left row of Scheme 2), the fluorescent label will have more chance to occupy the limited binding sites. In the consequence, the supernatant solution shows weaker fluorescence. Oppositely, there more analyte present in the sample (right row of Scheme 2), less label will bind with MIPs and stronger fluorescent shown in the supernatant. As labeled compound, MNZ labeled with 9-AA was used. After removing the polymers by centrifugation, supernatant was measured by fluorescence spectrophotometer. | ||
| Scheme 2 Principle of the fluorescent biomimetic immunosorbent assay. MIPs: molecularly imprinted polymers (plastic antibody). | ||
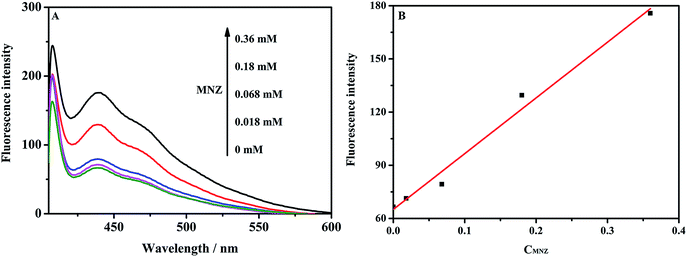
The application of the competitive fluorescent assay was investigated with a fixed concentration of the MNZ imprinted polymer and using MNZ (0–0.36 mM) as an analyte, in the presence of 0.018 mM MNZ-F in chloroform. The results are shown in the Fig. 2(A). MNZ competed with MNZ-F for binding to the imprinted polymers. And the MNZ imprinted polymers were reported elsewhere by our group.30 After centrifugation, the fluorescent intensity of the solution increased with the increasing of MNZ concentration. The results of AZT competitive assay are shown in the ESI (Fig. S3†). A good linearity (R2 = 0.9818) was found between fluorescence intensity and MNZ concentration, shown in Fig. 2(B). Further work needs to be done to confirm feasibility of the assay in the real sample matrix from the point of optimum amount of MIPs, concentration of the label, solvent and finding out IC50.
3 Experimental section
3.1 General methods
All of the chemicals of reagent grade quality were commercially available and used as received. 9-Aminoacridine (9-AA) was synthesized according to ref. 31. Metronidazole, zidovudine and lamivudine were purchased from Hangzhou Dayang General Co. Ltd. (Hangzhou, China). Acetic anhydride was purchased from Kaifeng Chemical Reagent Factory (Kaifeng, China). Dimethylaminopyridine, N,N-dicyclohexylcarbodiimide, dimethylformamide and pyridine were purchased from Sinopharm Chemical Reagent Co. Ltd. (Shanghai, China). All fluorescence spectral measurements were conducted by a fluorescence spectrophotometer (970 CRT Shanghai, China) with a tunable excitation light source. UV-vis analysis was performed a UV-1800 spectrophotometer (Shimadzu, Japan). 1H NMR spectra were measured using a ZAB-HS-400 NMR (Varian, America) using trimethylsilane as interior label. Fourier transform infrared spectroscopy was performed using KBr pellets on a EQUINOX 55 (Bruker, Germany) between 400 and 4000 cm−1. Mass spectrum were detected in EMS mode. For all experiments double distilled water was used.3.2 Measurement of quantum yield
We determined the fluorescence quantum yield of the products obtained according to the reported method.32 Quinine sulfate was used as a reference standard fluorophore and using 0.1 M H2SO4 as solvent, the emission and absorption spectra of all compounds were listed in Table 1. The relative fluorescence quantum yield was calculated by eqn (1):
 | (1) |
3.3 Synthesis
Compound AZT-SA. The details can be found in the ESI.† A yellow grease was obtained, 1.35 g, yield: 92%. 1H NMR (400 MHz, CDCl3) δ: 12.01 (s, 1H), 8.81 (s, 1H), 7.22 (d, J = 1.6 Hz, 1H), 5.78 (d, J = 1.2 Hz, 1H), 4.52 (dd, J = 8.8, 3.2 Hz, 1H), 4.29 (dd, J = 7.6, 4.8 Hz, 1H), 4.21–4.18 (m, 1H), 2.69–2.66 (m, 1H), 2.51–2.48 (m, 1H), 2.01 (s, 3H), 1.48–1.45 (m, 1H) ppm. IR (KBr): νmax 2536, 1707, 1289 cm−1.
Compound 3TC-ES-SA. The details can be found in the ESI.† A white powder was obtained, 0.49 g, yield: 86%. 1H NMR (400 MHz, CDCl3) δ: 12.17 (s, 1H), 10.10 (s, 1H), 8.19 (d, J = 7.6 Hz, 1H), 7.22 (d, J = 7.2 Hz, 1H), 6.24 (t, J = 4.0, 5.2 Hz, 1H), 5.44 (t, J = 3.2 Hz, 1H), 4.50–4.40 (m, 2H), 3.61–3.57 (m, 1H), 3.24–3.34 (m, 2H), 2.64 (t, J = 8.0, 6.0 Hz, 2H), 2.08 (s, 3H) ppm. IR (KBr): νmax 2657, 1738, 1719 cm−1.
![[thin space (1/6-em)]](https://www.rsc.org/images/entities/char_2009.gif) :
:![[thin space (1/6-em)]](https://www.rsc.org/images/entities/char_2009.gif) v (C2H5OH) = 40
v (C2H5OH) = 40![[thin space (1/6-em)]](https://www.rsc.org/images/entities/char_2009.gif) :
:![[thin space (1/6-em)]](https://www.rsc.org/images/entities/char_2009.gif) 3). Solvent was removed under reduced pressure and dried in vacuum. Product was obtained as a yellow powder 7 mg, yield: 29%. 1H NMR (400 MHz, DMSO-d6) δ: 10.79 (s, 1H), 8.16 (t, J = 8.0 Hz, 8.0 Hz, 4H), 8.04 (s, 1H), 7.89–7.85 (m, 2H), 7.64–7.61 (m, 2H), 4.60 (t, J = 8.0 Hz, 8.0 Hz, 2H), 4.43 (t, J = 8.0 Hz, 4.0 Hz, 2H), 2.94 (t, J = 8.0 Hz, 4.0 Hz, 2H), 2.68 (t, J = 8.0 Hz, 8.0 Hz, 2H), 2.46 (s, 3H) ppm. IR (KBr): νmax 3412, 1740, 1263, 757 cm−1. MS (EMS), m/z calcd for C23H21N5O5, 447.1543, found 448.0 [M + H]+, 301.0 [M − MNZ + Na]+, 277.0 [M − MNZ], 195.0 [acridine ammonia fragments + 2H]+.
3). Solvent was removed under reduced pressure and dried in vacuum. Product was obtained as a yellow powder 7 mg, yield: 29%. 1H NMR (400 MHz, DMSO-d6) δ: 10.79 (s, 1H), 8.16 (t, J = 8.0 Hz, 8.0 Hz, 4H), 8.04 (s, 1H), 7.89–7.85 (m, 2H), 7.64–7.61 (m, 2H), 4.60 (t, J = 8.0 Hz, 8.0 Hz, 2H), 4.43 (t, J = 8.0 Hz, 4.0 Hz, 2H), 2.94 (t, J = 8.0 Hz, 4.0 Hz, 2H), 2.68 (t, J = 8.0 Hz, 8.0 Hz, 2H), 2.46 (s, 3H) ppm. IR (KBr): νmax 3412, 1740, 1263, 757 cm−1. MS (EMS), m/z calcd for C23H21N5O5, 447.1543, found 448.0 [M + H]+, 301.0 [M − MNZ + Na]+, 277.0 [M − MNZ], 195.0 [acridine ammonia fragments + 2H]+.Compound AZT-F. The details can be found in the ESI.† A yellow powder was obtained, 0.29 g, yield: 27%. 1H NMR (400 MHz, DMSO-d6) δ: 11.36 (s, 1H), 10.77 (s, 1H), 8.16 (d, J = 8.0 Hz, 4H), 7.85 (t, J = 8.0 Hz, 8.0 Hz, 2H), 7.62 (t, J = 8.0 Hz, 8.0 Hz, 2H), 7.46 (s, 1H), 6.13 (t, J = 8.0 Hz, 4.0 Hz, 1H), 4.34–4.27 (m, 2H), 4.02–3.98 (m, 1H), 3.02 (t, J = 8.0 Hz, 8.0 Hz, 2H), 2.83 (dd, J = 8.0 Hz, 4.0 Hz, 2H), 2.44 (dd, J = 8.0 Hz, 8.0 Hz, 1H), 2.33 (dd, J = 12.0 Hz, 8.0 Hz, 1H), 1.80 (d, J = 4.0 Hz, 1H), 1.75 (s, 3H) ppm. IR (KBr): νmax 3245, 1708, 1272, 751 cm−1. MS (EMS), m/z calcd for C27H25N7O6, 543.1866, found 544.1 [M + H]+, 301.0 [M − AZT + Na]+, 277.0 [M − AZT], 195.0 [acridine ammonia fragments + 2H]+.
Compound 3TC-ES-F. The details can be found in the ESI.† A yellow powder was obtained, 0.29 g, yield: 14%. 1H NMR (400 MHz, CDCl3) δ: 8.34 (dd, J = 8.0 Hz, 8.0 Hz, 2H), 8.13 (d, J = 8.0 Hz, 1H), 7.82 (s, 1H), 7.74 (dd, J = 8.0 Hz, 8.0 Hz, 3H), 7.57 (dd, J = 16.0 Hz, 8.0 Hz, 2H), 7.20 (s, 1H), 6.49 (d, J = 4.0 Hz, 1H), 6.32–6.29 (m, 1H), 5.40 (dd, J = 8.0 Hz, 4.0 Hz, 1H), 4.63 (ddd, J = 12.0 Hz, 8.0 Hz, 4.0 Hz, 2H), 3.66 (dt, J = 8.0 Hz, 8.0 Hz, 8.0 Hz, 1H), 3.33 (dd, J = 12.0 Hz, 4.0 Hz, 1H), 3.12 (t, J = 8.0 Hz, 4.0 Hz, 2H), 2.32 (t, J = 8.0 Hz, 4.0 Hz, 2H), 2.15 (s, 3H) ppm. IR (KBr): νmax 3223, 1733, 1694, 1221, 757 cm−1. MS (EMS), m/z calcd for C27H25N5O6S, found 543.2 [M − CH3CO + K]+, 195.1 [acridine ammonia fragments + 2H]+and 272 [M − 3TC − ES + 5H]+ fragment ion peak.
3.4 Competitive binding assay
Competitive binding assay of MNZ-F was discussed in this manuscript as an example, and for AZT-F can be found in the ESI.† Molecularly imprinted polymers synthesized according to the procedure reported in our previous work.30,35 MIPs particles of MNZ (20 mg) were mixed with 0.018 mM of MNZ-F and the MNZ (final concentration 0–0.36 mM) in the chloroform solvent up to a final volume of 4 mL. The mixture was incubated for 12 h at room temperature in polypropylene tubes on a shaking table. After shaking, the solution was centrifugated and filtrated. Finally, the filtrate was measured by fluorescence spectrometer.4 Conclusions
Three different drug molecules were labeled with a fluorophore 9-aminoacridine. The UV-vis absorption spectra and the fluorescent properties of the fluorophore-labeled drug molecules were studied. No ground state interaction was observed for the drug labeled with fluorophores. AZT-F exhibited higher fluorescence intensity in H2O, 9-AA and MNZ-F showed higher fluorescence intensity in methanol. The binding assay using metronidazole, zidovudine, lamivudine and molecularly imprinted polymers of these three drugs was studied. The results showed that a good linear relationship was established between the concentration of the drug and the relative fluorescence intensity. Our results are useful for the further establishment of immunofluorescence analysis which can be applied in the analysis of biological and medical sample in the future.Conflicts of interest
There are no conflicts to declare.Acknowledgements
This work was supported by the National Natural Science Foundation of China (Grants No. 21462043, 21365020 and 21565025) and the State Key Laboratory of Fine Chemicals (KF 1617).References
- M. S. T. Gonçalves, Chem. Rev., 2009, 109, 190–212 CrossRef PubMed.
- L. Fu, X. F. Liu, Q. X. Zhou, J. X. Zhang, J. Y. Dong and J. Y. Wang, J. Lumin., 2014, 149, 208–214 CrossRef CAS.
- T. A. Goolsby, B. Jakeman and R. P. Gaynes, Int. J. Antimicrob. Agents, 2018, 51, 319–325 CrossRef CAS PubMed.
- H. Liu, F. Gambino, C. Algenio, C. Bouchard, L. Qiao, P. Bu and S. Zhao, Biochem. Biophys. Res. Commun., 2018, 499, 177–181 CrossRef CAS PubMed.
- N. Shahabadi and N. H. P. Moghadam, J. Lumin., 2013, 134, 629–634 CrossRef CAS.
- R. M. Gibson, G. Nickel, M. Crawford, F. Kyeyune, C. Venner, I. Nankya, E. Nabulime, E. Ndashimye, A. F. Y. Poon, R. A. Salata, C. Kityo, P. Mugyenyi, M. E. Quiñones-Mateu and E. J. Arts, Infect. Dis. Poverty, 2017, 6, 163 CrossRef PubMed.
- A. K. Jena, A. K. Nayak, A. De, D. Mitra and A. Samanta, Future Journal of Pharmaceutical Sciences, 2018, 4, 71–79 CrossRef.
- F. Y. Ge, X. L. Yan, H. Y. Fan, X. L. Zhou and L. G. Chen, Chin. J. Anal. Chem., 2005, 33, 1199–1204 CAS.
- P. Garriga, D. Garcia-Quintana and J. Manyosa, Biochem. Biophys. Res. Commun., 1992, 185, 110–115 CrossRef CAS PubMed.
- C. Manivannan and R. Renganathan, J. Lumin., 2011, 131, 2365–2371 CrossRef CAS.
- G. Haydar, M. Imerhasan, K. A. Eshbakova and A. E. Kurbanbaeva, J. Pharm. Biol. Sci., 2016, 4, 41–45 Search PubMed.
- H. R. Zhuang, S. C. Feng and M. Ping, Phys. Test. Chem. Anal., Part B, 2001, 37, 143–146 CAS.
- B. E. Song, M. H. Li and M. Imerhasan, Chin. J. Org. Chem., 2018, 38, 594–611 CrossRef.
- X. Chen and Y. W. Wu, Org. Biomol. Chem., 2016, 14, 5417–5439 RSC.
- A. Jha, C. Mukherjee, A. K. Prasad, V. S. Parmar, M. Vadaparti, U. Das, E. De Clercq, J. Balzarini, J. P. Stables, A. Shrivastav, R. K. Sharma and J. R. Dimmock, Bioorg. Med. Chem. Lett., 2010, 20, 1510–1515 CrossRef CAS PubMed.
- A. Lundgren, Y. Hed, K. Öberg, A. Sellborn, H. Fink, P. Löwenhielm, J. Kelly, M. Malkoch and M. Berglin, Angew. Chem., Int. Ed., 2011, 50, 3450–3453 CrossRef CAS PubMed.
- T. E. Ballard, J. J. Richards, A. L. Wolfe and C. Melander, Chem.–Eur. J., 2008, 14, 10745–10761 CrossRef CAS PubMed.
- Y. L. Kam, H. K. Rhee, H. J. Kim, S. K. Back, H. S. Na and H. Y. P. Choo, Bioorg. Med. Chem. Lett., 2010, 18, 2327–2336 CrossRef CAS PubMed.
- Y. Y. Huang, T. Meng, G. W. Qu and C. Zhang, J. China Pharm. Univ., 2011, 42, 294–298 CAS.
- L. Mattsson, J. Xu, C. Preininger, B. T. S. Bui and K. Haupt, Talanta, 2018, 181, 190–196 CrossRef CAS PubMed.
- X. A. Ton, V. Acha, P. Bonomi, B. T. S. Bui and K. Haupt, Biosens. Bioelectron., 2015, 64, 359–366 CrossRef CAS PubMed.
- K. Haupt, A. G. Mayes and K. Mosbach, Anal. Chem., 1998, 70, 3936–3939 CrossRef CAS.
- I. Chianella, A. Guerreiro, E. Moczko, J. S. Caygill, E. V. Piletska, I. M. Perez De Vargas Sansalvador, M. J. Whitcombe and S. A. Piletsky, Anal. Chem., 2013, 85, 8462–8468 CrossRef CAS PubMed.
- T. Zhang, J. Liu and J. P. Wang, Anal. Methods, 2018, 10, 5025–5031 RSC.
- M. Homocianu, A. Airinei and D. O. Dorohoi, J. Adv. Res. Phys., 2011, 2, 1–9 Search PubMed.
- J. Nakanishi, T. Nakajima, M. Sato, T. Ozawa, K. Tohda and Y. Umezawa, Anal. Chem., 2001, 73, 2920–2928 CrossRef CAS PubMed.
- A. Kellmann, J. Chem. Phys., 1977, 81, 1195–1198 CrossRef CAS.
- J. S. Seixas de Melo, R. S. Becker and A. L. Macanita, J. Chem. Phys., 1994, 98, 6054–6058 CrossRef CAS.
- S. Uchiyama, K. Takehira, T. Yoshihara, S. Tobita and T. Ohwada, Org. Lett., 2006, 8, 5869–5872 CrossRef CAS PubMed.
- T. Muhammad, A. Kadier, H. Mamat and N. Abudukeyoumu, Chin. J. Anal. Chem., 2011, 39, 1841–1845 Search PubMed.
- J. Sebestík, J. Hlavácek and I. Stibor, Curr. Protein Pept. Sci., 2007, 8, 471–483 CrossRef.
- Z. K. Chen, W. Huang, L. H. Wang, E. T. Kang, B. J. Chen, C. S. Lee and S. T. Lee, Macromolecules, 2012, 33, 9015–9025 CrossRef.
- C. C. Lu, Z.-S. Quan, J. C. Sur, S.-H. Kim, C. H. Lee and K. Y. Chai, New J. Chem., 2010, 34, 2040–2046 RSC.
- D. G. Carole, S. Kamal, B. Gérard, D. Florence and J.-P. Galy, Eur. J. Med. Chem., 2007, 42, 1277–1284 CrossRef PubMed.
- Z. Nur, T. Muhammad and Z. Muhammad, Chin. J. Anal. Lab., 2013, 32, 6–10 Search PubMed.
Footnote |
| † Electronic supplementary information (ESI) available. See DOI: 10.1039/c9ra00422j |
| This journal is © The Royal Society of Chemistry 2019 |


