 Open Access Article
Ultradispersed titanium dioxide nanoparticles embedded in a three-dimensional graphene aerogel for high performance sulfur cathodes†
Mengmeng Liua,
Xiaohang Zhua,
Tianye Maa,
Congcong Zhang a,
Xiang Chena,
Xiuhui Zhangb,
Tao Huanga,
Wei Li
 *b and
Aishui Yu
 *ab
*ab
aLaboratory of Advanced Materials, Fudan University, Shanghai 200438, China. E-mail: asyu@fudan.edu.cn; Tel: +86-21-31249125
bDepartment of Chemistry, Shanghai Key Laboratory of Molecular Catalysis and Innovative Materials, Collaborative Innovation Center of Chemistry for Energy Materials, Fudan University, Shanghai 200438, China. E-mail: weilichem@fudan.edu.cn; Tel: +86-21-51630324
First published on 25th February 2019
Abstract
Lithium–sulfur (Li–S) batteries are regarded as one of the most promising energy storage technologies, however, their practical application is greatly limited by a series of sulfur cathode challenges such as the notorious “shuttle effect”, low conductivity and large volume change. Here, we develop a facile hydrothermal method for the large scale synthesis of sulfur hosts consisting of three-dimensional graphene aerogel with tiny TiO2 nanoparticles (5–10 nm) uniformly dispersed on the graphene sheet (GA–TiO2). The obtained GA–TiO2 composites have a high surface area of ∼360 m2 g−1 and a hierarchical porous structure, which facilitates the encapsulation of sulfur in the carbon matrix. The resultant GA–TiO2/S composites exhibit a high initial discharge capacity of 810 mA h g−1 with an ultralow capacity fading of 0.054% per cycle over 700 cycles at 2C, and a high rate (5C) performance (396 mA h g−1). Such architecture design paves a new way to synthesize well-defined sulfur hosts to tackle the challenges for high performance Li–S batteries.
1. Introduction
Lithium–sulfur (Li–S) batteries have been gaining global attention because of their high theoretical specific capacity (1675 mA h g−1), low cost and environmentally friendly nature. Nevertheless, Li–S batteries suffer from some inherent limitations such as poor conductivity of pristine S and discharge products (Li2S2 and Li2S), large volumetric change, and high solubility of the intermediate lithium polysulfides (LiPSs).1–5 These disadvantages usually lead to low S utilization and poor cycling stability.To tackle these challenges, tremendous efforts have been devoted to synthesizing various carbon materials as sulfur hosts due to their high electrical conductivity and good interfacial compatibility with S.6–8 Among them, graphene has been considered as a promising candidate because of its excellent mechanical properties and large surface areas.9 However, the graphene with a lamellar structure is easy to stack so that it is inconducive to the infusion and encapsulation of sulfur. Compared with traditional graphene, three-dimensional (3D) graphene aerogel (GA) with abundant interlaced channels can not only facilitate the infusion of sulfur, but also provide effective pathways for ion transport and accommodate the volume change during redox progresses. However, the non-polarity nature of carbon materials cannot effectively confine the polar LiPSs, which would dissolve in electrolyte and then migrate between the cathode and anode causing the notorious “shuttle effect”. To mitigate the dissolution of polysulfides, various polar materials, including V2O5,10 MnO2,11 TiO2,12,13 Nb2O5,14 ZnO,15 TiS2,16 TiN17 and metal–organic frameworks18,19 have been intensively studied because the chemical bonds between these polar materials and active S/LiPSs can prevent S species from escaping out of the host and increase their utilization.20,21 Among them, TiO2 is regarded as one of the most promising host to contain S for its good absorption ability, low cost, high stability and low toxicity.22–24 Nevertheless, the low conductivity and poor porosity of TiO2 materials limit their applications.25
Herein, we designed and prepared a sulfur host consisting of three-dimensional graphene aerogel with TiO2 nanoparticles (5–10 nm) uniformly attached on the graphene sheets (denoted as GA–TiO2) by a facile hydrothermal method and subsequent high-temperature calcination. The resultant GA–TiO2 composites possess an interconnected porous structure stacked by the graphene sheets, where the tiny TiO2 nanoparticles disperses uniformly. Its specific surface area is calculated to be ∼360 m2 g−1. As a result, the GA–TiO2 composites exhibit an excellent electrochemical performance as a cathode material of Li–S batteries. A high initial specific capability of 1555 mA h g−1 and 810 mA h g−1 at 0.2C and 2C, a good cycling stability with a low capacity fading rate of 0.080% and 0.054% per cycle over 500 and 700 cycles, an approaching 100% coulombic efficiency and an outstanding rate capability are achieved, which are superior to those of the GA cathode.
2. Experimental section
2.1. Preparation of 3D graphene aerogel–TiO2 (GA–TiO2) composites
The 3D GA–TiO2 composites were prepared by a facile hydrothermal method, combined with a high-temperature treatment. First, graphene oxide (GO) was synthesized from natural graphite powder using a modified Hummers method.30 Then, 85.3 mg Ti(SO4)2 and 2.4 mg glucose was dissolved in 50 mL GO aqueous solution (1.6 g L−1) under the magnetic stirring. Next, the mixture solution was transferred into a 100 mL Teflon-sealed autoclave and heated at 180 °C for 12 h. The as-prepared sample was washed with deionized water and ethanol several times, then freeze-dried for 24 h. Finally, the GA–TiO2 composites were obtained after annealing at 800 °C for 2 h in Ar. A series of GA–TiO2 with different TiO2 loading are denoted as GA–TiO2-x where x wt% represents the content of the TiO2 and summarized in Table S1.† As a control, GA was synthesized without Ti(SO4)2 and glucose under the same conditions.2.2. Loading sulfur in GA–TiO2 composites
Loading sulfur in GA–TiO2 composites was conducted by the conventional melt-diffusion method. Briefly, sublimed sulfur powders and GA–TiO2 composites were homogeneously mixed with a mass ratio of 7![[thin space (1/6-em)]](https://www.rsc.org/images/entities/char_2009.gif) :
:![[thin space (1/6-em)]](https://www.rsc.org/images/entities/char_2009.gif) 3 by milling for 1 h. Then the mixture was heated at 155 °C with the protection of Ar for 12 h, leading to the formation of GA–TiO2/S composites.
3 by milling for 1 h. Then the mixture was heated at 155 °C with the protection of Ar for 12 h, leading to the formation of GA–TiO2/S composites.
2.3. Characterizations
Nitrogen sorption isotherms were measured at 77 K with a Micromeritics Tristar 2420 analyzer. Samples for nitrogen adsorption/desorption measurements were obtained from the scrapings of multiple samples. All of the samples were degassed under vacuum at 180 °C for at least 6 h prior to measurements. The Brunauer–Emmett–Teller (BET) method was utilized to calculate the specific surface areas using adsorption data in a relative pressure range from 0.05 to 0.25 with R > 0.995. Using the Barrett–Joyner–Halenda (BJH) model, the pore size distributions were derived from the adsorption branches of isotherms, and the total pore volumes (Vt) were estimated from the adsorbed amount at a relative pressure P/P0 of 0.995. Transmission electron microscopy (TEM) experiments were conducted on a JEOL JEM-2100 F microscope (Japan) operated at 200 kV. The samples for the TEM measurements were suspended in ethanol and supported onto a holey carbon membrane on a Cu grid. Field-emission scanning electron microscopy (FESEM) images were taken on a Hitachi S-4800 microscope. X-ray photoelectron spectroscopy (XPS) was recorded on an AXISULTRA DLD XPS System with MONO Al source. Photoelectron spectra were recorded by using monochromatic Al KR radiation under vacuum at 5 × 10⁻⁹ Pa. X-ray diffraction (XRD) patterns were collected by a Bruker D8 powder X-ray diffractometer (Germany) with Cu Kα radiation (40 kV, 40 mA). Thermogravimetric analysis (TG) was conducted in NETZSCH, 209 F1 at a heating rate of 10 °C min−1 from 35 °C to 900 °C.2.4. Electrochemical measurements
The electrochemical properties were examined using the CR2016 type coin cells which were assembled inside an Ar-filled glove box. Working electrodes with S loading (1.8–2 mg cm−2) were prepared by mixing 80 wt% of active materials, 10 wt% of Ketjen Black and 10 wt% of PVDF dissolved in N-methyl-2-pyrrolidinone. The well homogeneous slurry was smeared onto an Al foil coated with carbon current collector (diameter of 12 mm). The prepared pole pieces were dried at 60 °C for 12 h under vacuum. Lithium bis(trifluoromethylsulfonyl)imide (1 M) dissolved in a mixture of 1,3-dioxolane and 1,2-dimethoxyethane (1![[thin space (1/6-em)]](https://www.rsc.org/images/entities/char_2009.gif) :
:![[thin space (1/6-em)]](https://www.rsc.org/images/entities/char_2009.gif) 1 by volume) with LiNO3 (2 wt%) as an additive was used as the electrolyte. Celgard 2320 was used as the separator. The ratio of electrolyte to sulfur is 25 μL g−1 in the final pole piece. The galvanostatic discharge/charge performance was measured on a Land CT2001A battery test system with the potential ranging from 1.7 to 2.8 V versus Li/Li+ at room temperature. The current rate values were based on the theoretical capacity of sulfur (1C equals to 1675 mA g−1). The specific capacity values were calculated based on the mass of sulfur in the final samples. The specific capacity value was calculated based on the mass of sulfur in the final pole piece. Electrochemical impedance spectroscopy (EIS) measurements were carried out on an IM6e electrochemical workstation (ZAHNER-elektrik GmbH & CoKG, Germany) in a frequency range of 0.1–1 × 10⁵ Hz with an amplitude of 5 mV. Cycling voltammetry (CV) measurements were performed on a CHI 660C electrochemical workstation (CH Instruments, Inc., USA) at a scanning rate of 0.1 mV s−1 within a potential window of 1.7–2.8 V.
1 by volume) with LiNO3 (2 wt%) as an additive was used as the electrolyte. Celgard 2320 was used as the separator. The ratio of electrolyte to sulfur is 25 μL g−1 in the final pole piece. The galvanostatic discharge/charge performance was measured on a Land CT2001A battery test system with the potential ranging from 1.7 to 2.8 V versus Li/Li+ at room temperature. The current rate values were based on the theoretical capacity of sulfur (1C equals to 1675 mA g−1). The specific capacity values were calculated based on the mass of sulfur in the final samples. The specific capacity value was calculated based on the mass of sulfur in the final pole piece. Electrochemical impedance spectroscopy (EIS) measurements were carried out on an IM6e electrochemical workstation (ZAHNER-elektrik GmbH & CoKG, Germany) in a frequency range of 0.1–1 × 10⁵ Hz with an amplitude of 5 mV. Cycling voltammetry (CV) measurements were performed on a CHI 660C electrochemical workstation (CH Instruments, Inc., USA) at a scanning rate of 0.1 mV s−1 within a potential window of 1.7–2.8 V.
3. Results and discussion
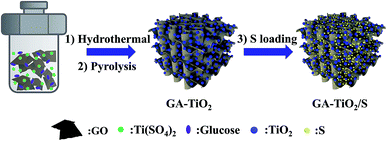
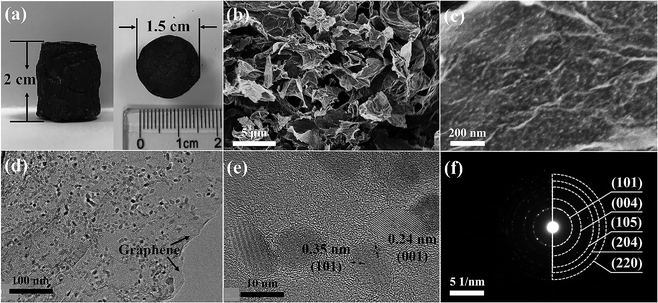
The synthesis of GA–TiO2/S composites is illustrated in Fig. 1. Firstly, the GA–TiO2 composites were prepared via a facile hydrothermal method using Ti(SO4)2 as the Ti precursor and subsequent pyrolysis under Ar. Glucose hinders aggregation of TiO2 nanoparticles and is used as the linker to fix the seeds on the surfaces of GA nanosheets.26 Therefore, ultradispersed and small TiO2 nanoparticles were in situ synthesized successfully tightly attached to the GA nanosheets. Then, sulfur was infiltrated into the inner pores of the GA–TiO2 composites via the conventional melting-diffusion method, leading to the formation of the GA–TiO2/S composites.The optical image shows that the macroscopic morphology of the GA–TiO2 composites is a highly porous cylinder with a diameter of 1.5 cm and a height of 2 cm (Fig. 2a). The scanning electron microscopy (SEM) image of the GA–TiO2 composites clearly reveals that countless pieces of graphene sheets stack to form a loose interconnected structure with numerous micron-sized voids (Fig. 2b), which well agrees with the GA structure (Fig. S2a†). It is obvious that tiny TiO2 nanoparticles are uniformly and loosely attached to the graphene sheets, and no naked sheets or free TiO2 nanoparticles appear (Fig. 2c and d). The particle size of the TiO2 nanocrystals is about 5–10 nm and the edge of graphene can be clearly observed as indicated by the arrows in Fig. 2d. Furthermore, the well-defined crystalline lattice can be identified with the fringe spacing of 0.35 and 0.24 nm in high-resolution TEM image of the GA–TiO2 composites (Fig. 2e), which well corresponds to the interplanar spacing of (101) and (001) facets of anatase TiO2, respectively.27 The polycrystalline nature of these individual TiO2 nanoparticles was also confirmed by the SAED measurements and several important features could be recognized (Fig. 2f). After the infusion of S, the SEM image of GA–TiO2/S composites (Fig. S3a†) shows that the interconnected structure is still maintained. In the TEM image of the GA–TiO2/S composites (Fig. 3a), no bulk S or S agglomerates are observed. The dark field TEM image and the elemental distributions of C, Ti, O and S of the GA–TiO2/S composites (Fig. 3b–f) further reveal the existence of uniform TiO2 nanoparticles and the infiltration of S into the GA–TiO2 composites. It is clear that all the GA–TiO2-x composites have a similar loose interconnected structure with numerous micron-sized voids (Fig. S2c–f†), indicating that the loading of TiO2 has no obvious influence on the 3D porous structure. In addition, the density of the nanoparticles on the surfaces of GA increases distinctly as the content of TiO2 rises.
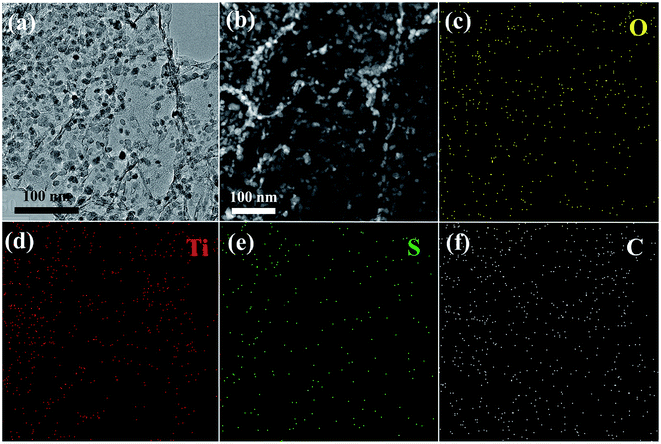 | ||
| Fig. 3 (a) Low-magnification TEM image of GA–TiO2/S. (b) High-angle annular dark-field (HAADF) STEM image of GA–TiO2/S with the corresponding elemental mapping of (c) O, (d) Ti, (e) S, (f) C. | ||
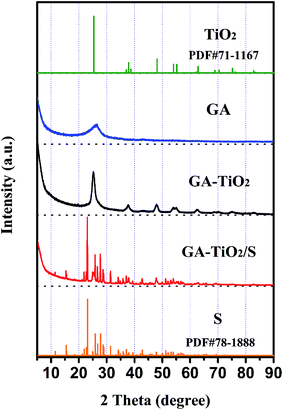
The X-ray diffraction (XRD) pattern of the GA exhibits a weak and broad peak at around 25° (Fig. 4), and the typical peak at 10° corresponding to GO (Fig. S4†) disappears due to the reduction and self-assembly during the hydrothermal process. There are 7 noticeable diffraction peaks in XRD pattern of the GA–TiO2 composites, which are indexed to the (101), (004), (200), (105), (211), (204) and (215) facets of anatase-TiO2, respectively. Notably, the characteristic peak of GA located at 25° is overlapped by the (101) peak of the TiO2. After the infusion of S, numerous S8 characteristic peaks are observable in the XRD patterns of the GA/S and GA–TiO2/S composites, showing the successful incorporation of S into the original materials.
The N2 adsorption–desorption isotherms (Fig. S4a†) of the GA and GA–TiO2 composites both show type IV curves with distinct hysteresis loops close to H3 type, which is a typical characteristic of mesoporous structure. The specific surface area of the GA–TiO2 composites is calculated to be 360 m2 g−1, which is slightly less than that of the GA (592 m2 g−1). The decrease of the BET surface area can be explained by the introduction of the TiO2 particles. The pore size distribution of the GA and GA–TiO2 composites are both around 2.5 nm (Fig. S5b and d†). With the increase of TiO2 loading from 19 to 63 wt%, the surface areas decrease from 486 to 297 m2 g−1.
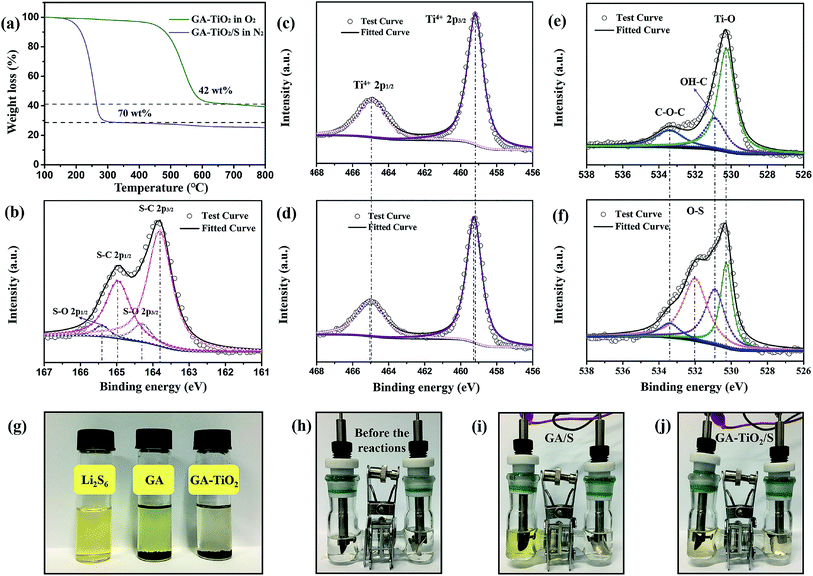
The content of TiO2 in the GA–TiO2 composites are measured by thermogravimetric analysis (TG) (Fig. 5a). After the elimination of graphene in oxygen, the mass remains 42 wt%, representing the TiO2 content in the GA–TiO2 composites. Based on the TG result in nitrogen, the content of sulfur is as high as 70 wt% in both the GA/S and GA–TiO2/S composites. It is clear that this kind of 3D porous framework is able to hold a large amount of S, which is beneficial for retaining the high areal capacity for the practical application. The TiO2 contents in other two GA–TiO2-x composites are determined to be 19 and 63 wt%, respectively (Fig. S6a†). To be fair, the contents of sulfur in other GA–TiO2-x/S are regulated to be about 70 wt% (Fig. S6b†).
X-ray photoelectron microscopy (XPS) is used to investigate the possible interactions between TiO2 and S. In the S 2p region of the GA–TiO2/S composites (Fig. 5b), carbon sulfur (C–S) bonds at 163.8 eV and 164.9 eV, and sulfur oxygen (S–O) bonds at 164.4 eV and 165.4 eV corroborate the strong chemical interaction between GA–TiO2 composites and the infused S.28 The Ti 2p spectra of GA–TiO2 and GA–TiO2/S composites (Fig. 5c and d) both show typical Ti4+ characteristics with two peaks corresponding to Ti 2p1/2 (465.05 eV) and Ti 2p2/3 (459.2 eV) respectively.29 After GA–TiO2 composites being infused with S, both the Ti 2p1/2 (464.9 eV) and Ti 2p2/3 (459 eV) characteristic peaks have a slight deviation to higher binding energy. The higher electronegativity of S results in the decrease of the electron density around Ti atom, and therefore, the binding energy of Ti increases. It is an evidence for the formation of S–O–Ti bond. Especially, the exposed high energy (001) facets greatly facilitate the anchoring of S molecules on the surface of TiO2. The O 1s spectrum of the GA–TiO2 composites (Fig. 5e) can be predominantly fitted into three distinct peaks. The peak at 530.4 eV corresponds to oxygen bound to Ti4+ (Ti–O) in TiO2 as well as the C![[double bond, length as m-dash]](https://www.rsc.org/images/entities/char_e001.gif) O bond in GA.30,31 The other two peaks at 531.2 eV and 533.8 eV can be referred to the hydrated oxygen (OH–C) and epoxide (C–O–C), respectively.32 As for GA–TiO2/S composites, the sulfur infusion has resulted in an extra characteristic peak at 532.1 eV, which can be assigned to oxygen bound to sulfur (O–S) (Fig. 5f).
O bond in GA.30,31 The other two peaks at 531.2 eV and 533.8 eV can be referred to the hydrated oxygen (OH–C) and epoxide (C–O–C), respectively.32 As for GA–TiO2/S composites, the sulfur infusion has resulted in an extra characteristic peak at 532.1 eV, which can be assigned to oxygen bound to sulfur (O–S) (Fig. 5f).
To further demonstrate the interaction between the TiO2 nanoparticles and the polysulfides, an equivalent mass of the GA and GA–TiO2-42 composites were added to a Li2S6 solution (0.01 M), separately. About an hour later, the solution containing the GA–TiO2 becomes completely colorless, while the solution containing GA remained light yellow as shown in Fig. 5g. Subsequently, the GA/S and GA–TiO2-42/S composites are used as the cathodes and metallic lithium is used as the anode to form visible cells for further verifying the anchoring effect between the TiO2 particles and LiPSs. After the same number of 20 cycles at 0.1C, the cell with GA/S as the cathode displays yellow color (Fig. 5i), while the other with GA–TiO2/S composites as cathode (based on the same mass of S in the cathode) gets only light yellow (Fig. 5j). Above results indicate that loaded TiO2 nanoparticles have strong chemical interaction with LiPSs during the charge and discharge processes.
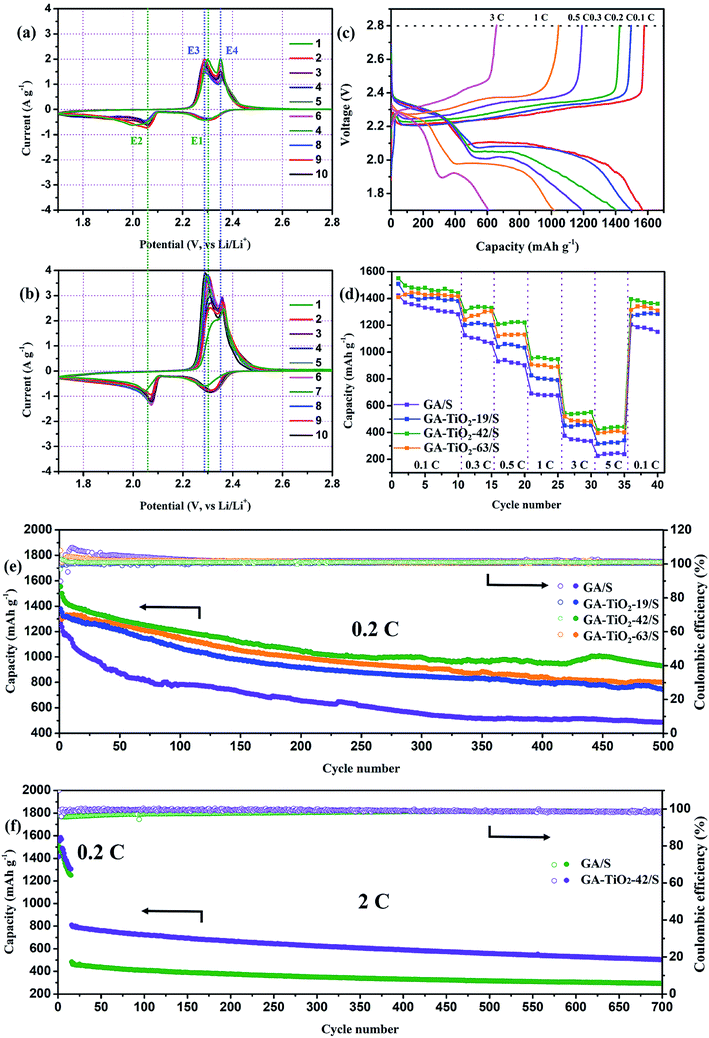
The electrochemical properties of the GA–TiO2-x/S composites as a cathode material in Li–S batteries are investigated by assembling coin cells with metallic lithium as the anode. Typical cyclic voltammetry (CV) profiles of the GA/S and GA–TiO2-x/S composites electrode all show two cathodic peaks and two anodic peaks (Fig. 6a, b and S6b†). In the cathodic reduction process from 2 to 10 cycles, the two representative reductive peaks at approximately 2.3 (vs. Li/Li+, denoted as E1) and 2.07 V (denoted as E2) can be attributed to the reduction of sulfur to long-chain lithium polysulfides (Li2Sx, 3 ≤ x ≤ 8) and the formation of short-chain Li2S2/Li2S, respectively. Notably, after the participation of TiO2, the intensity of E1 is enhanced obviously and the potential moves to a higher voltage range narrower, suggesting the reaction kinetics (S8 + Li+ + e− → Li2S4) at this potential is greatly enhanced. This result confirms that: TiO2 addition is beneficial for the transformation of soluble LiPSs to final insoluble Li2S2/Li2S, which can substantially reduce the possibilities for the soluble LiPSs shuttling in the electrolyte. In the anodic scan, the anodic peaks at about 2.28 V (denoted as E3) and 2.36 V (denoted as E4) are identified as the oxidation of Li2S2/Li2S to intermediate polysulfides and the reverse conversion of polysulfides to sulfur, respectively. Compared with GA/S, E4 peaks of GA–TiO2-x/S are more intense, which confirms that the existence of TiO2 can promote the reaction from soluble polysulfides to sulfur. This high reaction rate can greatly suppress the “shuttle effect”.33 Besides, the peaks of the GA–TiO2-x/S are almost coincided with each other after four cycles, suggesting their excellent reversibility and capacity retention.
Corresponding to the peak current positions in the CV test, the charge–discharge profiles of the GA–TiO2-42/S consist of two discharge plateaus at 2.32 and 2.1 V, and two charge plateaus between 2.26 and 2.35 V at 0.2C respectively. The GA/S electrode exhibits shorter plateaus flattering with a lower discharge capacity and a greater polarization under the same condition (Fig. S9†). When the GA–TiO2-42/S electrode cycles at different rates of 0.1, 0.2, 0.3, 0.5, 1 and 3C, the cell is able to deliver discharge capacities of 1567, 1497, 1404, 1190, 1022 and 604 mA h g−1 (Fig. 6c).
The rate capabilities of Li–S battery based on the GA/S or GA–TiO2-x/S composites decrease gradually with the increase of current (Fig. 6d). However, the capacity of GA–TiO2-42/S can maintain 396 mA h g−1 at 5C, which is much higher than that of the GA/S (226 mA h g−1). Furthermore, after the current rate abruptly switched back to 0.1C after 35 cycles, the capacity of the GA–TiO2-42/S composites can recover to 1395 mA h g−1, indicating that TiO2 considerably enhances the electrochemical stability of Li–S batteries.
In the electrochemical impedance spectroscopy (EIS) measurements (Fig. S10†), the Nyquist plots of the GA/S and GA–TiO2/S both consist of two parts, a semicircle in the high-frequency region representing the interface charge transfer resistance at the electrode–electrolyte interface (Rct) and a straight line in the low-frequency region associated with the mass transfer process. The GA–TiO2/S cathode has the smaller Rct (53 Ω) than that of the GA/S cathode (69 Ω), indicative of better rate performance. After 100 cycles at 0.2C, although the Rct of both GA–TiO2/S and GA/S cathode becomes bigger, GA–TiO2/S is still superior to GA/S cathode.
The cycling performances of the GA/S and GA–TiO2/S composites are presented in Fig. 6e and f. It is clear that all the GA–TiO2/S composites show better cycling performances than that of the GA/S at 0.2C. Among the three GA–TiO2-x/S composites, the GA–TiO2-42/S displays the highest initial discharge capacity (1555 mA h g−1) and maintains the worthy reversible capacity (929 mA h g−1) after 500 cycles with a nearly 100% coulomb efficiency, compared with GA–TiO2-19/S (1377 and 747 mA h g−1) and GA–TiO2-63/S (1302 and 800 mA h g−1) at 0.2C. The capacity retentions over 500 cycles are calculated to be about 54.2, 59.8 and 61.4% for the GA–TiO2-19/S, GA–TiO2-42/S and GA–TiO2-63/S, respectively. It can be seen that the capacity retentions increase slightly as the content of TiO2 is raised. In addition, the discharge curve of GA–TiO2-63/S has an activation process at the beginning, which can be ascribed to the low surface area and the poor conductivity. Because the infiltration of the electrolyte into the internal surfaces needs more time to make the hidden S become electrochemically active. This result confirms that: the TiO2 addition can greatly improve the cycling stability by restraining the shuttling of polysulfides, owing to the chemically adsorbing between the LiPSs and the TiO2 as well as the accelerated transformation from the soluble polysulfides to insoluble products. However, excessive additions are harmful to the reversible capacity due to the decline of electrical conductivity, which is in good accordance with the EIS results. When the current rate increases to a higher rate of 2C after an activated process (at 0.2C), the GA–TiO2-42/S electrode continues to maintain its superiority on the cycling performance with the initial discharge capacity of 810 mA h g−1, a low capacity loss (0.054% per cycle) and a stable coulomb efficiency as high as 98.82% after 700 cycles.
The excellent electrochemical performance of the GA–TiO2/S cathode in Li–S batteries should ascribe to two factors. Firstly, the 3D hierarchical graphene-based framework not only provides fast ion and electron transfer channels, but also affords enough space to accommodate the volume change of S. Secondly, as demonstrated in Fig. 7, uniform and ultradispersed anatase-TiO2 nanoparticles attached on the GA provide abundant polar surfaces to generate strong chemical anchoring effect on LiPSs, especially most of them expose high energy facets, which can effectively inhibit the “shuttle effect”. Thirdly, the chemical interaction promotes the redox reaction kinetics during the charge and discharge processes, further greatly suppressing the shuttling of LiPSs.
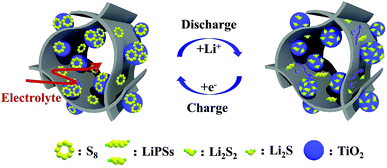 | ||
| Fig. 7 The conversion of S during charge/discharge process on the graphene surface with TiO2 nanoparticles. | ||
Among current works, the electrochemical performance of the cathodes with graphene and/or TiO2 composites serving as the cathode materials of Li–S batteries are compared in Table S2.† The GA–TiO2/S composites in this work stand out among all those Li–S energy-storage technologies because of the excellent electrochemical performance. The GA–TiO2-42/S composites electrode with relatively high S content of 70 wt% exhibits an excellent initial specific capacity and cycle stability at 0.2C. Even at a high current density of 2C, it can be said that the GA–TiO2-42/S cathode presents the outstanding capacity among these studies and even beyond the performances of some materials at 1C. Therefore, the GA–TiO2 composites could achieve tremendous potential for the practical application of Li–S batteries.
4. Conclusion
In summary, large-scale 3D GA–TiO2 composites can be synthesized by a facile hydrothermal treatment followed by high-temperature pyrolysis as a cathode material for Li–S batteries. The GA–TiO2 composites present an interconnected porous network structure with a controllable TiO2 loading and a high surface area of 297–486 m2 g−1. TiO2 is in the form of ultradispersed anatase nanoparticles (5–10 nm) attached to the sheets of GA. When the GA–TiO2 composites are used as a novel cathode material with a high sulfur loading of 70 wt%, they restrain the “shuttle effect” and realize an excellent electrochemical performance in Li–S batteries. Thus, the GA–TiO2/S electrode exhibits a high specific capacity, a high-rate capability and a long cyclic stability with the coulombic efficiency reaching nearly 100% at various current densities, typically a high capacity of 810 mA h g−1 with an ultralow capacity fading of 0.054% per cycle over 700 cycles at 2C. Above excellent results owing to the GA–TiO2 composites combine the advantages of both the conductive 3D porous structure of 3D GA and the chemical interaction between S/LiPSs and TiO2. This study provides the insights on the synergistic influence between nanostructure and chemical restrictions of S hosts for improving electrochemical performance of Li–S batteries, and can be generalized for fabricating advanced cathode materials to accelerate the practical application of Li–S batteries.Conflicts of interest
There are no conflicts to declare.Acknowledgements
This work was supported by the 973 program [2016YFA0204000], National Natural Science Foundation [No. 21473040 and No. 21603036], Science & Technology Commission of Shanghai Municipality [No. 08DZ2270500] and Shanghai Rising-Star Program.Notes and references
- S. Urbonaite, T. Poux and P. Novák, Adv. Energy Mater., 2015, 5, 1500118 CrossRef.
- W. Zhou, B. Guo, H. Gao and J. B. Goodenough, Adv. Energy Mater., 2016, 6, 1502059 CrossRef.
- Y.-X. Yin, S. Xin, Y.-G. Guo and L.-J. Wan, Angew. Chem., Int. Ed., 2013, 52, 13186–13200 CrossRef CAS PubMed.
- A. Manthiram, Y. Fu and Y.-S. Su, Acc. Chem. Res., 2013, 46, 1125–1134 CrossRef CAS PubMed.
- A. Manthiram, Y. Fu, S.-H. Chung, C. Zu and Y.-S. Su, Chem. Rev., 2014, 114, 11751–11787 CrossRef CAS PubMed.
- R. Fang, S. Zhao, Z. Sun, D.-W. Wang, H.-M. Cheng and F. Li, Adv. Mater., 2017, 29, 1606823 CrossRef PubMed.
- Z. W. Seh, Y. Sun, Q. Zhang and Y. Cui, Chem. Soc. Rev., 2016, 45, 5605–5634 RSC.
- S. Li, B. Jin, X. Zhai, H. Li and Q. Jiang, ChemistrySelect, 2018, 3, 2245–2260 CrossRef CAS.
- H. Wang, Y. Yang, Y. Liang, J. T. Robinson, Y. Li, A. Jackson, Y. Cui and H. Dai, Nano Lett., 2011, 11, 2644–2647 CrossRef CAS PubMed.
- Y. Zhang, L. Wang, A. Zhang, Y. Song, X. Li, H. Feng, X. Wu and P. Du, Solid State Ionics, 2010, 181, 835–838 CrossRef CAS.
- J. Liang, Z.-H. Sun, F. Li and H.-M. Cheng, Energy Storage Materials, 2016, 2, 76–106 CrossRef.
- Z. W. Seh, W. Li, J. J. Cha, G. Zheng, Y. Yang, M. T. McDowell, P.-C. Hsu and Y. Cui, Nat. Commun., 2013, 4, 1331 CrossRef PubMed.
- B. Ding, L. Shen, G. Xu, P. Nie and X. Zhang, Electrochim. Acta, 2013, 107, 78–84 CrossRef CAS.
- Y. Tao, Y. Wei, Y. Liu, J. Wang, W. Qiao, L. Ling and D. Long, Energy Environ. Sci., 2016, 9, 3230–3239 RSC.
- T. Ma, M. Liu, T. Huang and A. Yu, J. Power Sources, 2018, 398, 75–82 CrossRef CAS.
- Z. W. Seh, J. H. Yu, W. Li, P.-C. Hsu, H. Wang, Y. Sun, H. Yao, Q. Zhang and Y. Cui, Nat. Commun., 2014, 5, 5017 CrossRef CAS PubMed.
- Z. Cui, C. Zu, W. Zhou, A. Manthiram and J. B. Goodenough, Adv. Mater., 2016, 28, 6926–6931 CrossRef CAS PubMed.
- J. Zhou, R. Li, X. Fan, Y. Chen, R. Han, W. Li, J. Zheng, B. Wang and X. Li, Energy Environ. Sci., 2014, 7, 2715–2724 RSC.
- S. Bai, X. Liu, K. Zhu, S. Wu and H. Zhou, Nat. Energy, 2016, 1, 16094 CrossRef CAS.
- M. Liu, F. Ye, W. Li, H. Li and Y. Zhang, Nano Res., 2016, 9, 94–116 CrossRef CAS.
- C. Li, Z. Xi, D. Guo, X. Chen and L. Yin, Small, 2018, 14, 1701986 CrossRef PubMed.
- G.-N. Zhu, Y.-G. Wang and Y.-Y. Xia, Energy Environ. Sci., 2012, 5, 6652–6667 RSC.
- H. B. Wu, J. S. Chen, H. H. Hng and X. W. Lou, Nanoscale, 2012, 4, 2526–2542 RSC.
- S. K. Das, B. Jache, H. Lahon, C. L. Bender, J. Janek and P. Adelhelm, Chem. Commun., 2016, 52, 1428–1431 RSC.
- S. Yang, X. Feng and K. Muellen, Adv. Mater., 2011, 23, 3575–3579 CrossRef CAS PubMed.
- B. Qiu, M. Xing and J. Zhang, J. Am. Chem. Soc., 2014, 136, 5852–5855 CrossRef CAS PubMed.
- H. B. Wu, J. S. Chen, X. W. Lou and H. H. Hng, Nanoscale, 2011, 3, 4082–4084 RSC.
- L. Zhang, L. Ji, P.-A. Glans, Y. Zhang, J. Zhu and J. Guo, Phys. Chem. Chem. Phys., 2012, 14, 13670–13675 RSC.
- K. Siuzdak, M. Szkoda, J. Karczewski, J. Ryl and A. Lisowska-Oleksiak, Electrochim. Acta, 2016, 222, 1281–1292 CrossRef CAS.
- H. Tang, S. Chang, K. Wu, G. Tang, Y. Fu, Q. Liu and X. Yang, RSC Adv., 2016, 6, 63117–63130 RSC.
- Y. J. Oh, J. J. Yoo, Y. I. Kim, J. K. Yoon, H. N. Yoon, J.-H. Kim and S. B. Park, Electrochim. Acta, 2014, 116, 118–128 CrossRef CAS.
- B. Lim, M. Jiang, P. H. C. Camargo, E. C. Cho, J. Tao, X. Lu, Y. Zhu and Y. Xia, Science, 2009, 324, 1302–1305 CrossRef CAS PubMed.
- Z. Sun, J. Zhang, L. Yin, G. Hu, R. Fang, H.-M. Cheng and F. Li, Nat. Commun., 2017, 8, 14627 CrossRef PubMed.
Footnote |
| † Electronic supplementary information (ESI) available. See DOI: 10.1039/c8ra10397f |
| This journal is © The Royal Society of Chemistry 2019 |

