 Open Access Article
A self-powered triboelectric nanosensor for detecting the corrosion state of magnesium treated by micro-arc oxidation†
Yong-Mei Zhaia,
Wei Li*a,
Min-Fang Chen *ab,
Yan-Kun Lia,
Qi Wanga and
Yan-Song Wanga
aSchool of Materials Science and Engineering, Tianjin University of Technology, 391 of West Bin Shui Road, Xiqing District, Tianjin, 300384, China. E-mail: mfchentj@126.com
bTianjin Key Lab for Photoelectric Materials & Devices, Tianjin University of Technology, 391 of West Bin Shui Road, Tianjin, 300384, China
First published on 1st April 2019
Abstract
Magnesium (Mg) is frequently used as a biocompatible implantable material in the human body, but real-time detection of its corrosion state is not well understood. Fortunately, previous studies of triboelectric nanogenerators (TENG) as self-driven sensors in many fields have proposed solutions for this problem. In this work, Mg-based TENG was prepared as a self-driven sensor to detect the corresponding corrosion state of Mg treated by micro-arc oxidation (MAO-Mg). Mg-based sheets and polydimethylsiloxane (PDMS) film were used as triboelectric materials. The output of TENG was optimal under 350 V–800 Hz micro-arc oxidation (MAO) treatment of Mg, and the Voc, Isc and Qsc were 48.5 V, 35.3 μA and 44.2 nC, which were respectively 2.42, 3.42 and 3.27 times that of the untreated devices. Moreover, a linear relationship was found in simulated body fluid (SBF) immersion tests, showing that the rates of decrease in Isc and Voc were respectively 3.48 and 2.74 times the weight reduction rates of MAO-Mg sheets, indicating that our sensors successfully detected the corrosion of MAO-Mg. This work will lay a preliminary foundation for real-time detection of Mg as an implant in the human body (as do other implantable materials), and demonstrates a potential new application for TENG in the biomedical field.
Introduction
Triboelectric nanogenerators (TENG) based on the triboelectric effect and electrostatic induction have attracted increasing attention since they were first fabricated in 2012 because of their unique method of harvesting energy from the ambient environment.1–3 In order to improve the performance of TENG, a combination of metal and polymer films with large differences in triboelectric polarity is often chosen as the friction material in conjunction with some improved methods, such as surface nanoscale treatment,4,5 surface chemical modification,6,7 and structural improvement.8–11 However, some of these methods are too costly or require complex processing. It is therefore important to find a simpler, cheaper, and more effective method to enhance the performance of TENG. More importantly, the applications of TENG are no longer limited to energy applications. They are increasingly utilized in self-powered sensors, as published by Z. L. Wang's group and other colleagues. In 2013, Lin et al. designed a self-actuated pressure sensor with a sensitivity of 2.3%/Pa.12 A human-computer interactive smart keyboard incorporating this sensor can effectively identify the knocking habits of different testers and has important applications in user identification. In 2014, Yi et al. reported a self-driven triboelectric sensor based on a grounded electrode array for detecting two-dimensional movements, which can be used to monitor the trajectory and velocity of moving objects.13 Yang et al. designed a bionic membrane sensor based on eardrum motion in 2015. This sensor can be used for non-invasive measurement of the body's arterial pulse as a throat microphone, for simple measurement of the rate of respiration and heartbeat, as well as for biometric recognition.14 TENG can also be used as self-driven environmental chemical sensors for the detection of environmental chemical factors such as heavy metal ions15 and organic matter.16,17 In general, the advantages of sensors based on TENG are that they need no external power to drive, and the electrical output signal of TENG can reflect the detected information. Therefore, it is meaningful to further develop such practical self-driven sensors and broaden their fields of application.Magnesium (Mg) and Mg alloys, as fracture internal fixation materials, have become the frontier research direction of biodegradable materials because of their corrosion degradation characteristics and promising biocompatibility. However, their degradation rate does not match the healing time of bone tissue, which greatly restricts clinical application. At present, the best solution may be a bio-active surface modification, which could mainly include bio-active ceramic coating,18 biodegradable polymer coating,19 anodic oxide film, Micro-Arc Oxidation (MAO) film,20 or other options. Bio-coated Mg alloys have been marketed in Germany, Japan and South Korea. High purity Mg bone screws developed independently in China are also in clinical trials, showing broad application prospects of Mg-based systems. However, degradation by corrosion of Mg and Mg alloys implanted in clinical settings or the laboratory can only be detected periodically using X-ray or Computed Tomography.21 Moreover, the experimental results will be biased in practice because of the individual difference between each implant. Thus, the real-time monitoring of degradation by corrosion of Mg-based implants has significant value for research and practical application.
In this study, Mg-based sheets and polydimethylsiloxane (PDMS) film were selected as friction layer materials for TENG devices. Also, MAO technology was used to produce an oxide film on the surface of Mg sheets, which can not only enhance their corrosion resistance, but effectively improve the output performance of TENG by increasing the roughness of the material surface and enlarging the difference of triboelectric polarity between the friction layers. In order to simulate the corrosion of Mg treated by MAO (MAO-Mg) in the human body and explore its relationship with the output performance of TENG, we designed a simulated body fluid (SBF) immersion experiment in vitro. Thus, the relationship between the weight loss of MAO-Mg sheets under different soaking time and the output performance of TENG could be analyzed. The instantaneous monitoring of TENG electrical signal output can be utilized for the detection of corrosion state of MAO-Mg, which offers potential for the monitoring of the service status of Mg alloy implant products in vivo.
Experimental section
Preparation of oxide film on the surface of Mg sheet by MAO
First, a number of Mg sheets (purity 99.95%, thickness 0.5 mm) were cut to 4 cm × 6 cm, polished using sandpaper with specifications of 320#, 800#, 1500#, 3000#, and then cleaned with alcohol and dried carefully using hair dryer.Second, these pretreated Mg sheets were treated with MAO. The composition of the electrolyte of MAO was 12 g L−1 trisodium phosphate and 6 g L−1 sodium hydroxide. Mg sheet was first treated with MAO for 5 min using a duty cycle of 20% and a frequency of 600 Hz at different voltages of 300 V, 350 V and 400 V, respectively. After the MAO process, the samples were cleaned ultrasonically in absolute ethanol solution for 10 min, and dried at room temperature for 12 h. Then, the best voltage of MAO was selected according to the treatment that produced the optimum TENG output.
Third, with the electrolyte and duty cycle held constant, the MAO treatment of Mg sheets was carried out at 400 Hz, 600 Hz, 800 Hz and 1000 Hz respectively under the optimum voltage conditions identified in the previous step. The process was repeated until the best frequency conditions of MAO were obtained.
Ultimately, micro-scale pore structures with different pore sizes and densities were formed on the surface of Mg sheets after MAO treatment.
In vitro immersion test
In order to successfully verify the use of the device in the human body, we designed an in vitro immersion simulation experiment for different days in SBF at 37 °C. The SBF was self-prepared, and its composition and content ratio was shown in Table 1. Those MAO-Mg sheets prepared by the optimal MAO conditions were cut into 3 cm × 3 cm from the middle of them and then immersed in SBF at 37 °C for different times. During the immersion period, the SBF was renewed every two days. One MAO-Mg sheet was taken out every five days, and then washed and dried with alcohol ultrasonic. Finally, MAO-Mg sheets specimens with different corrosion degree under different soaking time of 5, 10, 15, 20, 25 and 30 days were obtained.| Composition | Content (g L−1) | Composition | Content (g L−1) |
|---|---|---|---|
| NaCl | 6.5453 | CaCl2 | 0.2780 |
| NaHCO3 | 2.2683 | Na2SO4 | 0.0711 |
| KCl | 0.3728 | (CH2OH)CNH2 | 6.057 |
| Na2HPO4 | 0.1420 | HCl | 1.8 |
| MgCl2·6H2O | 0.3050 | — | — |
In order to calculate weight loss attributable to corrosion, the corrosion product on the surface of these samples was then removed with 200 g L−1 chromate solution until the surface exposed the metallic luster of underlying, corrosion-free material. The samples were then dried and weighed. The weight loss of the immersed samples was obtained by comparison with its weight before the immersed process. The weight loss is calculated according to the following formula (1).
| w = w0 − wn | (1) |
Here, w is the weight loss of the samples, w0 is the weight of the MAO-Mg sheets before the soaked process, and wn is the weight of the MAO-Mg sheets after soaking for a certain period of time (n indicates the time of soaking), and all units are grams.
Assembly of TENG
A simple vertical contact separation mode was used on the TENG, and its structural design is shown in Fig. 1. The bottom part (3 cm × 3 cm) of TENG was MAO-Mg sheets, one side served as the friction surface, whereas the other was ground to a metallic gloss with 800# sandpaper and used as the induction layer. PDMS films (3 cm × 3 cm) that exhibit relatively high negativity in the triboelectric series were used as the friction layer of the top part, and aluminum foil as the other electrode was connected on its back with polyester tape. Then, copper wire was selected to connect the external circuit. Kapton film (4 cm × 4 cm) was selected as the support material around the structure described above. In addition, TENG was also assembled with the same method using the MAO-Mg sheets which were soaked in SBF for different time periods.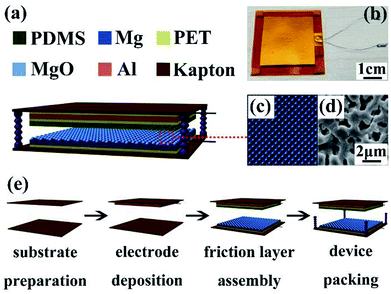 | ||
| Fig. 1 Structural design of TENG.22 (a) Three-dimensional diagram. (b) Optical photographs of device. (c) Schematic diagram and (d) SEM diagram of pore structure on the surface of micro-arc oxidation treated magnesium. (e) Assembly flow chart of TENG. | ||
Characterization
The surface morphology of Mg sheets fabricated using different MAO conditions and soaking times were examined via scanning electron microscopy (SEM). Elements present on the surface of the MAO-Mg sheets after soaking were identified by energy dispersive spectroscopy (EDS). X-ray diffraction (XRD) was used to detect the composition on the Mg surface after MAO treatment. The short-circuit current (Isc), open-circuit voltage (Voc) and the short-circuit translated charge (Qsc) were measured using a Keithley 6514 programmable electrometer (Tektronix, Inc, USA). The data were collected though the LabVIEW Base Development System (National Instruments, USA).Results and discussion
Effect of different MAO voltages on the output performance of TENG
Fig. 2(a–d) shows SEM images of MAO-Mg sheets under different voltage conditions (frequency was 600 Hz). As voltage increased from 0 to 400 V, more micro and nano scale pore structures were formed on the surface of Mg sheets, and the roughness of the material surface was increased. When the voltage was low (300 V, Fig. 2(b)), the surface film was formed slowly and the pores were big and sparse. When the voltage was too high (400 V, Fig. 2(d)), the film was formed quickly, resulting in a more concave and uneven film.23 The most dense and uniform pore structure was obtained at 350 V (Fig. 2(c)) (S1†). In Fig. 2(e–g), the output performance of TENG first increased gradually as the MAO voltage increased from 0 to 350 V. The Voc, Isc and Qsc of TENG reached maxima at a MAO voltage of 350 V. Their numerical values were 41 V, 27.8 μA, and 37.5 nC respectively, which were 2.05, 2.69, and 2.7 times greater than the untreated condition. However, TENG output performance decreased when the MAO voltage increased to 400 V due to the more uneven surface of the Mg sheets. These results indicate that the output of TENG varies consistently with void size and density on the film surface of Mg sheets. In addition, the formation of magnesium oxide (MgO) on the surface of Mg sheets after MAO can effectively improve its dielectric properties, resulting in more charges stored in the contact separation process of friction layers, increasing the surface charge density and improving the electrical output performance of TENG.24 Therefore, the optimal MAO voltage of 350 V was chosen to be used for Mg sheets in subsequent processing.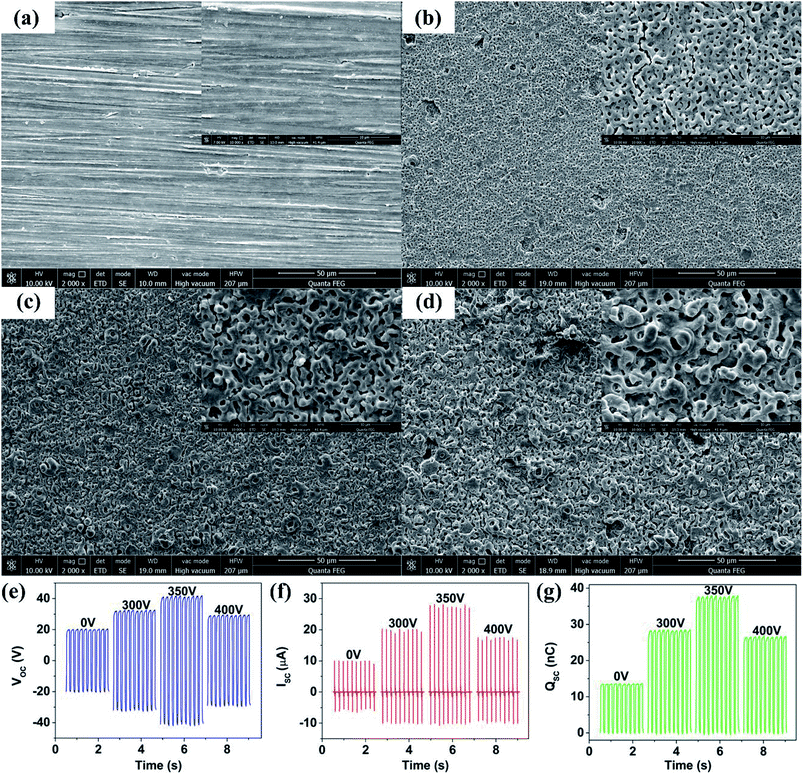 | ||
| Fig. 2 SEM images of the surface of Mg sheets for different MAO voltages: (a) 0 V, (b) 300 V, (c) 350 V, (d) 400 V. The comparison of (e) Voc, (f) Isc, (g) Qsc of TENGs under different MAO voltages. | ||
Effect of different MAO frequencies on the output performance of TENG
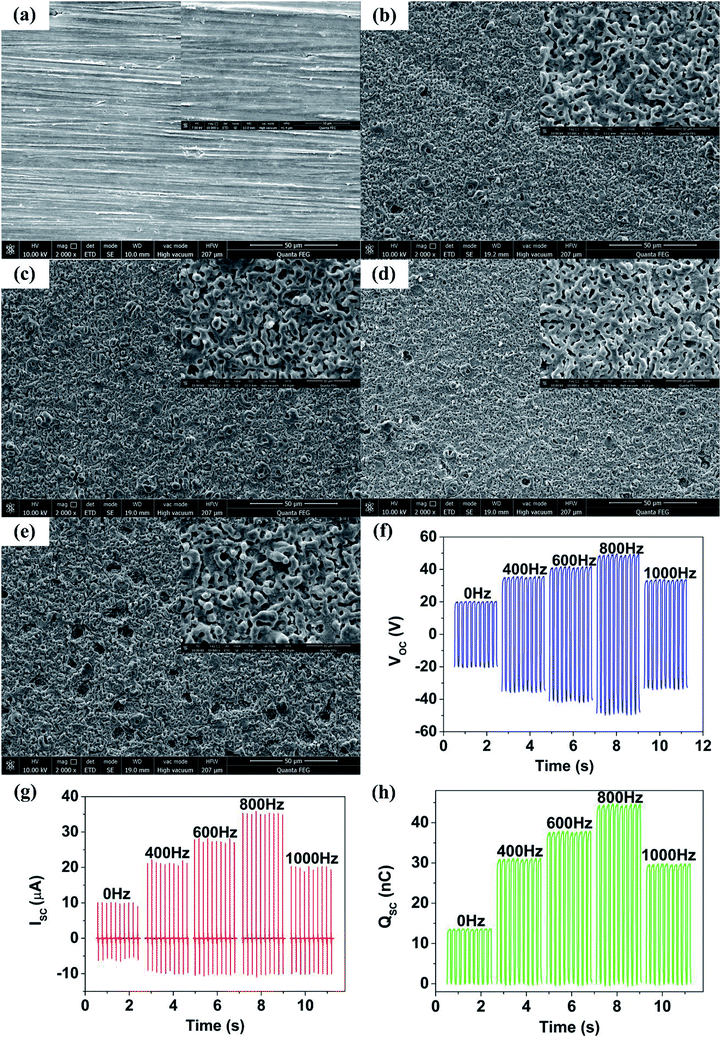
To further explore an optimum output performance of TENG, MAO treatment was performed on Mg sheets at different frequencies of 400 Hz, 600 Hz, 800 Hz and 1000 Hz, respectively. As shown in the SEM images (Fig. 3(a–e)), the size of holes on the oxide layer gradually decreased with the increase of frequency. More dense and uniform holes were formed at a frequency of 800 Hz (Fig. 3(d)) (S1†). However, many large size holes appeared because the frequency was so high (1000 Hz) that the oxide layer was broken through (Fig. 3(e)).23 Fig. 3(f–h) shows the corresponding output performance of TENG fabricated with these MAO-Mg sheets. The output performance of TENG improved as the MAO frequency increased from 0 to 800 Hz, reaching a maximum at 800 Hz. The TENGs' Voc, Isc and Qsc were 48.5 V, 35.3 μA, 44.2 nC respectively, and their numerical values were 2.42, 3.42 and 3.27 times respectively than that of untreated TENG. The output performance of TENG decreased at a frequency of 1000 Hz. This result was mainly due to the change of surface morphology of Mg sheets. First, the film formation was slow and pores were sparse and large when the frequency was low, resulting in a smaller effective contact area between friction layers, which reduced TENGs' output performance. Then, at a high frequency, the film broke down and some large holes appeared, greatly reducing the effective contact area of the friction layer, sharply decreased the output performance of TENG. In addition, the dielectric performance improvement due to the formation of MgO mentioned in the previous section is believed to contribute to the enhancement of the output performance of TENG. In the next experiment, the best MAO conditions of 350 V and 800 Hz were used for the Mg sheets.In vitro simulated immersion test
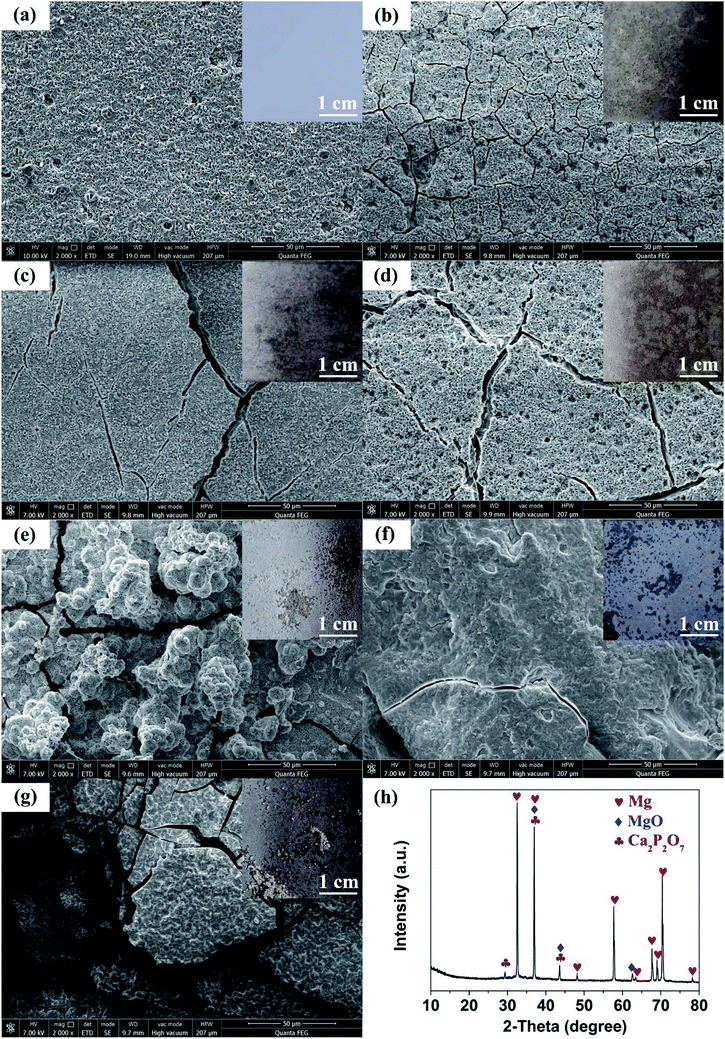
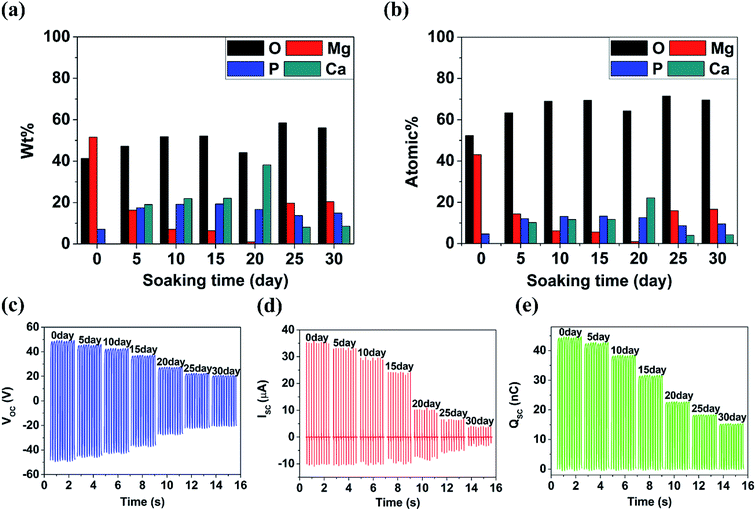
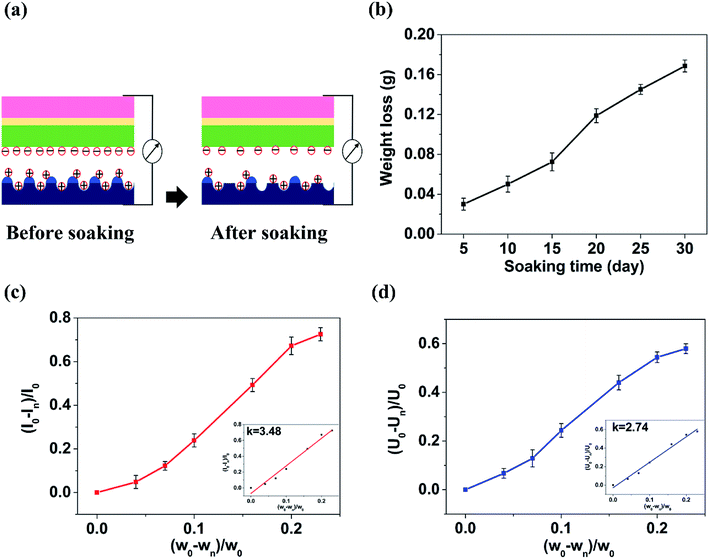
Shown in Fig. 4(a–g) are the SEM images of 350 V–800 Hz MAO-Mg sheets immersed in SBF at 37 °C for 0, 5, 10, 15, 20, 25 and 30 days. It can be seen that some tiny cracks appeared on the surface after immersion for 5 days. As the soaking time extended to 15 days, the cracks on the surface became wider and wider. After immersion for 20 days, a large number of cluster-shaped deposits were formed on the surface, which covered up some cracks but made the surface of the material more uneven. After immersing up to 25 days, it can be seen that a large number of deposits fell off from the surface due to long-term immersion corrosion. After immersion for 30 days, the corrosion was so serious that some corrosion pits appeared on the surface and the Mg matrix was exposed. In addition, it can be seen from the XRD image of the surface after 20 days immersion that Ca and P deposits were generated (Fig. 4(h)). Besides, the EDS analysis (Fig. 5(a and b)) (S2†) shows that the surface of the MAO-Mg sheets was mainly composed of MgO before immersing, and the content of Mg was much higher than P. During 5–20 days of immersion, the content of Mg decreased gradually, whereas the content of Ca and P gradually increased and exceeded Mg, which was most obvious at 20 days of immersion. After a long-term immersion for 25 to 30 days, the material was corroded seriously, resulting in destruction of the film and the exposure of the Mg substrate. So the elemental content on the surface appeared to be opposite to that of the previous period (5–20 days).Fig. 5(c–e) shows that the output performance of TENG decreased gradually after the immersion of MAO-Mg sheets. Before the process of soaking, the Voc, Isc and Qsc of TENG were 48.5 V, 35.32 μA, and 44.2 nC respectively. After soaking for 5 days, the output was measured to be 45 V, 32.8 μA, and 41.8 nC, commensurately lower by 6.7%, 4.86% and 5.42% respectively. With increased soaking time, the output performance of TENG decreased gradually, and the decrease was sharp after soaking over 20 days. When soaking for 30 days, the Voc, Isc and Qsc of TENG were reduced by 57.9%, 72.5%, and 65.9% respectively. This reduction might be caused by two factors, a schematic diagram for which is shown in Fig. 6(a). First, it is well known that the surface structure is important for the output performance of the TENG. As mentioned above, more and more cracks appeared and expanded gradually on the surface of MAO-Mg sheets during the 5–15 days of immersion. In the same period, the Ca and P deposits on the surface gradually increased, reaching their maximum and resulting in a more uneven surface at 20 days. When soaked for 25 to 30 days, the oxide layer on the surface of the MAO-Mg sheets gradually fell off and the Mg matrix was exposed due to the long immersion corrosion time. In total, the effective contact area between the friction layers was reduced in the whole immersion process, causing the decrease of the output performance of TENG. In fact, it decreased slowly from 0 to 15 days and sharply after 20 days, which was consistent with the change trend of surface morphology of MAO-Mg sheets. Therefore it is the most important reason for the reduction of the TENG's performance. Second, surface composition of friction layer can also affect the output performance of TENG. As mentioned above, the surface cracks of MAO-Mg sheets were very small after 5 days immersion, causing little loss of the effective contact area between friction layers. However, the output performance of TENG was reduced obviously. Therefore, we believe that the existence of Ca and P deposits on the triboelectric interface may reduce the difference between MAO-Mg sheets and PDMS films, which further reduced the TENG's performance.
Application of TENG based on MAO-Mg sheets for detecting the corrosion state of MAO-Mg
Fig. 6(b) shows the weight loss curve of the MAO-Mg sheets immersed for different times. The weight loss of MAO-Mg sheets was observed to be small up to 15 days immersion and it gradually increased to 72.42 mg when soaked for 15 days. After 20 days immersion, the weight loss of the MAO-Mg sheets reached 118.69 mg. Then its weight was reduced by 168.6 mg after immersion for 30 days. This result was basically consistent with the change trend of the surface morphology of MAO-Mg sheets and the electrical output performance of TENG prepared by these immersed MAO-Mg sheets. Fig. 6(c) and (d) show the relationship of Isc change rate and Voc change rate of TENG with weight change rate of MAO-Mg sheets after immersion, respectively. The diagram shows that there is a nearly linear relationship between the two parameters. Through linear regression fitting, the relationship between the electrical signals of TENG and the weight change rate of MAO-Mg sheets was as follows (formula (2) and formula (3)):| I = 3.48W | (2) |
| V = 2.74W | (3) |
Here, I, V, and W indicate the change rate of Isc (I = (I0 − In)/I0), Voc (V = (V0 − Vn)/V0), and the weight of MAO-Mg sheets after immersion (W = (w0 − wn)/w0); where subscripts 0 and n denote the initial state and soaking time, respectively. Thus, the corrosion state of MAO-Mg sheets can be estimated by the output signals of TENG based on this linear relationship. This study will lay a foundation in the future for detecting whether Mg has failed or not and for real-time detection of the working state of implantable Mg operating in vivo conditions.
Conclusion
In summary, we have prepared a self-powered triboelectric nanosensor for detecting the corrosion of MAO-Mg. First, Mg sheets as one of the friction layer of TENG were treated with MAO at different voltages and frequencies. It is shown that this treatments can improve the corrosion resistance of Mg and also increase the electrical output performance of TENG. The optimized MAO conditions were obtained at 350 V–800 Hz for 5 min. The corresponding Voc, Isc and Qsc of TENG were 48.5 V, 35.3 μA, and 44.2 nC respectively, which were 2.42, 3.42 and 3.27 times respectively than that of TENG assembled by untreated Mg. The primary improvement of TENG resulted from an oxide film that formed on the surface of Mg sheets, yielding improved dielectric properties and surface morphology. Additionally, to simulate the corrosion of MAO-Mg sheets in the human body, an in vitro immersion experiment was performed in SBF for 5–30 days. The resulting weight loss of MAO-Mg sheets soaked for different times indicated that their weight decreased slowly during the first 15 days and sharply after 20 days. The corresponding output performance of TENG showed a similar continuous decline due to the influence of the morphology and composition of the surface of MAO-Mg sheets. After 30 days of immersion, the Voc and Isc of TENG decreased by 57.9% and 72.5% respectively, and the weight of MAO-Mg sheet decreased approximately 23%. A nearly linear relationship with the slope of 3.48 and 2.74 was found between the change rate of the Isc and Voc of TENG and the respective weight loss of MAO-Mg sheets. This result confirmed that monitoring the corrosion of MAO-Mg in such devices is feasible. These experiments will help foster a new exploration of TENG in the biomedical field and lay a preliminary foundation for future real-time monitoring of Mg and other implantable materials in vivo.Conflicts of interest
There are no conflicts to declare.Acknowledgements
The authors acknowledge the financial support for this work from two National Natural Science Foundation of China (No. 51871166 and No. 51501129).References
- Z. L. Wang, J. Chen and L. Lin, Energy Environ. Sci., 2015, 8, 2250 RSC.
- H. D. Niu, X. Y. Du and S. Y. Zhao, RSC Adv., 2018, 8, 30661 RSC.
- J. Park, A. Y. Choi and C. J. Lee, RSC Adv., 2017, 7, 54829 RSC.
- M. A. P. Mahmud, J. J. Lee and G. H. Kim, Microelectron. Eng., 2016, 159, 102 CrossRef CAS.
- M. M. Wang, W. Li and C. You, RSC Adv., 2017, 7, 6772 RSC.
- Y. H. Yu and X. D. Wang, Extreme Mech. Lett., 2016, 9, 514 CrossRef.
- W. L. Deng, B. B. Zhang and L. Jin, NANOTECHNOLOGY, 2017, 28, 135401 CrossRef PubMed.
- Q. Wang, M. F. Chen and W. Li, Nano Energy, 2017, 41, 128 CrossRef CAS.
- X. S. Zhang, M. D. Han and B. Meng, Nano Energy, 2015, 11, 304 CrossRef CAS.
- X. D. Yang, J. J. Han and F. Wu, RSC Adv., 2017, 7, 50993 RSC.
- Z. M. Tian, J. He and X. Chen, RSC Adv., 2018, 8, 2950 RSC.
- L. Lin, Y. Xie and S. H. Wang, ACS Nano, 2013, 7, 8266 CrossRef CAS PubMed.
- F. Yi, L. Lin and S. M. Niu, Adv. Funct. Mater., 2014, 24, 7488 CrossRef CAS.
- J. Yang, J. Chen and Y. J. Su, Adv. Mater., 2015, 27, 1316 CrossRef CAS PubMed.
- Z. Li, J. Chen and H. Guo, Adv. Mater., 2016, 28, 2983 CrossRef CAS PubMed.
- Z. L. Li, J. Chen and J. Yang, Energy Environ. Sci., 2015, 8, 887 RSC.
- H. R. Zhu, N. Wang and Y. Xu, Adv. Funct. Mater., 2016, 26, 3029 CrossRef CAS.
- M. Tomozawa, S. Hiromoto and Y. Harada, Surf. Coat. Technol., 2010, 204, 3243 CrossRef CAS.
- J. J. Huang, Y. B. Ren and B. C. Zhang, Chin. J. of Nonferrous Met., 2007, 17, 1465 CAS.
- B. Li, Y. Han and K. Qi, ACS Appl. Mater. Interfaces, 2014, 6, 18258 CrossRef CAS PubMed.
- D. Bian, J. X. Deng and N. Li, ACS Appl. Mater. Interfaces, 2018, 10, 4394 CrossRef CAS PubMed.
- J. Chen, G. Zhu and W. Yang, Adv. Mater., 2013, 25, 6094 CrossRef CAS PubMed.
- L. H. Li, N. T. S. N. Sankara and Y. K. Kim, Surf. Interface Anal., 2013, 46, 7 CrossRef.
- S. J. Park, M. L. Seol and D. Kim, Nano Energy, 2016, 21, 258 CrossRef CAS.
Footnote |
| † Electronic supplementary information (ESI) available. See DOI: 10.1039/c8ra10398d |
| This journal is © The Royal Society of Chemistry 2019 |

