 Open Access Article
Kinetic study on the grain growth of PuO2 nanocrystals†
Daniel Bouëxière,
Karin Popa ,
Olaf Walter
 * and
Marco Cologna
European Commission, DG Joint Research Centre, JRC-Karlsruhe, P. O. Box 2340, 76125 Karlsruhe, Germany. E-mail: olaf.walter@ec.europa.eu
First published on 25th February 2019
Abstract
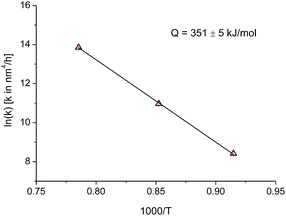
Kinetic measurements on the grain growth of PuO2 nano-crystals are presented. On the basis of isothermal XRD measurements at temperatures of 820 °C, 900 °C, 1000 °C, and 1100 °C the activation energy for the crystallite growth of PuO2 nanopowder is determined as 351(5) kJ mol−1 in the temperature range from 820 to 1000 °C. Modelling shows that in this T range growth happens likely through surface diffusion.
1 Introduction
The standard fuel for current commercial nuclear reactors is based on actinide dioxides: UO2 or UO2–PuO2 mixed oxides (MOX). The properties of actinide dioxide nanocrystals are of interest for various stages of the nuclear fuel cycle. For example, nanostructures of actinide dioxides are formed in the high burn-up structure of spent fuel.1 During the past ten years, the Joint Research Centre (JRC) has built-up expertise in the formation and characterisation of actinide dioxide nano-particles.1–6 More recently the actinide oxalates were used as the starting material for the synthesis of actinide dioxide nanopowders via thermal treatment.7–10 The oxalate route offers several advantages: it is often applied in the nuclear fuel cycle and therefore is state of the art in separation,11 recycling of the actinide ions,12 fuel production13 or the reprocessing of spent fuel.14,15 The main differences between the wet and the dry oxalate decomposition are the lower temperature and the formation of spherical particles for the wet oxalate decomposition,8–10 whereas the powders resulting from the dry decomposition maintain the platelet shape of the original oxalate.7 The bulk modulus of spherical UO2 nano-particles obtained by thermal decomposition of inorganic media2 was measured to be 50% lower compared to the bulk.16 The nanometric dimension of the particles enables as well to follow the growth of the crystallite as a function of the temperature by high-temperature X-ray diffraction (HT-XRD). So it was found that the crystallite growth rate of AnO2 powders increases in the order Th, Np, Pu, U, suggesting that the sintering ability should follow the same trend.10 A quantitative model was not obtained yet. Here we will close this knowledge gap by presenting for the first time kinetic data on the crystallite size growth of nano-sized PuO2 powders. The data are interpreted with a simplified model, which allows the activation energy determination to 351 kJ mol−1 for the growth of PuO2 nanograins in the temperature range (820–1000 °C).2 Experimental
All work has been carried out in the laboratories of the JRC Karlsruhe licensed for handling plutonium, with respect to the German radioprotection regulations. The heart of the work presented here are high-temperature (HT) XRD measurements performed during isothermal annealing at temperatures of 820 °C, 900 °C, 1000 °C, and 1100 °C.2.1 Synthesis
The nanocrystalline PuO2 powder used in this study has been synthesised using the newly implemented oxalate decomposition method in hot compressed water.8–10 In short, a 0.8 molar (M) PuIV solution in 4 M HNO3 has been directly precipitated with oxalic acid (10% excess) as Pu(C2O4)2·6H2O. The precipitate was washed several times with distilled water in order to remove any trace of nitrate and 100 mg Pu-oxalate hexahydrate were placed in a 10 ml Teflon reactor together with 5 ml distilled water. The hydrothermal decomposition was conducted for 120 h at 95 °C under autogenic pressure (1–2 bar). Powder XRD characterisation was performed on a Bruker D8 diffractometer equipped with a LinxEye position sensitive detector, of which the Rietveld refinement lead to Rprofile of 1.8% and Rweighted of 3.0%. For the results of the Rietveld analyses refer to the ESI; in Fig. S1† is presented the result from the Rietveld analyses of the original PuO2 nano powders. Fig. S2† is the result of the Rietveld analysis of the same PuO2 nano powder on the high temperature Pt sample holder. Fig. S3† shows the diffractogram of sample on the high temperature Pt sample holder at the end of measurements.The Rietveld analysis of the PuO2 obtained by the hydrothermal decomposition of Pu-oxalate hexahydrate confirms the nanometric nature of the PuO2 (cubic fluorite structure, cubic Fm![[3 with combining macron]](https://www.rsc.org/images/entities/char_0033_0304.gif) m (225) space group) with a particle size of 3.7 ± 1.0 nm and a lattice parameter of 5.4042(2) Å (Fig. S1†). The nanocrystals form almost spherical agglomerates with a typical size of 100–200 nm.
m (225) space group) with a particle size of 3.7 ± 1.0 nm and a lattice parameter of 5.4042(2) Å (Fig. S1†). The nanocrystals form almost spherical agglomerates with a typical size of 100–200 nm.
2.2 Microscopic characterisation
Transmission electron microscope (TEM) analyses were performed on a TecnaiG2 (FEI™) 200 kV microscope equipped with field emission gun. The samples for the TEM investigations were prepared by dropping samples suspended in acetone on a TEM grid and evaporating the solvent. Statistical evaluation of the particle size of the initially synthesized PuO2 nano particles revealed a mean size of 2.6 ± 0.5 nm in agreement with the size of 3.7 ± 1.0 nm calculated from the broadening of the XRD peaks.8A Philips XL40 Scanning Electron Microscope (SEM) equipped with Energy Dispersive X-ray Spectroscopy (EDS) was used. The sample grains were deposited on a carbon sticker and covered with carbon to avoid charging.
2.3 High-temperature XRD measurements and calculation of crystallite size
For HT-XRD measurements (up to 1100 °C), all the data were collected under vacuum on a Bruker D8 diffractometer mounted in a Bragg–Brentano configuration with a curved Ge (1,1,1) monochromator, a ceramic copper tube (40 kV, 40 mA), equipped with an Anton Paar HTK 2000 chamber.Two sets of experiments were conducted. First, in order to define the temperature range for the isothermal experiments, a diffractogram with a large 2θ window (20° < 2θ < 120°) was taken in the 500–900 °C range (Fig. 1). Each measurement took 3 hours. On the base of this study, the temperature range for the isothermal annealing was set in the 820–1200 °C interval, in the range 45° < 2θ < 60°, where three diffraction peaks of PuO2 are present. This window was chosen to perform the time dependent measurements on the changes of the line broadening within a reasonable amount of time (36 min). The powder was heated in the HT-XRD device with a rate of 10 °C min−1 to 820 °C, held for 30 h, and successively heated further to 900 °C, 1000 °C, 1100 °C and 1200 °C, following the same measurement procedure.
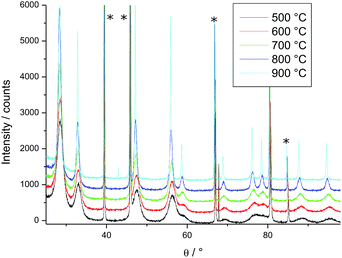 | ||
| Fig. 1 Variation of the XRD patterns of PuO2 as a function of temperature; peaks marked by * arise from the sample holder. | ||
Before performing the high-temperature XRD measurements with a reduced 2θ range, a full diffractogram was taken in the range 20° < 2θ < 120° at room temperature on the Pt sample holder of the HT X-ray diffractometer. A Rietveld refinement (Highscore plus) was performed, leading to Rprofile of 6.5% and Rweighted of 9.0% based on two phases (the Pt sample holder and PuO2, more details see ESI, Fig. S2†). A diffractogram under identical conditions was registered at the end of the series of the measurement showing clearly the changes in the particle size (Fig. S3, ESI†).
However, the crystallite size (D) during the high temperature isotherms were calculated as the average from the three peaks appearing in the range 45° < 2θ < 60° after profile fitting by measuring independently the line broadening at half the maximum intensity (FWHM) for each Bragg angle and the applying the Scherrer equation (Eq. (1)):
 | (1) |
Eqn (1) assumes that the broadening of the diffraction peaks is contributed by grain size only. In reality, other factors could affect the breadth of a diffraction peak as well, e.g. the internal strain of the grains could cause peak broadening. These effects are neglected in our approximation here.
2.4 Grain growth model
The kinetics of growth of the crystallites was modelled according to the classical grain growth model for porous single phase systems eqn (2).17| Dn = D0n + kt | (2) |
 | (3) |
3 Results and discussions
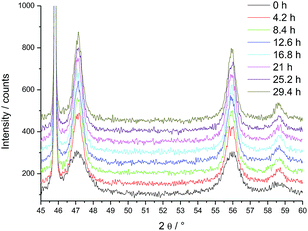
PuO2 nano-crystals were prepared via hydrothermal decomposition of Pu-oxalate in water at 95 °C over 4 days.8 In a first experiment we studied the changes of the crystallite size as a function of the temperature (Fig. 1); the sharpening of the diffraction peaks reflects the particle growth with increasing temperature. Since crystallite growth is significant only above 800 °C, longer term isothermal XRD measurements were performed in the 820–1200 °C interval. The change of the diffraction patterns over time is shown in Fig. 2 at the example of the measurement at 820 °C (where the changes are minor). Over time a sharpening of the peaks is observed.We calculated the crystallite size on the basis of the three observed peaks in the window 45° < 2θ < 60° (Table 1, Fig. 2). Since there is some growth during the acquisition period (36 min), the reported values are an average of the size during the acquisition interval.
| Time (min) | Crystallite size (nm) | |||
|---|---|---|---|---|
| 820 °C | 900 °C | 1000 °C | 1100 °C | |
| 36 | 9.4 | 19.5 | 34.5 | 83.6 |
| 72 | 10.1 | 21.2 | 38.4 | 90.2 |
| 108 | 11.2 | 22.3 | 40.2 | 97.7 |
| 144 | 11.5 | 23.3 | 43.3 | 107.3 |
| 180 | 12.0 | 45.6 | 113.0 | |
| 216 | 11.8 | 24.1 | 46.3 | 119.7 |
| 252 | 12.3 | 24.4 | 48.3 | 127.2 |
| 288 | 13.1 | 24.8 | 48.9 | 131.4 |
| 324 | 12.8 | 25.2 | 49.8 | 137.2 |
| 360 | 25.7 | 50.7 | 142.5 | |
A modified Williamson–Hall method was applied to quantify the dislocation density in order to measure the grain growth kinetics for nanocrystalline UO2 in both in situ and ex situ experiments.18,19 However, due to experimental limitations in our case the internal strain influence is neglected in our model.
Comparison of the TEM analysis of the original small nano-particles to its SEM picture of the same material after thermal treatment at 1200 °C for 30 h clearly shows the particles having grown significantly in size from 3.7 ± 1 nm into the micrometer scale (Fig. 3).
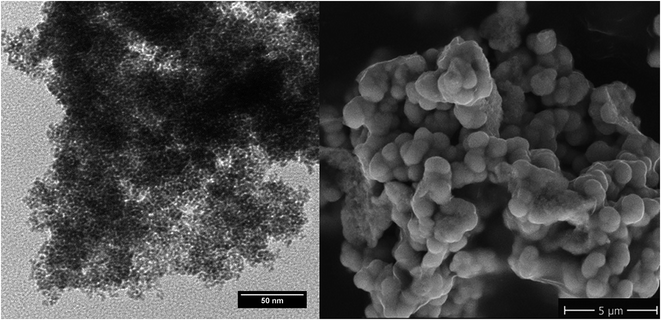 | ||
| Fig. 3 TEM of the original nanopowder (left) and SEM of powder annealed at 1200 °C for 30 h (right). | ||
It is seen that at constant temperature T the crystallite size increases (Table 1, Fig. 4). The data were fitted with eqn (1) to obtain the grain growth rate constant k as a function of temperature, and the growth exponent n. Given the very fast grain growth rate of nanocrystalline powders, and the time needed for acquisition of a full XRD spectrum (36 minutes), the initial crystallite size at time zero could not be measured. D0 was thus defined as the first available data point, i.e. at 36 min after the beginning of the isotherm. The choice of the exponent n is of critical importance, as it affects greatly the kinetic constant and the activation energy.20 In order to determine the exponent n, eqn (2) can be rewritten as:
| Dn − D0n = kt | (4) |
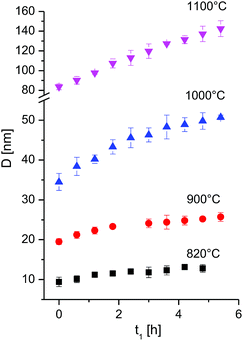 | ||
| Fig. 4 Crystallite size as a function of time at different isothermal temperatures for the first 6 h. The full time interval is given in Fig. S5.† | ||
By plotting the left side of the equation (eqn (3)) versus the time a linear trend is to be expected. The exponent n was chosen as the one giving the best linear fit, by limiting n in the range n = 2 to 4. The data between 820 °C and 1000 °C are best fitted with an exponent n = 4 or higher, while the data at 1100 °C give an exponent n of 2 (ESI, Fig. S4†). The role of the exponent n and its relevance is discussed later here in more detail.
Only data within the first 6 hours were found to fit eqn (4) well, whereas, during longer-term annealing, crystallite growth proceeds with a slower kinetic. A similar behaviour was however observed by Miao et al.18 for the growth of nanograined UO2 at 820 °C and 730 °C, and was explained with the grain-growth stagnation mechanism by proposed by Holm.21 According to this model, a small fraction of slowly moving grain boundaries can effectively pin the faster moving boundaries, and an increase in the temperature is needed for the transition of grain boundaries from low-mobility to the high mobility fraction.
The slope of the linear regression gives the grain growth constant k, reported in Table 2, together with the results of the linear fitting.
| Temperature | D0 [nm] | n | k [nmn h−1] | R2 |
|---|---|---|---|---|
| a Standard deviation in parentheses. | ||||
| 820 °C | 9.4 | 4 | 4500(250) | 0.976 |
| 900 °C | 19.5 | 4 | 57![[thin space (1/6-em)]](https://www.rsc.org/images/entities/char_2009.gif) 500(2500) 500(2500) |
0.983 |
| 1000 °C | 34.5 | 4 | 1![[thin space (1/6-em)]](https://www.rsc.org/images/entities/char_2009.gif) 028 028![[thin space (1/6-em)]](https://www.rsc.org/images/entities/char_2009.gif) 000(25 000(25![[thin space (1/6-em)]](https://www.rsc.org/images/entities/char_2009.gif) 000) 000) |
0.994 |
| 1100 °C | 83.6 | 2 | 2460(20) | 0.999 |
Since the data at temperatures of 820 °C, 900 °C, and 1000 °C have the same growth exponent n, the activation energy can be deduced by plotting the logarithm of k as a function of the inverse absolute temperature (Fig. 5). The activation energy for the crystallite growth of nanocrystalline PuO2 powder in this temperature range was calculated as 351(5) kJ mol−1. This value compares well with the activation energy of 387 kJ mol−1 for the grain growth of UO2 and PuO2–UO2 MOX, used in the TRANSURANUS fuel performance code,23 which also assumes a growth model with an exponent n of 4. Data for the activation energy for grain growth in PuO2 in powder or bulk were not reported previously.
On the other side the present experiments do not confirm the low activation energy reported in few cases in the literature for the growth of nanocrystalline powder. It has been reported that grain growth in nanocrystalline powders occurs with a reduced activation energy compared to grain growth at a larger scale. For example the activation energy for grain growth in yttria stabilized zirconia nanocrystalline powders was reported to be as low as 13 kJ mol−1 (to be compared to 580 kJ mol−1 reported for larger grain zirconia).24 In the current case the activation energy for grain growth in PuO2 nanocrystal does not appear to be in order of magnitude lower than what could be expected for larger sizes (whereas as discussed data of grain growth in conventional size are lacking). It is important to note that in24 the crystallite data were assumed to have a linear dependency from time (n = 1), which can lead to a significant underestimation of the activation energy. A discussion on the importance of the selection of the exponent n on the activation energy is given for example in.20
The data allow also for some speculation on the nature of the activation energy derived in the present analysis. According to the Brook model,22 in a pure system, an exponent of n = 2 describes the growth of grain in a dense system. On the other hand, an exponent of n higher than 2 in a pure systems represents the growth of grains in the presence of porosity, where the grains are pinned by the pores and thus the mobility of the pores is the rate controlling mechanism (pore controlled kinetics). According to this model, an exponent n with a value of 4 is observed in systems where pore mobility is controlled by surface diffusion. If this interpretation is accepted, then the calculated activation energy should represent the activation energy for pore mobility governed by surface diffusion. In ionic solids the charge balance requires diffusion of both cations and anions and the rate is limited by the slowest moving specie, being Pu for PuO2. The activation energy for growth of PuO2 nanocrystals should thus represent also the activation energy for surface diffusion of Pu in PuO2. For comparison, a reliable value for the surface diffusion of Pu in PuO2 could not be found in the literature.
Limited data exist for the activation energy of U diffusion in UO2. For example Matzke recommended a value of 453 kJ mol−1.25 This value seems to be high, as the activation energy for surface diffusion is typically lower than the one for grain boundary and volume diffusion. More recent molecular dynamic simulations give a value of the diffusion of U cations on the surface of UO2 nanocrystals of 299 to 347 kJ mol−1.26 A study of UO2 and PuO2 interdiffusion gives a value of 222 kJ mol−1, assumed to largely due to surface diffusion.27
The method we have applied here has some intrinsic limitations that may affect the accuracy of the data. The main limitations are of experimental nature, e.g. the need to a fast acquisition time in a short angle range, which limits the applicability of accurate profile analysis, and the choice of the model parameters, above all the time exponent n. It is difficult to assign a precise significance to the exponent n,20,22 for various reasons: (i) the exponent n might not be an integer as several mechanisms might be concurring, (ii) several values of n could fit with the data with good correlation coefficients, (iii) the data could be fitted also with exponents higher than 4, (iv) the model has been developed for particles separated by nearly spherical isolated pores at the grain boundary, which can differ significantly from the real case.
4 Conclusions
Here for the first time data on the kinetics of the particle growth of PuO2 are reported; the activation energy is determined to 351(5) kJ mol−1 in agreement with data reported for UO2 and MOX. This first result could represent a preliminary valuable reference for the development of advanced fuel performance code for PuO2 and MOX.According to the data on the grain growth of PuO2 nanocrystals presented here, particle growth proceeds by a pore controlled kinetics mechanism via surface diffusion as long as the particles are small or at low temperature (<50 nm, with a growth exponent n = 4). At T = 1100 °C (when small particles have already agglomerated) the growth mechanism changes to the mechanism of dense material (with n = 2). However, the change of the exponent at 1100 °C might as well be addressed to the fact that at this temperature the grain size starts to become comparable to the size of the agglomerates, so that further growth is hindered.
Conflicts of interest
The authors declare no conflict of interest.Acknowledgements
The authors gratefully acknowledge Oliver Dieste Blanco and Bert Cremer for the microscopic characterisation of the samples. This work was funded by the European Commission, DG JRC and contributes to the Joint Programme on Nuclear Materials (JPNM) of the European Energy Research Alliance (EERA).Notes and references
- R. Jovani-Abril, R. Eloirdi, D. Bouëxière, R. Malmbeck and J. Spino, J. Mater. Sci., 2011, 46, 5 Search PubMed.
- D. Hudry, C. Apostolidis, O. Walter, T. Gouder, E. Courtois, C. Kübel and D. Meyer, Chem.–Eur. J., 2012, 18, 8283 CrossRef CAS PubMed.
- D. Hudry, C. Apostolidis, O. Walter, T. Gouder, A. Janssen, E. Courtois, C. Kübel and D. Meyer, RSC Adv., 2013, 3, 18271 RSC.
- D. Hudry, C. Apostolidis, O. Walter, T. Gouder, E. Courtois, C. Kübel and D. Meyer, Chem.–Eur. J., 2013, 19, 5297 CrossRef CAS PubMed.
- D. Hudry, C. Apostolidis, O. Walter, A. Janßen, D. Manara, J. C. Griveau, E. Colineau, T. Vitova, T. Prüßmann, D. Wang, C. Kübel and D. Meyer, Chem.–Eur. J., 2014, 20, 10431 CrossRef CAS PubMed.
- R. Jovani-Abril, M. Gibilaro, A. Janßen, R. Eloirdi, J. Somers, J. Spino and R. Malmbeck, J. Mater. Sci., 2016, 477, 298 CAS.
- V. Tyrpekl, J. F. Vigier, D. Manara, T. Wiss, O. Dieste Blanco and J. Somers, J. Nucl. Mater., 2015, 460, 200 CrossRef CAS.
- O. Walter, K. Popa and O. Dieste Blanco, Open Chem., 2016, 14, 170 CAS.
- L. Balice, D. Bouëxière, M. Cologna, A. Cambriani, J.-F. Vigier, E. De Bona, D. G. Sorarù, C. Kübel, O. Walter and K. Popa, J. Nucl. Mater., 2018, 498, 307 CrossRef CAS.
- K. Popa, O. Walter, O. Dieste Blanco, A. Guiot, D. Bouëxière, J.-Y. Colle, L. Martel, M. Naji and D. Manara, CrystEngComm, 2018, 20, 4614 RSC.
- N. Vaida and C.-K. Kim, J. Radioanal. Nucl. Chem., 2010, 284, 341 CrossRef.
- N. Xu, D. Gallimore, E. Lujan, K. Garduno, L. Walker, F. Taylor, P. Thompson and L. Tandon, J. Radioanal. Nucl. Chem., 2016, 307, 1203 CrossRef CAS.
- B. Arab-Chapelet, P. M. Martin, S. Costenoble, T. Delahaye, A. C. Scheinost, S. Grandjean and F. Abraham, Dalton Trans., 2016, 45, 6909 RSC.
- R. Taylor, Reprocessing and recycling of spent nuclear fuel, Woodhead Publishing, 2015 Search PubMed.
- P. Govindan, A. Palamalai, K. S. Vijayan, M. Raja, S. Parthasarathy, S. V. Mohan and R. V. Subba Rao, J. Radioanal. Nucl. Chem., 2000, 246, 441 CrossRef CAS.
- C. E. Zvoriste-Walters, S. Heathman, R. Jovani-Abril, J. L. Spino, A. Janssen and R. Caciuffo, J. Nucl. Mater., 2013, 435, 123 CrossRef CAS.
- M. N. Rahaman, Ceramic Processing and Sintering, 2nd edn, Taylor and Francis, 2003, p. 602 Search PubMed.
- Y. Miao, T. Yao, J. Lian, J.-S. Park, J. Almer, S. Bhattacharya, A. M. Yacout and K. Mo, Scr. Mater., 2017, 131, 29 CrossRef CAS.
- T. Yao, K. Mo, D. Yun, S. Nanda, A. M. Yacout and J. Lian, J. Am. Ceram. Soc., 2017, 100, 2651 CrossRef CAS.
- L. Bourgeois, Ph. Dehaudt and C. Lemaignan, J. Nucl. Mater., 2001, 295, 73 CrossRef CAS.
- E. A. Holm and S. M. Foiles, Science, 2010, 328, 1138 CrossRef CAS PubMed.
- R. J. Brook, Treatise on materials science and technology, ed. F. J.Wang, 1976, vol. 9, pp. 331–363 Search PubMed.
- P. Van Uffelen, P. Botazzoli, L. Luzzi, S. Bremier, A. Schubert, P. Raison, R. Eloirdi and M. A. Barker, J. Nucl. Mater., 2013, 434, 287 CrossRef CAS.
- S. Shukla, S. Seal, R. Vij and S. Bandyopadhyay, Nano Lett., 2003, 3, 397 CrossRef CAS.
- H.-J. Matzke, J. Chem. Soc., Faraday Trans., 1990, 86, 1243 RSC.
- A. S. Boyarchenkov, S. I. Potashnikov, K. A. Nekrasov and A. Ya Kupryazhkin, J. Nucl. Mater., 2013, 442, 148 CrossRef CAS.
- R. Verma and P. R. Roy, Proceedings of the symposium on surface and interface properties in materials science [held at] Roorkee, October 13–15, 1980 Search PubMed.
Footnote |
| † Electronic supplementary information (ESI) available. See DOI: 10.1039/c8ra10430a |
| This journal is © The Royal Society of Chemistry 2019 |

