 Open Access Article
Inhibition of G9a promoted 5-fluorouracil (5-FU) induced gastric cancer cell apoptosis via ROS/JNK signaling pathway in vitro and in vivo
Haizhou Lou†
a,
Hongming Pan†a,
Zhijian Huangb,
Zonglin Wangc and
Dimin Wang *c
*c
aDepartment of Medical Oncology, Sir Run Run Shaw Hospital, School of Medicine, Zhejiang University, Hangzhou, China
bDepartment of Abdominal Surgery, Fujian Cancer Hospital, Fujian Medical University Cancer Hospital, Fuzhou, Fujian, China
cCollege of Basic Medical Sciences, Second Military Medical University, Shanghai, China. E-mail: deane14@163.com
First published on 10th May 2019
Abstract
A histone methyltransferase G9a, encoded by euchromatic histone-lysine N-methyltransferase 2 (EHMT2), is up-regulated in various cancers, and is involved in their poor prognosis. In the study reported here, the abnormal expression of G9a in gastric cancer it was investigated in vitro and in vivo. Furthermore, the expression of G9a was revealed to have a negative correlation with chemotherapy response in gastric cancer patients. Next, the effect of G9a knockdown on fluorouracil (5-FU) induced cell apoptosis in gastric cancer cells was focused on. The results demonstrated that G9a knockdown significantly activated the expression level of phospho c-Jun N-terminal kinase (p-JNK) and increased the intracellular reactive oxygen species (ROS) levels in the gastric cancer cells. Inhibition of the ROS/JNK signaling partial reversed the effect of G9a knockdown on 5-FU treated gastric cancer cells. Down-regulation of G9a enhanced the sensitivity of 5-FU to the gastric cancer cells in vitro and in vivo, which was involved in the activation of the ROS/JNK signaling pathway. These results demonstrated that G9a could play a critical role in the sensitivity of chemotherapy for gastric cancer and might be a novel method for treating gastric cancer in the clinic.
1. Introduction
Gastric cancer (GC) is one of the most common cancers in the world.1 Gastric cancer has a particularly high incidence in Asian countries including China and Japan, which causes a serious public health problem and an economic burden both in the developed and developing countries.2,3 Because of the absence of specific symptoms and early detection, GC is often diagnosed at an advanced stage and the prognosis remains unfavorable.4 Although recent reports have revealed effective methods in the diagnosis and therapy of gastric cancer, the incidence and mortality of gastric cancer have not apparently declined.5 Nowadays, surgery remains the first consideration as a potentially curative treatment for GC. Nevertheless, more than half the patients treated may still develop a recurrence after curative resection and the five-year survival rate of the patients is still poor.6 Thus, a better understanding of the underlying molecular mechanism and a new effective therapeutic treatment are urgently needed.The 5-fluorouracil (5-FU) chemotherapy has become the standard regimen for GC patients in the past 30 years.7 However, the acquired resistance to 5-FU chemotherapy still affects GC patients for decades.8 Thus, a novel method of enhancing 5-FU chemotherapy sensitivity for GC needs urgent investigation. A nuclear histone lysine methyltransferase, G9a, has the function of catalyzing the mono- and dimethylation of histone H3 lysine 9 (H3K9), which shows a reversible modification associated with the suppression of the transcriptional genes.9 The G9a can regulate gene expression by interacting with other transcription factors, which play an important role in cancer-sustaining cellular activities, including cell proliferation, autophagy, EMT, metabolic changes, specific responses to hypoxia and cancer stemness.10–12 An early study showed that G9a was essential for early embryogenesis.13 Recent findings indicated that G9a was up-regulated in several malignancies, such as lung cancer, brain cancer, GC and ovarian carcinoma and its overexpression was correlated with poor prognosis of the cancer patients.14 A previous study revealed that down-regulation of G9a accumulated intracellular reactive oxygen species (ROS) and induced autophagy-mediated cell death in McF-7 cells (breast adenocarcinoma).11 However, the effect of G9a on 5-FU sensitivity and the detailed molecular mechanism in GC remains unknown. In the study reported in this paper, the expression of G9a and its correlation with chemotherapy response in gastric cancer was evaluated. Furthermore, the mechanism of G9a knockdown mediating 5-FU induced cell apoptosis in GC cells was also focused on. In addition, the potential effect of G9a on intracellular ROS levels and mitogen-activated protein kinase (MAPK) activation were also investigated in the GC cells. This study found a probable mechanism of G9a knockdown mediating the sensitivity of 5-FU to GC cells, and might provide a new method for treating GC in the clinic.
2. Materials and methods
2.1 Patients and pathological data
The methods used in this study complied with Institutional Review Board (China) guidelines and were approved by the ethics committee of Suining Central Hospital (Approval No.: 2016-035). The patients received the necessary information concerning the study, and consent was obtained. Ninety patients with GC receiving chemotherapy were included. The chemotherapeutic responses were classified according to the RECIST guidelines, version 1.0,15 into the following categories: complete response: disappearance of all target lesions for at least four weeks, partial response: a decline of at least 30% in the diameters of the target lesions for at least four weeks, stable disease: neither partial response nor progressive disease, and progressive disease: at least a 20% increase in the sum of all the diameters of the target lesions from the smallest size.2.2 Immunohistochemistry
Tumor sections were dewaxed in xylene and rehydrated in a graded series of ethanol, followed by antigen retrieval with 0.01 M sodium citrate buffer (pH 6.0). Immunohistochemical staining was carried out using the primary antibody against G9a (Cell Signaling Technology, Beverly, MA, USA), followed by treatment with the secondary detection antibody. Then the cells were washed three times with phosphate buffered saline (PBS), the staining was detected using 3,3′-diaminobenzidine solution. The negative control was immunoglobulin G and it was used as a substitute for the primary antibody.2.3 Score of immunohistochemistry
Immunoreactive staining of G9a was characterized quantitatively according to the percentage of positive cells and staining intensity as previously described.16 The intensity was scored as 0, 1, 2, or 3. The percentages of the stained cells were divided into five levels: 0 (0%), 1 (1–25%), 2 (26–50%), or 3 (51–75%). The final score was calculated by the intensity × the percentages of the stained cells, ranging from 0 to 12. The patients were sub-divided into two categories according to final scores: low expression (0–4) and high expression (5–12). The results were determined independently by two researchers.2.4 Cell culture
Human GC cells including BGC-823, NCI-N87, SGC7901 and MKN-45, and gastric epithelial cell GES-1, were acquired from Shanghai Institute for Life Science, and grown in a dish using Roswell Park Memorial Institute 1640 medium (RPMI-1640) with 10% fetal bovine serum (Gibco, Carlsbad, CA, USA) at 37 °C in a humidified atmosphere of 5% carbon dioxide.2.5 Transfection of siRNA
The NCI-N87 cells were transfected with the small interfering RNA (siRNA) using Lipofectamine RNAi-MAX (Invitrogen), according to the manufacturer's protocols. The SiRNA (AGAAGAAUUC AAGAGAUUCCGGAGG) against human G9a and non-target siRNA sequence 5′-TTCTCCGAACGTGTCACGT-3′ were designed and obtained commercially (GenePharma Technologies, Shanghai, China). The effect of the siRNA on the suppression of G9a expression was validated 48 h after transfection.2.6 Quantitative reverse transcription polymerase chain reaction (qRT-PCR)
The total RNA was extracted using the RNA isolation kit (Takara Bio, Inc.) according to the manufacturer's protocol. Expression of G9a was evaluated using qRT-PCR kits (Takara Bio, Inc.) The results were evaluated in triplicate using the SYBR green quantitative polymerase chain reaction (PCR) master mix (Fermentas). The primers were as follows: G9a: forward 5′-GGAGCCACGAGGGGTGTCCA-3′, reverse 5′-CGGCATTGCAGCCTGACAGC-3′; glyceraldehyde 3-phosphate dehydrogenase (GAPDH), forward 5′-ACAGTCAGCCGCATCTTCTT-3′, reverse 5′-GACAAGCTTCCCGTTCTCAG-3′. Gene expression results were calculated relative to GAPDH for each sample.2.7 Western blot
Western blot analysis was performed using the following primary antibodies as previously described,17 anti-G9a, anti-phospho c-Jun N-terminal kinase (anti-p-JNK), anti-JNK anti-p-P38, anti-p-ERK anti-H3K9me2, anti-cleaved poly(ADP-ribose) polymerase 1 (PARP1), anti-cleaved caspase-8 and GAPDH (Cell Signaling Technology).2.8 Cell proliferation assay
The cell proliferation assay was used to evaluate cell viability using Cell Counting Kit-8 (CCK-8) according to the manufacturer's instructions. Briefly, cells were incubated in 96-well plates in triplicate. After 24 h, the cells were treated with 10 μl of CCK-8 solution for 2 h at 37 °C. The absorbance was measured at 450 nm using a Gen5 microplate reader (BioTek, USA).2.9 Apoptosis assay
The apoptosis assay was performed using an apoptosis detection kit (BioLegend, CA, USA) according to the manufacturer's instructions. Cells were treated with the indicated reagents after a certain period of time, and stained with 5 μg ml−1 7-aminoactinomycin D (7-AAD) and 2.5 μg ml−1 annexin V-fluorescein isothiocyanate (FITC), and then examined using flow cytometry on a FACSCalibur (BD Biosciences, CA, USA). The data were quantitated using FlowJo software (Tree Star, OR, USA).2.10 Determination of intracellular reactive oxygen species production
An oxidation sensitive fluorescent probe, 2′,7′-dichlorofluorescin diacetate (DCFH-DA, product number: D6665, Sigma-Aldrich, MO, USA) method was used to measure the formation of ROS. Cells were treated with N-acetylcysteine (NAC) followed by treatment with 5-FU and siG9a, then incubated with 200 μl DCFH-DA (10 μM) at 37 °C in the dark for 30 min. Intracellular ROS formation was measured using DCFH-DA with a method previously described for the DCF-DA microplate assay. A SFM 25 spectrofluorometer (Kontron Instruments, Germany) was used to determine the ROS production by measuring the fluorescence intensity of 10![[thin space (1/6-em)]](https://www.rsc.org/images/entities/char_2009.gif) 000 cells in each well at an excitation wavelength of 495 nm and an emission wavelength of 530 nm. Then the fluorescence intensity of the stimulated cultures was set at 100% after subtracting the corresponding blanks to calculate the relative intensities of DCF fluorescence.
000 cells in each well at an excitation wavelength of 495 nm and an emission wavelength of 530 nm. Then the fluorescence intensity of the stimulated cultures was set at 100% after subtracting the corresponding blanks to calculate the relative intensities of DCF fluorescence.
2.11 Animals
Female BALB/c nude mice (4–6 weeks old) were provided by the Animal Center of the Second Military Medical University (No. 201726558). All animals were kept on a standard laboratory diet and water ad libitum. The protocols of animal use and care conformed to the Guide for the Care and Use of Laboratory Animals from the National Institutes of Health, and all the experimental protocols described in this study were approved by the Animal Care Committee of the Second Military Medical University. Thirty-five nude mice bearing NCI-N87 tumor xenografts were randomly divided into five groups: control, NC, siG9a, 5-FU, siG9a + 5-FU. The tumor volume of all the groups was measured on days: 5, 10, 15 and 20.2.12 TUNEL assay
Apoptosis detection was performed using a TUNEL Assay Kit (Beyotime, Beijing, China) according to the manufacturer's instructions. In brief, paraffin embedded slides were deparaffinized with xylene and ethanol and the cells were rehydrated using proteinase K. After several washes with PBS, sections were incubated with the freshly prepared TUNEL reaction mixture for 1 h at 37 °C in a moist chamber. Apoptotic cells on the slides were observed in randomly chosen fields, under an Olympus light microscope (Olympus, Tokyo, Japan).2.13 Statistical analysis
The data were calculated as the mean ± standard deviation using results from three independent experiments. The differences between the two groups were compared using the Student's t-test or a one-way analysis of variance (ANOVA) with Dunnett's test. The patients' survival curve was generated using the Kaplan–Meier method with the log rank test. All the results were analyzed using SPSS 14.0 software (SPSS Inc., Chicago, IL). A P-value < 0.05 was statistically significant.3. Results
3.1 The effect of expression of G9a on up-regulation in gastric cancer tissues
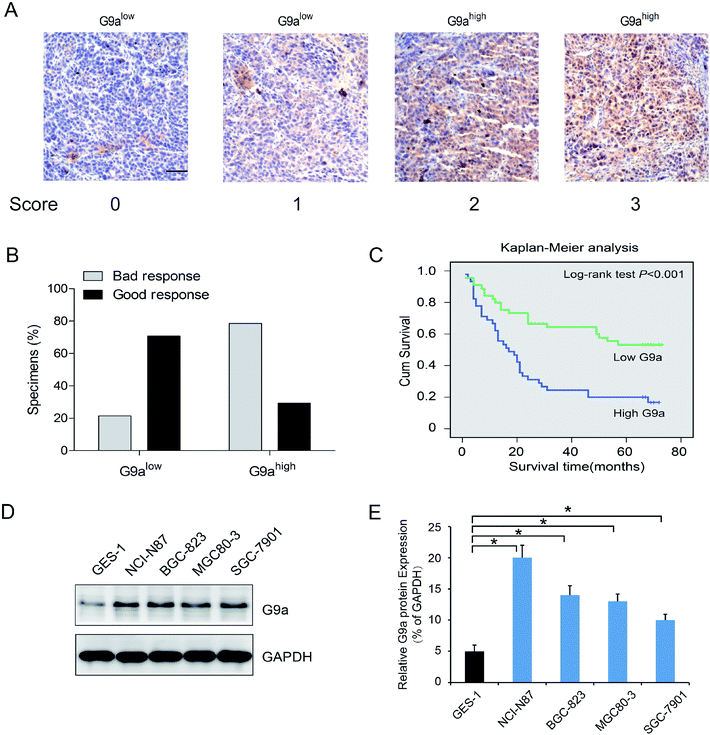
To investigate the effect of G9a expression on the chemotherapeutic response in GC, 90 surgical resection tumor specimens from GC patients receiving chemotherapy were subjected to immunohistochemistry analysis. Patients were separated into two groups containing tissues expressing low levels of G9a (score 0 and 1, Fig. 1A) and tissues expressing high levels of G9a (score 2 and 3, Fig. 1A). The chemotherapeutic response was defined on the basis of major changes in tumor size between pre-chemotherapy and post-chemotherapy, and were classified as good and bad responses. The results showed that patients with high levels of G9a expression (34 specimens) had a worse response to chemotherapy than those with low levels of G9a expression (9 specimens), which suggested that there was a negative correlation between the expression of G9a and the GC patients' response to chemotherapy (Fig. 1B). To further elucidate the clinical relevance of G9a in GC chemotherapy, the Kaplan–Meier method was used. The results showed that high expression levels of G9a were correlated with a poor survival for the GC patients (Fig. 1C). Furthermore, the four cell lines of GC demonstrated a significantly increased expression of G9a when compared with the GES-1 control cells. Out of the cell lines, the NCI-N87 cells showed the highest expression of G9a compared to the other three cell lines (Fig. 1D). These results suggested that the expression of G9a was up-regulated in GC.3.2 Effect of knockdown of G9a on 5-FU induced cell apoptosis in GC cells
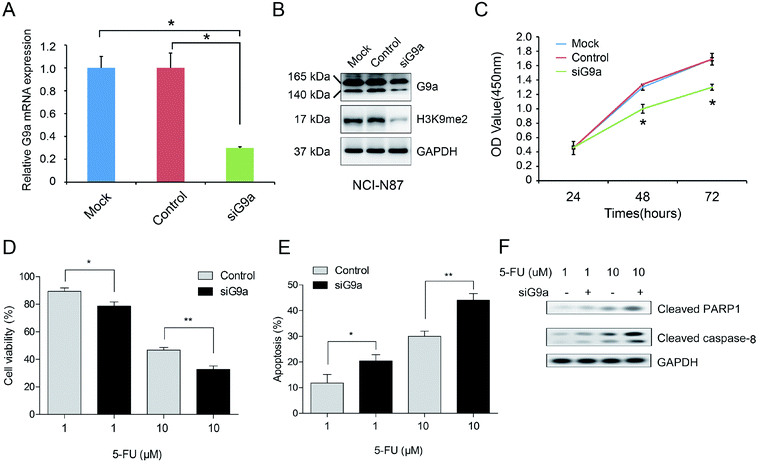
To explore the effect of G9a on GC cells, the cells were treated with G9a siRNA (siG9a). Treatment with siG9a successfully inhibited the expression of G9a in NCI-N87 cells (Fig. 2A and B). The protein expression level of H3K9me2 was inhibited by siG9a transfection in NCI-N87 cells (Fig. 2B). Furthermore, the results of the CCK-8 assays revealed a remarkable inhibition of the cell proliferation after treatment with the siG9a when compared with the control (Fig. 2C). To further investigate the combined effect of siG9a and 5-FU on cell viability, the cells were treated with or without siG9a and different doses of 5-FU. The results showed that compared with treatment using 5-FU alone, siG9a combined with various doses of 5-FU treatment led to a decrease in cell viability in GC cells (Fig. 2D). Subsequently, the effect of G9a knockdown on the cell apoptosis in GC cells were explored following treatment with or without siG9a and different doses of 5-FU. The results of the apoptosis assay demonstrated that the percentage of apoptotic cells in the siG9a treatment group was increased remarkably when compared with the results using the control (Fig. 2E). In addition, the expressions of apoptosis related proteins were detected after down-regulation of G9a. The results demonstrated that the expression levels of cleaved PARP1 and caspase-8 were obviously increased after down-regulation of G9a combined with 5-FU compared with treatment with 5-FU alone (Fig. 2F).3.3 Effect of JNK activation on the knockdown of G9a enhanced cell apoptosis in 5-FU treated GC cells
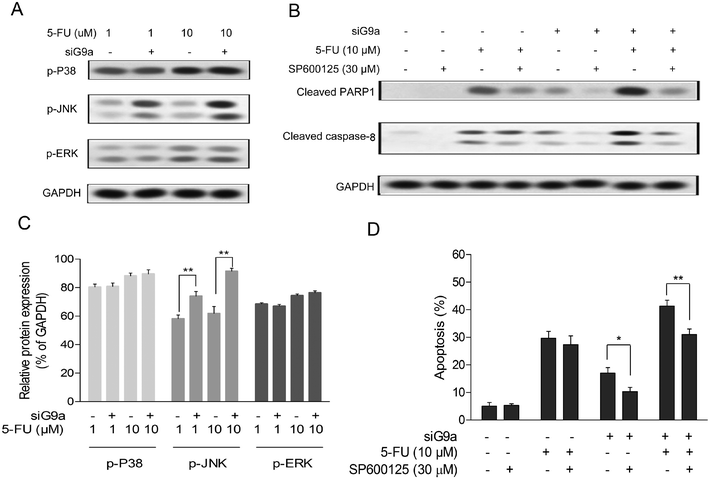
To elucidate the molecular function of siG9a enhanced cell apoptosis of 5-FU in GC cells, the protein expression levels of p-JNK, p-P38 and p-ERK were determined using a Western blot assay with incubation of different concentrations of 5-FU followed by treatment with siG9a. As indicated in Fig. 3A, the protein expression level of p-JNK was obviously increased in the treatment of the siG9a group compared with the control. The relative protein expressions level of p-JNK, but not p-P38 and p-ERK were significantly increased in the treatment of siG9a group compared with the control (Fig. 3C). To confirm whether JNK activation was involved in knockdown of G9a enhanced cell apoptosis induced by 5-FU, cells were treated with or without siG9a and 5-FU in the presence of SP600125 (JNK inhibitor). As illustrated in Fig. 3D, SP600125 treatment effectively suppressed the cell apoptosis after the treatment of cells with siG9a followed by treatment with or without 5-FU. However, SP600125 treatment did not change the cell apoptosis significantly in the treatment with 5-FU alone. The expression levels of cleaved PARP1 and caspase-8 were consistently (and obviously) decreased after down-regulation of G9a combined with or without 5-FU in the presence of SP600125, but where not changed in the 5-FU and SP600125 treatment group (Fig. 3B).3.4 The involvement of ROS triggered JNK in siG9a enhanced cell apoptosis in 5-FU treated GC cells
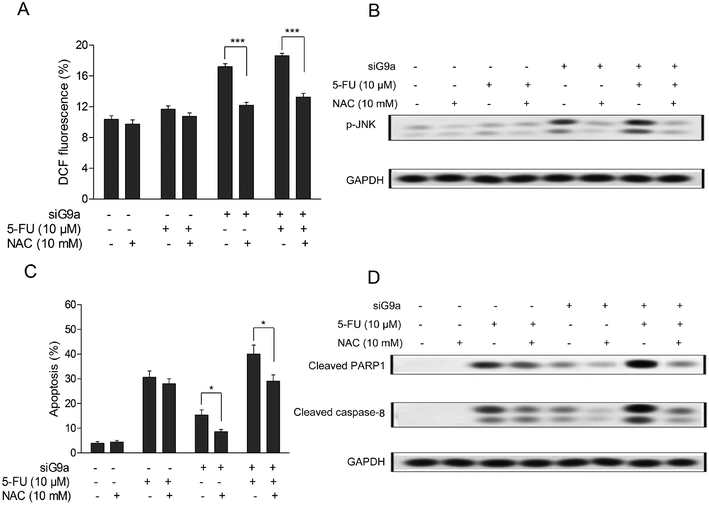
Previous studies have reported that down-regulation of G9a could decrease two-fold the intracellular glutathione levels in head and neck squamous cell carcinoma cells,18 and the latest evidence suggested that there were possibly direct roles of G9a in the increased ROS levels found in autophagy-mediated cell death in McF-7 cells.11 To determine whether the levels of intracellular ROS in siG9a treated human CCA (cholangiocarcinoma) cells were altered and its effects on siG9a enhanced cell apoptosis, the intracellular ROS in GC cells were assessed using DCFH-DA (oxidation-sensitive fluorescent probe). As shown in Fig. 4A, the elevation of intracellular general ROS levels was observed in the treatment with siG9a. Next, it was found that the intracellular general ROS levels were significantly decreased after the cells were incubated with 10 mM N-acetylcysteine (NAC), a normal antioxidant used to minimize oxidative stress.19 The NAC treatment also obviously reversed siG9a-activated p-JNK protein expression (Fig. 4B). Furthermore, the NAC treatment significantly decreased the cell apoptosis in the treatment of siG9a with or without 5-FU, but there was no significant change obtained with the treatment of 5-FU alone (Fig. 4C). In addition, NAC treatment suppressed the apoptotic protein level of cleaved PARP1 and caspase-8 in the treatment of siG9a with or without 5-FU (Fig. 4D).3.5 Effect of siG9a on tumor growth in a gastric cancer xenograft model
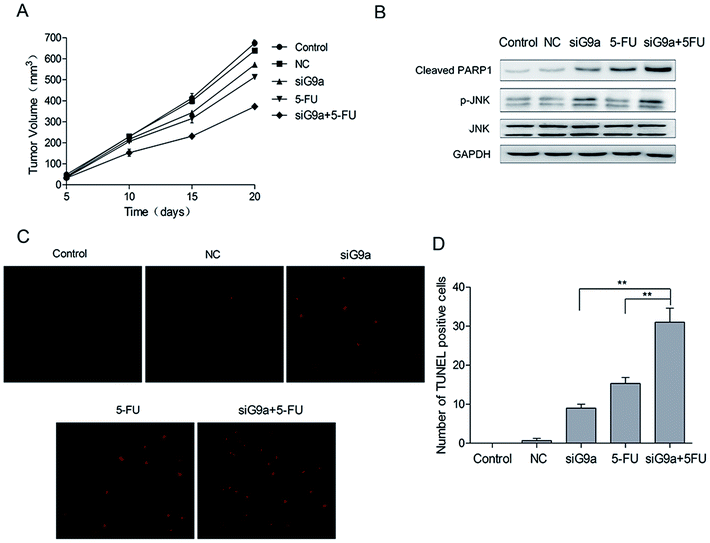
To investigate the effect of siG9a on GC in vivo, nude mice were given GC xenografts. The nude mice bearing NCI-N87 tumor xenografts were randomly divided into five groups: Control, NC, siG9a, 5-FU, siG9a + 5-FU. The tumor volume of all the groups was measured on days 5, 10, 15 and 20. Tumor growth was inhibited by the treatment with siG9a, and the xenograft growth in the nude mice was most effectively inhibited using a combined treatment with siG9a and 5-FU (Fig. 5A). To determine whether the combined effect of siG9a and 5-FU on xenografts could be attributed to apoptosis induction, tumor tissue cell apoptosis was determined using the TUNEL assay. The number of TUNEL-positive cells in the tumor tissue were significantly increased in tumors from mice who received the combined treatment with siG9a and 5-FU in comparison to the siG9a or 5-FU alone treatment groups (Fig. 5C and D) and these results were consistent with those of tumor volume measurements. In addition, the activation of cleaved PARP1 and p-JNK were observed following treatment with siG9a or combined treatment with siG9a and 5-FU in vivo (Fig. 5B). These data demonstrated that the suppression of G9a prevented tumor growth and enhanced the effect of 5-FU induced apoptosis on GC in vivo.4. Discussion
Gastric cancer is the fifth most common malignant tumor in the world, which has poor prognosis because of the difficulty of early detection and effective therapeutic treatments. The disequilibrium of epigenetic alteration has been examined previously and found to exert an important role in the occurrence and progress of gastric cancer.20,21 The histone modification and the abnormal expression of the modified enzymes of histone were detected in gastric cancer.22,23 A histone methyltransferase, G9a, encoded by euchromatic histone-lysine N-methyltransferase 2 (EHMT2), has been shown to be up-regulated in various cancers, including aggressive lung cancer, hepatocellular carcinoma, gastric cancer, esophageal squamous cell carcinoma, brain cancer, multiple myeloma, and aggressive ovarian carcinoma.24–26 In addition, the high expression level of G9a was shown to have a positive correlation with poor prognosis in different types of cancers.27,28 However, the effect of G9a on the chemotherapy sensitivity of 5-FU and its detailed mechanism remained obscure.This study revealed that the expression of G9a was increased remarkably in gastric cancer tissues and cell lines. Furthermore, the higher expression of G9a in the tissues of gastric cancer was shown to have a direct correlation with poor response to chemotherapy. Furthermore, the analysis of Kaplan–Meier survival revealed that the higher expression of G9a was correlated with the poor prognosis of the patients with gastric cancer after chemotherapy. To further investigate the effect of G9a on chemotherapy sensitivity, G9a was down-regulated using transfection of G9a siRNA in NCI-N87 cells. The results demonstrated that the down-regulation of G9a could suppress the cell viability in NCI-N87 cells. Zhang et al. have reported a depletion of G9a inhibited colorectal cancer cell proliferation and promoted the occurrence of chromosome aberration, the breaks of the DNA double strand and the senescence of colorectal cancer cells.29 In addition, the effect of decreased G9a on the sensitivity of 5-FU in gastric cancer cells was also determined. The results revealed that knockdown of G9a significantly suppressed the cell viability and enhanced the cell apoptosis induced by 5-FU in gastric cancer cells. The ROS/JNK signaling is a well-known signaling pathway for the regulation of cell apoptosis in various types of cancers.30–32 Li et al. found that celastrol induced apoptosis via the ROS/JNK signaling pathway in human osteosarcoma cells.33 In this study, it was demonstrated that G9a knockdown significantly activated the expression level of p-JNK and increased the intracellular ROS levels in the gastric cancer cells. In addition, inhibition of the ROS/JNK signaling, partially reversed the anti-apoptotic activity of G9a knockdown on gastric cancer cells treated with 5-FU. These results suggested that down-regulation of G9a could promote cell apoptosis induced by 5-FU in the gastric cancer cells, which was probably associated with the activation of the ROS/JNK signaling pathway. Furthermore, the combined effect of siG9a and 5-FU on gastric cancer in NCI-N87 tumor xenografts was also investigated. Interestingly, the siG9a and 5-FU combined treatment significantly inhibited tumor growth and enhanced tumor tissue cell apoptosis in comparison to the treatment groups given siG9a or 5-FU alone. In addition, the siG9a and 5-FU combined treatment also activated the expression of cleaved PARP1 and p-JNK in tumor xenografts. These data demonstrated that the suppression of G9a prevented tumor growth and enhanced the effect of 5-FU induced apoptosis of gastric cancer in vivo.
In conclusion, this study found that there was abnormal expression of G9a in gastric cancer both in vitro and in vivo. Furthermore, the expression of G9a was revealed to have a negative correlation with chemotherapy response in gastric cancer. Furthermore, down-regulation of G9a could enhance the sensitivity of 5-FU to the gastric cancer cells in vitro and in vivo, which were involved in the activation of the ROS/JNK signaling pathway. This study demonstrated that G9a could play a critical role in the chemotherapy sensitivity of gastric cancer and might serve as a novel method for treating gastric cancer in the clinic.
Conflicts of interest
The authors declare that they have no competing interests.Acknowledgements
This work was supported by the Zhejiang Natural Sciences Foundation Grant (LY14H160018) and Ningbo Science and Technology Grant (CN2018027).References
- W. Chen, R. Zheng, P. D. Baade, S. Zhang, H. Zeng, F. Bray, A. Jemal, X. Q. Yu and J. He, Ca-Cancer J. Clin., 2016, 66, 115–132 CrossRef PubMed.
- Y. Lin, J. Ueda, S. Kikuchi, Y. Totsuka, W. Q. Wei, Y. L. Qiao and M. Inoue, World J. Gastroenterol., 2011, 17, 4421–4428 CrossRef PubMed.
- Z. X. Li and M. Kaminishi, Gastric Cancer, 2009, 12, 52–53 CrossRef PubMed.
- L. Zong, M. Abe, Y. Seto and J. Ji, Lancet, 2016, 388, 2606 CrossRef.
- M. Venerito, R. Vasapolli and P. Malfertheiner, MMW Fortschr. Med., 2016, 158, 39–43 CrossRef PubMed.
- W. M. Kang, Q. B. Meng, J. C. Yu, Z. Q. Ma and Z. T. Li, World J. Gastroenterol., 2015, 21, 5934–5940 CrossRef PubMed.
- Z. Y. Xu, J. N. Tang, H. X. Xie, Y. A. Du, L. Huang, P. F. Yu and X. D. Cheng, Int. J. Biol. Sci., 2015, 11, 284–294 CrossRef CAS PubMed.
- L. S. Ying, J. L. Yu, X. X. Lu and Z. Q. Ling, Dig. Dis. Sci., 2013, 58, 414–422 CrossRef CAS PubMed.
- M. Tachibana, K. Sugimoto, T. Fukushima and Y. Shinkai, J. Biol. Chem., 2001, 276, 25309–25317 CrossRef CAS PubMed.
- J. Ding, T. Li, X. Wang, E. Zhao, J. H. Choi, L. Yang, Y. Zha, Z. Dong, S. Huang, J. M. Asara, H. Cui and H. F. Ding, Cell Metab., 2013, 18, 896–907 CrossRef CAS PubMed.
- Y. Kim, Y. S. Kim, D. E. Kim, J. S. Lee, J. H. Song, H. G. Kim, D. H. Cho, S. Y. Jeong, D. H. Jin, S. J. Jang, H. S. Seol, Y. A. Suh, S. J. Lee, C. S. Kim, J. Y. Koh and J. J. Hwang, Autophagy, 2013, 9, 2126–2139 CrossRef CAS PubMed.
- H. Tao, H. Li, Y. Su, D. Feng, X. Wang, C. Zhang, H. Ma and Q. Hu, Mol. Cell. Biochem., 2014, 394, 23–30 CrossRef CAS PubMed.
- M. Tachibana, K. Sugimoto, M. Nozaki, J. Ueda, T. Ohta, M. Ohki, M. Fukuda, N. Takeda, H. Niida, H. Kato and Y. Shinkai, Genes Dev., 2002, 16, 1779–1791 CrossRef CAS PubMed.
- F. Casciello, K. Windloch, F. Gannon and J. S. Lee, Front. Immunol., 2015, 6, 487 Search PubMed.
- P. Therasse, S. G. Arbuck, E. A. Eisenhauer, J. Wanders, R. S. Kaplan, L. Rubinstein, J. Verweij, M. Van Glabbeke, A. T. van Oosterom, M. C. Christian and S. G. Gwyther, J. Natl. Cancer Inst., 2000, 92, 205–216 CrossRef CAS PubMed.
- H. Yang, Z. Liu, C. Yuan, Y. Zhao, L. Wang, J. Hu, D. Xie, L. Wang and D. Chen, J. Natl. Cancer Inst., 2015, 8, 11092–11099 CAS.
- F. Jiao, H. Hu, C. Yuan, L. Wang, W. Jiang, Z. Jin, Z. Guo and L. Wang, Oncol. Rep., 2014, 32, 2485–2492 CrossRef CAS PubMed.
- C. W. Liu, K. T. Hua, K. C. Li, H. F. Kao, R. L. Hong, J. Y. Ko, M. Hsiao, M. L. Kuo and C. T. Tan, Mol. Cancer Ther., 2017, 16, 1421–1434 CrossRef CAS PubMed.
- C. Kerksick and D. Willoughby, J. Int. Soc. Sports Nutr., 2005, 2, 38–44 CrossRef PubMed.
- J. C. Santos and M. L. Ribeiro, World J. Gastroenterol., 2015, 21, 9021–9037 CrossRef CAS PubMed.
- C. Kang, J. J. Song, J. Lee and M. Y. Kim, World J. Gastroenterol., 2014, 20, 6433–6447 CrossRef PubMed.
- J. Su, F. Wang, Y. Cai and J. Jin, Int. J. Mol. Sci., 2016, 17, E99 CrossRef PubMed.
- S. Zhang, P. Chen, Z. Huang, X. Hu, M. Chen, S. Hu, Y. Hu and T. Cai, Sci. Rep., 2015, 5, 9787 CrossRef CAS PubMed.
- R. J. Wozniak, W. T. Klimecki, S. S. Lau, Y. Feinstein and B. W. Futscher, Oncogene, 2007, 26, 77–90 CrossRef CAS PubMed.
- B. Lehnertz, C. Pabst, L. Su, M. Miller, F. Liu, L. Yi, R. Zhang, J. Krosl, E. Yung, J. Kirschner, P. Rosten, T. M. Underhill, J. Jin, J. Hebert, G. Sauvageau, R. K. Humphries and F. M. Rossi, Genes Dev., 2014, 28, 317–327 CrossRef CAS PubMed.
- K. T. Hua, M. Y. Wang, M. W. Chen, L. H. Wei, C. K. Chen, C. H. Ko, Y. M. Jeng, P. L. Sung, Y. H. Jan, M. Hsiao, M. L. Kuo and M. L. Yen, Mol. Cancer, 2014, 13, 189 CrossRef PubMed.
- M. W. Chen, K. T. Hua, H. J. Kao, C. C. Chi, L. H. Wei, G. Johansson, S. G. Shiah, P. S. Chen, Y. M. Jeng, T. Y. Cheng, T. C. Lai, J. S. Chang, Y. H. Jan, M. H. Chien, C. J. Yang, M. S. Huang, M. Hsiao and M. L. Kuo, Cancer Res., 2010, 70, 7830–7840 CrossRef CAS PubMed.
- J. Huang, J. Dorsey, S. Chuikov, L. Perez-Burgos, X. Zhang, T. Jenuwein, D. Reinberg and S. L. Berger, J. Biol. Chem., 2010, 285, 9636–9641 CrossRef CAS PubMed.
- J. Zhang, P. He, Y. Xi, M. Geng, Y. Chen and J. Ding, Oncotarget, 2015, 6, 2917–2927 Search PubMed.
- Q. Wu, J. Deng, D. Fan, Z. Duan, C. Zhu, R. Fu and S. Wang, Biochem. Pharmacol., 2018, 148, 64–74 CrossRef CAS PubMed.
- J. Ahn, Y. W. Chung, J. B. Park and K. M. Yang, J. Cell. Biochem., 2018, 119, 998–1007 CrossRef CAS PubMed.
- K. Shen, J. Xie, H. Wang, H. Zhang, M. Yu, F. Lu, H. Tan and H. Xu, Mol. Cancer Ther., 2015, 14, 1738–1749 CrossRef CAS PubMed.
- H. Y. Li, J. Zhang, L. L. Sun, B. H. Li, H. L. Gao, T. Xie, N. Zhang and Z. M. Ye, Cell Death Dis., 2015, 6, e1604 CrossRef CAS PubMed.
Footnote |
| † These authors contributed equally to this work. |
| This journal is © The Royal Society of Chemistry 2019 |

