DOI:
10.1039/C8RA10538C
(Paper)
RSC Adv., 2019,
9, 5100-5109
Fabrication of Ag/AgBr/Ag3VO4 composites with high visible light photocatalytic performance
Received
24th December 2018
, Accepted 24th January 2019
First published on 11th February 2019
Abstract
Herein, Ag/AgBr/Ag3VO4 composites were synthesized by a simple continuous precipitation method. The obtained composites were characterized by X-ray diffraction (XRD), scanning electron microscopy (SEM), energy dispersive spectrometry (EDS), X-ray photoelectron spectroscopy (XPS), UV-vis diffuse reflectance spectroscopy and photoluminescence spectroscopy (PL). Photocatalytic performance of the composites was assessed by the degradation of methyl orange (MO) and tetracycline hydrochloride (TC) under visible light, and the effects of different nominal mass ratios of AgBr and Ag3VO4 on the photocatalytic activity were investigated. The results showed that after 20 min of visible light irradiation (λ > 420 nm), the removal rate of MO in the presence of a 5![[thin space (1/6-em)]](https://www.rsc.org/images/entities/char_2009.gif) :
:![[thin space (1/6-em)]](https://www.rsc.org/images/entities/char_2009.gif) 1 sample reached 98.6%. The EIS and photocurrent results demonstrated that the enhancement of the visible light photocatalytic activity was attributed to the efficient electron–hole pair separation. In addition, the scavenging reactions conducted via the addition of different scavengers confirmed that h+ and ·O2− were the main active species in the reaction. The present study offers potential for the degradation of contaminants.
1 sample reached 98.6%. The EIS and photocurrent results demonstrated that the enhancement of the visible light photocatalytic activity was attributed to the efficient electron–hole pair separation. In addition, the scavenging reactions conducted via the addition of different scavengers confirmed that h+ and ·O2− were the main active species in the reaction. The present study offers potential for the degradation of contaminants.
1. Introduction
With the gradual development of industry and technology, serious environmental pollution and the scarcity of clean energy have become the most urgent problems. Various forms of organic wastewater are discharged into the environment every year; this has caused serious pollution to the environment. Moreover, the compound structure of organic pollutants is quite stable in water, difficult to decompose, and resistant to biodegradation.1–4 Some advanced oxidation processes, such as the Fenton oxidation,5 photocatalytic oxidation6 and photo-electro-catalytic technology,7,8 have been developed to solve the problem of wastewater pollution. Photocatalytic oxidation has the advantages of mild reaction conditions, no secondary contamination, and low energy consumption in the reaction process and thus has become one of the best green environmental protection technologies to be developed.9–11 To date, the most commonly used photocatalyst is TiO2 that has excellent chemical stability and is abundant, non-toxic, and low-cost.12,13 However, TiO2 is a photocatalyst with a wide band gap (3.2 eV), and its low solar energy utilization and quantum yield limit its practical application.14–16 Researchers have tried to develop a variety of photocatalytic materials with effective visible light responses, which has already been a key problem in the field of photocatalysis. In the past few years, many studies have been conducted on silver-based photocatalysts, including Ag2O,17 Ag3PO4,18 Ag2CO3,19 AgX (X = Cl, Br, I),20 and Ag6Si2O7,21,22 with excellent properties in the degradation of organic pollutants.
AgBr is a traditional photosensitive material whose properties of light decomposition greatly limit its application as a photocatalyst.23,24 Studies have shown that AgBr can reduce its surface component Ag+ to Ag0 under illumination to form Ag/AgBr, and the photocatalytic activity of Ag/AgBr is improved because Ag0 exhibits a high efficiency plasmon resonance effect (SPR) in the visible region.25 Since the electron–hole pairs of AgBr rapidly combine, AgBr is generally mixed with other materials to improve its photocatalytic performance. Chen et al.26 synthesized a AgBr@rGO composite by coating AgBr on graphene nanosheets via a precipitation method; this increased the separation rate of the photogenerated charges. Upon further loading AgBr onto the graphene hydrogel to form a 3D network structure with good adsorption performance, bisphenol A rapidly degraded under the synergistic effect of adsorption and photocatalytic degradation. Lin et al.27 studied the decoration of nano Ag@AgBr particles on flower-like Bi2WO6 using an oil-in-water self-assembly method to form Ag@AgBr/Bi2WO6 composites, whose degradation rate for MB was 1.29 times that of Ag@AgBr. In summary, it can be clearly concluded that the AgBr-based composite materials show better photocatalytic activity in the degradation of organic pollutants.
Ever since Konta et al.28 have conducted a pioneering study on Ag3VO4 and found that Ag3VO4 can split H2O into O2 and H2, the narrow band gap monoclinic scheelite Ag3VO4 (∼2 eV) has attracted wide attention of researchers. Due to its special band structure, the electron–hole recombination rate of pure Ag3VO4 is higher.29 Many researchers have further modified its photocatalytic properties by combining it with a large number of materials such as WO3,30 BiVO4,31 ZnO,32 g-C3N4,33 and BiOBr.34 In general, the construction of a heterojunction photocatalyst is a method that can effectively improve the performance of a single photocatalyst. Zhu et al.35 have reported the initial combination of Ag3VO4 and AgBr materials; however, investigation of the ideal ratio of each material is still worth further exploration; in addition, the preparation of a composite photocatalyst of the system by a continuous precipitation method and the development of the composite Ag/AgBr/Ag3VO4 for the degradation of MO and TC have not been reported to date.
In this study, a series of Ag/AgBr/Ag3VO4 photocatalysts with different AgBr masses were synthesized by a simple continuous precipitation method. The visible light catalytic performance of the photocatalyst in the degradation of MO and TC was investigated. The effects of different active substances during the degradation of MO were also studied by introducing various scavengers into the photocatalytic reaction system. The separation efficiency of electron–hole pairs has been discussed by investigating the electrochemical properties, and the possible mechanism of the photocatalytic processes has been proposed.
2. Experimental
2.1. Chemicals
Silver nitrate (AgNO3) was purchased from Sinopharm Chemical Reagent Co., Ltd (Shanghai, China). Potassium bromide (KBr) was purchased from Chengdu Jinshan Chemical Reagent Co., Ltd. Sodium vanadate (Na3VO4) was purchased from Cool Chemistry (Beijing, China). Methyl orange (MO) was purchased from Chengdu Jinshan Chemical Reagent Co., Ltd. Tetracycline hydrochloride (TC) was purchased from Aladdin (Shanghai, China). All reagents were of analytical grade and used without further purification.
2.2. Synthesis of the Ag/AgBr/Ag3VO4 photocatalyst
A series of Ag/AgBr/Ag3VO4 composites were prepared through a continuous precipitation route. In a typical synthetic procedure, a certain amount of AgNO3 (7.6, 6.7, 6.3, 6.1 mmol) was added to 50 mL of deionized water followed by stirring to obtain a uniform clear solution, labeled as solution A. Then, 5.3 mmol of KBr was dissolved in 20 mL of deionized water and marked as solution B. A certain amount of Na3VO4 (0.76, 0.46, 0.33, 0.25 mmol) was added to another 20 mL of deionized water and labeled as solution C. The solution B was gradually added dropwise to the solution A via a dropping funnel under vigorous stirring. After 30 min, Ag+–AgBr was obtained. Then, solution C was continuously added to the above mentioned mixture in the same manner, and magnetic stirring was further continued for another 4 h to obtain the AgBr/Ag3VO4 composites. After this, the mixture solution was reduced under visible light for 20 minutes to produce a portion of Ag0. The final product was obtained by filtration, rinsed three times with deionized water and placed in an oven at 60 °C for 24 h. The nominal mass ratios of AgBr to Ag3VO4 were 3![[thin space (1/6-em)]](https://www.rsc.org/images/entities/char_2009.gif) :
:![[thin space (1/6-em)]](https://www.rsc.org/images/entities/char_2009.gif) 1, 5
1, 5![[thin space (1/6-em)]](https://www.rsc.org/images/entities/char_2009.gif) :
:![[thin space (1/6-em)]](https://www.rsc.org/images/entities/char_2009.gif) 1, 7
1, 7![[thin space (1/6-em)]](https://www.rsc.org/images/entities/char_2009.gif) :
:![[thin space (1/6-em)]](https://www.rsc.org/images/entities/char_2009.gif) 1, and 9
1, and 9![[thin space (1/6-em)]](https://www.rsc.org/images/entities/char_2009.gif) :
:![[thin space (1/6-em)]](https://www.rsc.org/images/entities/char_2009.gif) 1, and the corresponding samples were denoted as S1, S2, S3, S4. In brief, pure Ag/AgBr was prepared by precipitation of 3 mmol AgNO3 with 3 mmol KBr followed by photoreduction for 20 minutes. Ag3VO4 was obtained by precipitation of 6 mmol AgNO3 with 2 mmol Na3VO4.
1, and the corresponding samples were denoted as S1, S2, S3, S4. In brief, pure Ag/AgBr was prepared by precipitation of 3 mmol AgNO3 with 3 mmol KBr followed by photoreduction for 20 minutes. Ag3VO4 was obtained by precipitation of 6 mmol AgNO3 with 2 mmol Na3VO4.
2.3. Evaluation of the photocatalytic performance
The photocatalytic reactions occurred in a 200 mL reactor at room temperature, and a 300 W Xe lamp (CEL-HXF300) equipped with a 420 nm cut-off filter was used as the light source for the reaction process. Typically, 50 mg photocatalyst was added to 100 mL of MO (10 mg L−1) solution (or 50 mg photocatalyst was added to 100 mL of TC (10 mg L−1) solution), and the mixture was stirred in the dark for 30 min to ensure an adsorption–desorption balance. Then, the light source was turned on for photocatalysis experiments, and timing was initiated. During the reaction, quantitative samples were obtained at given time intervals under light irradiation. The sample was centrifuged at 10![[thin space (1/6-em)]](https://www.rsc.org/images/entities/char_2009.gif) 000 rpm for 5 min to separate the catalyst from the solution. Analysis of the absorbance of the supernatant at each of the abovementioned intervals was performed using a UV-vis spectrophotometer. The role of various active species in the photocatalytic system was investigated by adding different active species capture agents, including 0.2 g ammonium oxalate (AO), 3 mL isopropanol (IPA) and 8 mg benzoquinone (BQ), to the solution.
000 rpm for 5 min to separate the catalyst from the solution. Analysis of the absorbance of the supernatant at each of the abovementioned intervals was performed using a UV-vis spectrophotometer. The role of various active species in the photocatalytic system was investigated by adding different active species capture agents, including 0.2 g ammonium oxalate (AO), 3 mL isopropanol (IPA) and 8 mg benzoquinone (BQ), to the solution.
2.4. Characterization of the as-prepared samples
To discriminate the phase composition and purity of the materials, X-ray diffraction (XRD) analysis of the samples was conducted using the D8 ADVANCE diffractometer with Cu Kα radiation. The morphology and constituent elements of the composites were investigated by scanning electron microscopy (S-4800, accelerating voltage 200 kV) and energy dispersive spectroscopy (EDS) analysis, respectively. The elemental composition and the chemical state of the composites were obtained by X-ray photoelectron spectroscopy (ThermoFisher K-Alpha). UV-vis diffuse reflectance spectra (DRS) were obtained by a spectrophotometer (UV2700, Shimadzu, Japan) in the wavelength range of 200–800 nm. Photoluminescence (PL) spectra of the samples were obtained by the Cary Eclipse fluorescence spectrophotometer (Agilent Technologies). Electrochemical impedance spectroscopy (EIS) was conducted using an electrochemical workstation (CHI760E Shanghai). The Pt electrode, the calomel electrode and the sample electrode played the role of a counter electrode, a reference electrode and a working electrode, respectively, and were placed in a 0.1 M Na2SO4 electrolyte for measuring the photocurrent.
3. Results and discussion
The Ag/AgBr/Ag3VO4 composite was prepared by a simple continuous precipitation method. As shown in Fig. 1, the synthetic route is described as follows: at first, KBr was added dropwise to the AgNO3 solution, and Br− in the solution reacted with Ag+ to form AgBr. Then, Na3VO4 was added to the solution, and Ag+ that had been immobilized further reacted with VO43− to form Ag3VO4 and covered the surface of AgBr. Finally, Ag/AgBr/Ag3VO4 was generated after illumination.
 |
| | Fig. 1 Schematic of the synthesis route of the Ag/AgBr/Ag3VO4 composites. | |
3.1. XRD analysis
The XRD spectra of Ag/AgBr, Ag3VO4 and Ag/AgBr/Ag3VO4 composites are shown in Fig. 2. The peaks of Ag/AgBr and Ag3VO4 well-matched with those of cubic AgBr (JCPD no. 06-0438) and monoclinic Ag3VO4 (JCPDS no. 43-0542), respectively. For AgBr, the sharp diffraction peaks at 30.96°, 44.35° and 55.04° corresponded perfectly to the crystal planes of (2 0 0), (2 2 0) and (2 2 2). This shows that its crystallinity is good and there are no other impurities. For pure Ag3VO4, the diffraction peaks at 30.86°, 32.33° and 35.07° corresponded to the crystal planes of (−1 2 1), (1 2 1) and (3 0 1); this indicated that the prepared Ag3VO4 was pure and had no second phase. A fairly weak intensity peak can also be observed in the XRD pattern of Ag/AgBr/Ag3VO4; since the intensity of the peak of Ag3VO4 in the composite is much weaker than that of AgBr and their peak positions are relatively close at around 31°, the peak of Ag3VO4 may be covered by the peak of AgBr.36 As the AgBr content increases, the peak of Ag3VO4 becomes weaker until it is barely visible. The results of XRD suggest that the composites have been successfully prepared by a continuous precipitation method. In addition, the reason why the characteristic diffraction peak of Ag0, which is expected to occur, is not observed in the spectrum may be that the content of Ag0 is low.
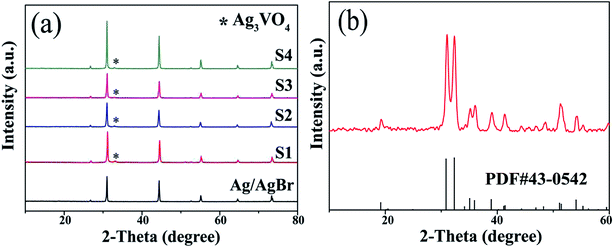 |
| | Fig. 2 (a) XRD patterns of Ag/AgBr and Ag/AgBr/Ag3VO4 composites and (b) pure Ag3VO4. | |
3.2. XPS analysis
To acquire the elemental composition of the composite and the chemical states of the measured elements, sample S2 was selected for X-ray photoelectron spectroscopy (XPS). As shown in Fig. 3, the high-resolution spectrum is composed of Ag 3d, Br 3d, V 2p and O 1s with no other impurities. Moreover, two peaks with the binding energies of 368.25 eV and 374.22 eV were observed in the Ag 3d spectra (Fig. 3b), which were consistent with Ag 3d5/2 and Ag 3d3/2 of Ag+ for AgBr and Ag3VO4, respectively, and further confirmed that the Ag species mainly existed in the form of Ag+. Moreover, there were two weak peaks at the binding energies of 369.16 eV and 375.02 eV, which corresponded to Ag 3d5/2 and Ag 3d3/2, indicating that Ag also existed in the form of metallic Ag0.37 The reason for the occurrence of this phenomenon is that under light, Ag+ is partially reduced to Ag0 and attached to the surface of the composite photocatalyst. Moreover, two distinct peaks at the binding energies of 68.85 eV and 69.6 eV were observed in the Br 3d spectra (Fig. 3c), which were attributed to Br 3d5/2 and Br 3d3/2 and indicated that Br existed as Br−.38 The peaks of V 2p1/2 and V 2p3/2 at 516.85 eV and 524.35 eV confirmed that V existed as V5+ (ref. 39) (Fig. 3d). The peak of O 1s (Fig. 3e) at 530.08 eV corresponded to hydroxyls (–OH), and the other peak at 531.87 eV confirmed the existence of oxygen in Ag/AgBr/Ag3VO4. All these results further showed that the composites consisted of Ag/AgBr and Ag3VO4.
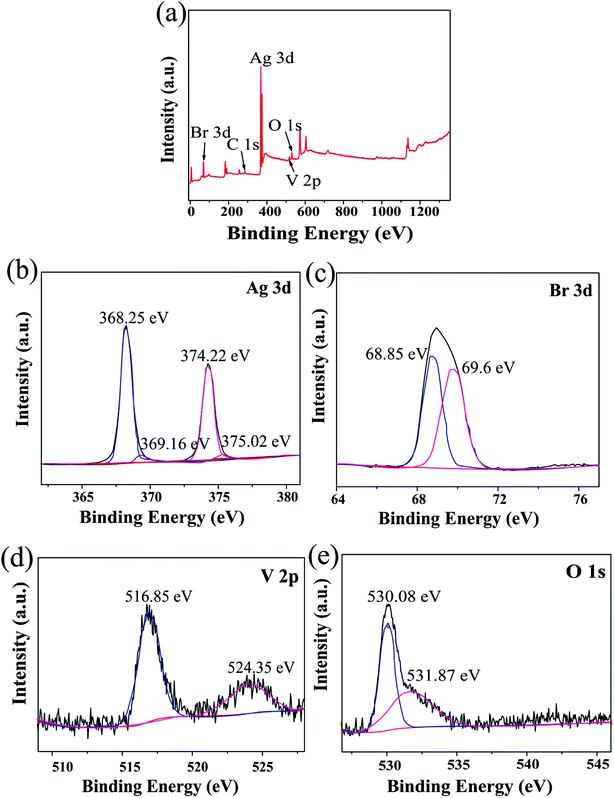 |
| | Fig. 3 (a) Survey XPS spectra of the S2 sample; (b, c, d and e) high-resolution XPS data of Ag 3d, Br 3d, V 2p, and O 1s for S2, respectively. | |
3.3. SEM analysis
The morphologies and composition of Ag3VO4, Ag/AgBr, and Ag/AgBr/Ag3VO4 were investigated by SEM and EDS, respectively (Fig. 4). As shown in Fig. 4a, fine particles of Ag/AgBr having an average particle diameter of more than 1 μm can be observed. Fig. 4b shows the prepared Ag3VO4 with nanometer-sized particles. Both Ag/AgBr and Ag3VO4 prepared by the continuous precipitation method are irregular small particles, and the particle size of Ag3VO4 is much smaller than that of Ag/AgBr. The composite Ag/AgBr/Ag3VO4 also exhibited irregular particles, and the surface of the large particles was occupied by many small particles (Fig. 4c). The abundant content of AgBr in the composite material made a significant impact on the formation of its final morphology, and the particle size of the composite was similar to that of AgBr. Moreover, the composite exhibits good dispersibility (Fig. 4d), and the close contact between AgBr and Ag3VO4 will enhance the transfer and separation of photogenerated charges;40 one of the advantages of a Ag/AgBr/Ag3VO4 composite is that it has more active sites, and the photogenerated electron–hole pairs can be rapidly transferred; this is very beneficial to the degradation of MO by the photocatalyst.41 The EDS spectra of Ag/AgBr and S2 are shown in Fig. 4e and f, respectively. Pure AgBr consisted of Ag and Br elements, whereas the Ag/AgBr/Ag3VO4 composite material was confirmed to contain Ag, Br, V and O elements. Based on the results of the abovementioned XRD, SEM and EDS data, the preparation of the Ag/AgBr/Ag3VO4 composite was successfully confirmed.
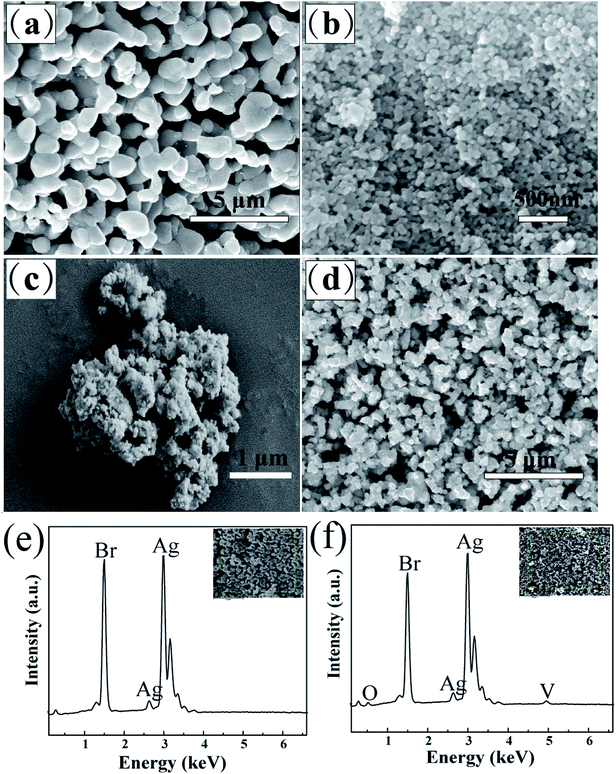 |
| | Fig. 4 SEM images of (a) pure Ag/AgBr, (b) pure Ag3VO4, and (c and d) S2 sample; (e and f) EDS spectra of pure Ag/AgBr and S2 sample, respectively. | |
3.4. The optical property analysis
The optical properties of the prepared samples were investigated via a UV-vis spectrophotometer. The light absorption characteristic of the composite material can be analyzed from Fig. 5. All samples exhibited absorbance in the visible region, and AgBr caused a significant absorption band in the sample curve due to the surface plasmon resonance effect (SPR) of Ag0, which was derived from the collective oscillation of free electrons.27,42 With a change in the AgBr content in the composite, the edge absorption band value of the composite appears to increase in a regular way. As the absorption edge value of the sample becomes larger, the response of the sample to visible light is enhanced. The band gap width of the composite materials was obtained by the equation (αhv) = A(hv − Eg)n/2, where Eg, v, h, A and α are the band gap energy of the semiconductor, light frequency, Planck's constant, a constant value and the absorption coefficient, respectively.19,34 The relationship between (αhv)2 and hv was obtained as shown in Fig. 5b, and the Eg value was acquired by estimating the intercept of the tangent of the curve. In this study, the band gap values of Ag/AgBr, Ag3VO4, and sample S2 were calculated to be 2.43 eV, 2.01 eV, and 2.64 eV, respectively, which were consistent with the previously reported values.31,43,44
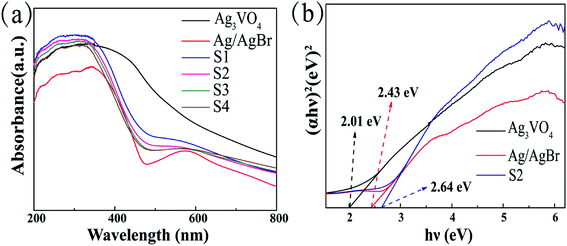 |
| | Fig. 5 (a) UV-vis diffuse reflectance spectra of Ag/AgBr, Ag3VO4 and Ag/AgBr/Ag3VO4 composites; (b) Tauc plot of Ag/AgBr, Ag3VO4 and S2. | |
3.5. Charge separation analysis
In general, PL spectra can be used to detect the separation and recombination rates of photogenerated charges. A lower PL intensity means that the photogenerated electron–hole pairs have high separation efficiency and thus produce high photocatalytic activity.45 The photoluminescence spectra of Ag3VO4, Ag/AgBr and S2 are shown in Fig. 6. It can be found that the intensities of both pure Ag3VO4 and Ag/AgBr in the plot are higher than those in the curve of the S2 sample at different wavelengths; this indicates the reduction of photogenerated electron–hole pair recombination in sample S2.
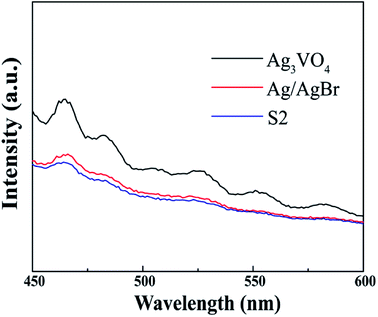 |
| | Fig. 6 PL spectra of pure Ag/AgBr, Ag3VO4 and S2 sample. | |
To further analyze the separation efficiency of photogenerated electron–hole pairs, the EIS and transient photocurrent responses of the photocatalytic samples were investigated. For the EIS, a small arc radius leads to a low charge transfer resistance.18 Fig. 7a clearly reveals that the Nyquist plots of S2 are smaller than that of Ag/AgBr; this indicates that the photogenerated electron–hole transfer efficiency of S2 is high. In the transient photocurrent response of the samples, a change in the light source causes a sudden change in the photocurrent. A high transient photocurrent response is generally indicative of a high separation efficiency of the photogenerated electron–hole pairs. It can be observed that the photocurrent of S2 is stronger than that of Ag/AgBr; this denotes that S2 has a faster electron–hole separation efficiency (Fig. 7b). This may be due to the fact that the electron–hole transfer efficiency between interfaces becomes higher after the combination of AgBr and Ag3VO4 into a composite material.
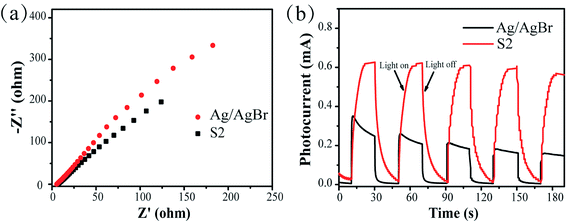 |
| | Fig. 7 (a) Electrochemical impedance spectra of Ag/AgBr and S2 photocatalysts and (b) transient photocurrent response of Ag/AgBr and S2. | |
3.6. The photocatalytic performance test
To explore the ability of the as-prepared composites to degrade pollutants, the degradation of the common pollutants MO and TC by the composites was studied by the degradation experiments. As shown in Fig. 8a, the negligible self-photolysis of MO under visible light demonstrates that MO has stable chemical properties to light. The adsorption rate in the dark reaction is also low; this indicates that the main cause of MO degradation is visible light irradiation rather than surface adsorption of the photocatalyst. As expected, all the prepared composite photocatalysts have higher photocatalytic activity than Ag/AgBr and Ag3VO4 with the ranking of S2 > S3 > S4 > S1 > Ag/AgBr > Ag3VO4, proving that AgBr plays an active role in enhancing the photocatalytic activity.45 Moreover, as the proportion of AgBr in the composites increases, the degradation of MO first increases and then decreases. Particularly, the removal efficiency of all the composite photocatalysts could reach over 90% after 10 min of illumination. S2 exhibited the most excellent photocatalytic activity, and 98.6% of MO was decomposed after 20 min of irradiation. The findings demonstrate that the composite photocatalyst has a shorter degradation time and higher degradation efficiency than the single photocatalyst. The photocatalytic activity of S3 and S4 in the plot is also lower than that of S2; this may be explained by the recombination of photogenerated electrons and holes that suppresses the photocatalytic efficiency. In addition, for the typical colorless antibiotic TC, S2 exhibited superior photocatalytic activity in the degradation of TC (Fig. 8b). Its degradation efficiency reached 77% after 10 minutes. However, after 4 min, the degradation rate of TC became very low, possibly reaching equilibrium rather than complete degradation.39
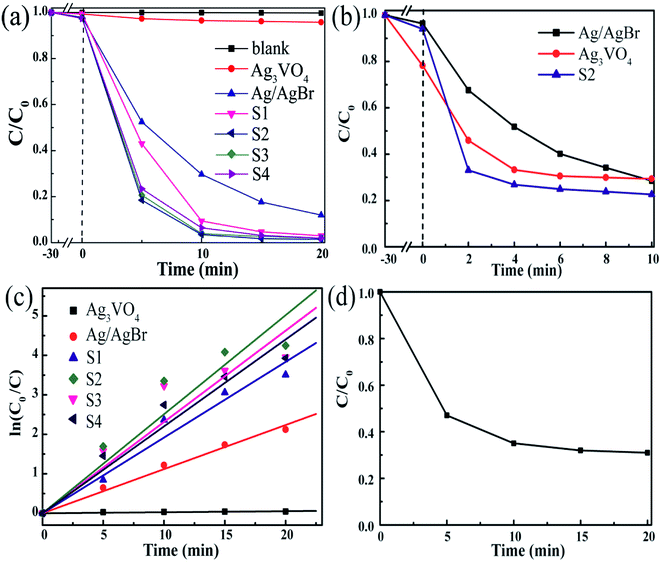 |
| | Fig. 8 (a) The photocatalytic degradation of MO via different as-synthesized photocatalysts; (b) the photocatalytic degradation of TC via different as-synthesized photocatalysts; (c) pseudo first-order plot of the photocatalytic degradation of MO via different as-synthesized photocatalysts; (d) change of TOC removal rate of MO in the presence of the S2 sample. | |
The pseudo first-order plots of MO degradation reactions for different samples are shown in Fig. 8c, which have been obtained by processing the data using a pseudo first-order model whose equation is ln(C0/Ct) = kt. C0 is the initial concentration of MO before the photoreaction, Ct is the concentration of MO after the reaction time t, and k is the reaction rate constant. The degradation rates of MO were calculated to be 0.0026 min−1, 0.1118 min−1, and 0.2509 min−1 over the Ag3VO4, Ag/AgBr, and S2 samples, respectively. The degradation rate of S2 is higher than the degradation rate of a single photocatalyst, which is 2.2 and 96.5 times that of Ag/AgBr and Ag3VO4, respectively. This is highly consistent with the results of photocatalytic degradation. These results more accurately demonstrate that the composite material significantly improves the degradation rate of the pollutants.
The MO solution was taken at a given reaction time, and the change in its TOC content was measured to account for the change of the remaining content of MO in the solution. As shown in Fig. 8d, during the photocatalytic degradation of MO, the TOC gradually decreased to 31% with time. It showed that the composite could effectively remove MO, and MO was mineralized into CO2 and H2O.
To further assess the performance of the photocatalyst, the stability of the photocatalyst was explored through cycling experiments. As shown in Fig. 9a, the catalyst can be subjected to multiple cycling experiments to show that it has good stability; however, after three cycles, the degradation efficiency is reduced, and only 61.3% of the pollutants are degraded. There are two possibilities for explaining this phenomenon: one is that some catalysts are inevitably lost during the experimental operation, and the second is that the catalyst decomposes a part of Ag0; this directly leads to a decrease in the photocatalytic activity. The latter reason could be supported by the XRD comparison data obtained before and after the sample was used. The Ag0 characteristic diffraction peak was clearly observed in the spectrum of the catalyst recovered after the cycling experiment, and the other structures hardly changed (Fig. 9b).
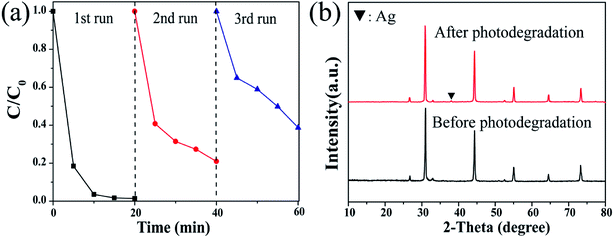 |
| | Fig. 9 (a) Reusable performance of S2 and (b) XRD data contrast diagram before and after the use of S2. | |
3.7. Possible photocatalytic mechanism of the Ag/AgBr/Ag3VO4 composites
The photocatalysts produce various active substances in the solution such as hydroxyl radicals (·OH), ·O2− and h+. The active substances produced can oxidize or reduce the pollutants into new non-toxic and harmless substances; thus, the purpose of removing the target pollutants in the solution is achieved. Therefore, experiments to capture the reactive species have been conducted to identify the active species that are primarily catalytically active. Herein, ammonium oxalate (AO), benzoquinone (BQ) and isopropanol (IPA) acted as scavengers to eliminate h+, ·O2− and ·OH, respectively.46 As Fig. 10 shows, the degradation rate of MO was 98.6% before the addition of a scavenger, and the removal rate of MO after the addition of AO and BQ was 62% and 21%, respectively. The phenomenon of photocatalytic activity was significantly inhibited; this indicated that h+ and ·O2− might be the main reactive species involved in the photocatalytic degradation process, and ·O2− played a dominant role in the reaction. When IPA was added as a scavenger, the degradation rate of MO was still as high as 98%, which was enough to show that ·OH was a partly reactive species in the reaction and had only a weak influence on the degradation process.
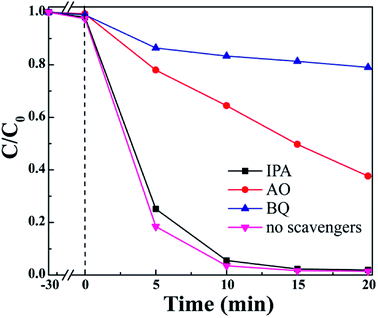 |
| | Fig. 10 Photocatalytic degradation of MO in an aqueous solution via S2 under different conditions. | |
Based on the previous analysis, a possible mechanism for the degradation of MO by the composites can be proposed, as shown in Fig. 11. The band gaps of AgBr and Ag3VO4 estimated by UV-vis spectroscopy were about 2.43 eV and 2.01 eV, respectively. Through the Mulliken electronegativity theory, we computed the position of the semiconductor band, and the formulas are as follows:
where
ECB and
EVB represent the edge potential of the conduction band (CB) and valence band (VB), respectively, and
X stands for the absolute electronegativity of the semiconductor, which is derived from the geometric mean of the electronegativity of the constituent atoms (the
X value of AgBr is 4.42,
47 and the
X value of Ag
3VO
4 is 5.64 (
ref. 48)).
Ee is the energy of free electrons in the hydrogen scale (about 4.5 eV).
Eg is the band gap energy of the semiconductor. It has been determined by calculation that the valence band edges of AgBr and Ag
3VO
4 are located at 1.13 eV and 2.15 eV, and the conduction band edges are located at the positions −1.3 eV and 0.14 eV, respectively. Under visible light irradiation, the energy of light is greater than the energy band gap of AgBr and Ag
3VO
4. Ag
0, AgBr and Ag
3VO
4 can absorb visible light photons to form electron–hole pairs. Subsequently, the electrons will migrate from the surface of Ag
0 to the CB of AgBr and, in turn, eventually to the CB of Ag
3VO
4, whereas the holes remain on Ag
0. The electrons accumulate to a higher concentration in the CB of Ag
3VO
4, and the electrons can be trapped by molecular oxygen in the solution to form a strong oxidizing substance, ·O
2−, and other reactive oxygen species, which can oxidize MO and result in high photocatalytic activity.
35 Furthermore, the holes in the VB of Ag
3VO
4 gradually migrate to the VB of AgBr and aggregate. A large number of holes can react with H
2O or –OH to produce the ·OH radicals, and excess holes can be combined with Br
− to reduce it to Br
0 since Br
0 is also a kind of active radical species.
35,38,49 Finally, ·O
2−, h
+, ·OH and Br
0 react with MO as oxidants to generate H
2O, CO
2 and other small molecules, resulting in the degradation of MO. The possible mechanism by which Ag/AgBr/Ag
3VO
4 degrades MO can be explained as follows:
| | |
Ag/AgBr/Ag3VO4 + hν → Ag/AgBr/Ag3VO4(eCB− + hVB+)
| (3) |
| | |
Ag3VO4(e−) + O2 → ·O2−
| (4) |
| | |
·OOH + H+ + 2e− → ·OH + OH−
| (6) |
| | |
AgBr(h+) + Br− → AgBr + Br0
| (8) |
| | |
·O−2, h+, ·OH, Br0 + MO → small molecules
| (9) |
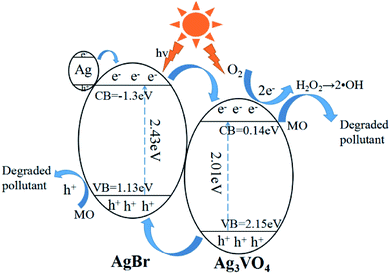 |
| | Fig. 11 The possible photocatalytic mechanism of the Ag/AgBr/Ag3VO4 composites. | |
On the one hand, the composite material of this structure accelerates the effective separation of photogenerated electrons and holes and reduces the recombination of electron–hole pairs; on the other hand, Ag0 on the photocatalyst surface can absorb more visible light, thus further improving the photocatalytic performance.
4. Conclusions
A series of Ag/AgBr/Ag3VO4 composites were synthesized by a simple continuous precipitation method. The degradation rates of the sample S2 for MO and TC were 98.6% and 77%, which were better than those of the single photocatalysts Ag3VO4 and Ag/AgBr, indicating that S2 had a better degradation effect on MO and TC in an aqueous solution. In addition, the evidence that h+ and ·O2− were the main active substances in the degradation process of the pollutant MO was obtained by conducting active group capture experiments. The results of PL, EIS and photocurrent response show that the composite exhibits better charge separation efficiency, and the surface plasmon resonance (SPR) effect of Ag0 together improves the photocatalytic performance of the composite. As a highly efficient photocatalyst, Ag/AgBr/Ag3VO4 is a promising photocatalyst for wastewater purification.
Conflicts of interest
The authors declare that they have no conflict of interest.
Acknowledgements
The authors gratefully acknowledge the financial supports provided by the Guizhou Province High-level Talent Training Program [Talent[2016]5658].
References
- E. Forgacs, T. Cserháti and G. Oros, Environ. Int., 2004, 30, 953–971 CrossRef CAS PubMed.
- W.-K. Jo and R. J. Tayade, Chin. J. Catal., 2014, 35, 1781–1792 CrossRef CAS.
- S. Natarajan, H. C. Bajaj and R. J. Tayade, J. Environ. Sci., 2018, 65, 201–222 CrossRef PubMed.
- H. S. Rai, M. S. Bhattacharyya, J. Singh, T. K. Bansal, P. Vats and U. C. Banerjee, Crit. Rev. Env. Sci. Technol., 2005, 35, 219–238 CrossRef CAS.
- J. Hu, P. Zhang, W. An, L. Liu, Y. Liang and W. Cui, Appl. Catal., B, 2019, 245, 130–142 CrossRef CAS.
- L. Liu, M. Yue, J. Lu, J. Hu, Y. Liang and W. Cui, Appl. Surf. Sci., 2018, 456, 645–656 CrossRef CAS.
- Y. Zhang, W. Cui, W. An, L. Liu, Y. Liang and Y. Zhu, Appl. Catal., B, 2018, 221, 36–46 CrossRef CAS.
- W. Cui, J. He, H. Wang, J. Hu, L. Liu and Y. Liang, Appl. Catal., B, 2018, 232, 232–245 CrossRef CAS.
- Y. Yang, W. Zhang, R. Liu, J. Cui and C. Deng, Sep. Purif. Technol., 2018, 190, 278–287 CrossRef CAS.
- J. Kou, C. Lu, J. Wang, Y. Chen, Z. Xu and R. S. Varma, Chem. Rev., 2017, 117, 1445–1514 CrossRef CAS PubMed.
- L. V. Bora and R. K. Mewada, Renewable Sustainable Energy Rev., 2017, 76, 1393–1421 CrossRef CAS.
- F. K. Mohamad Alosfur, N. J. Ridha, M. H. H. Jumali and S. Radiman, Nanotechnology, 2018, 29, 145707 CrossRef PubMed.
- M. Hadnadjev-Kostic, T. Vulic and R. Marinkovic-Neducin, Adv. Powder Technol., 2014, 25, 1624–1633 CrossRef CAS.
- V. Moradi, M. B. G. Jun, A. Blackburn and R. A. Herring, Appl. Surf. Sci., 2018, 427, 791–799 CrossRef CAS.
- X.-N. Wei, H.-L. Wang, X.-K. Wang and W.-F. Jiang, Appl. Surf. Sci., 2017, 412, 357–365 CrossRef CAS.
- C. Mu, Y. Zhang, W. Cui, Y. Liang and Y. Zhu, Appl. Catal., B, 2017, 212, 41–49 CrossRef CAS.
- G. Wang, X. Ma, B. Huang, H. Cheng, Z. Wang, J. Zhan, X. Qin, X. Zhang and Y. Dai, J. Mater. Chem., 2012, 22, 21189–21194 RSC.
- L. Liu, L. Ding, Y. Liu, W. An, S. Lin, Y. Liang and W. Cui, Appl. Catal., B, 2017, 201, 92–104 CrossRef CAS.
- O. Mehraj, N. A. Mir, B. M. Pirzada, S. Sabir and M. Muneer, J. Mol. Catal. A: Chem., 2014, 395, 16–24 CrossRef CAS.
- P. Wang, B. Huang, Q. Zhang, X. Zhang, X. Qin, Y. Dai, J. Zhan, J. Yu, H. Liu and Z. Lou, Chem.–Eur. J., 2010, 16, 10042–10047 CrossRef CAS PubMed.
- Z. Lou, B. Huang, Z. Wang, X. Ma, R. Zhang, X. Zhang, X. Qin, Y. Dai and M.-H. Whangbo, Chem. Mater., 2014, 26, 3873–3875 CrossRef CAS.
- J. Liu, W. Wu, Q. Tian, Z. Dai, Z. Wu, X. Xiao and C. Jiang, Dalton Trans., 2016, 45, 12745–12755 RSC.
- Y. Zhao, L. Kuai and B. Geng, Catal. Sci. Technol., 2012, 2, 1269–1274 RSC.
- A. Abulizi, K. Kadeer, L. Zhou, Y. Tursun and T. Dilinuer, J. Taiwan Inst. Chem. Eng., 2018, 88, 243–251 CrossRef CAS.
- P. Wang, B. Huang, X. Zhang, X. Qin, H. Jin, Y. Dai, Z. Wang, J. Wei, J. Zhan, S. Wang, J. Wang and M. H. Whangbo, Chem.–Eur. J., 2009, 15, 1821–1824 CrossRef CAS PubMed.
- F. Chen, W. An, L. Liu, Y. Liang and W. Cui, Appl. Catal., B, 2017, 217, 65–80 CrossRef CAS.
- S. Lin, L. Liu, J. Hu, Y. Liang and W. Cui, Appl. Surf. Sci., 2015, 324, 20–29 CrossRef CAS.
- R. Konta, H. Kato, H. Kobayashi and A. Kudo, Phys. Chem. Chem. Phys., 2003, 5, 3061–3065 RSC.
- Y. Xu, L. Jing, X. Chen, H. Ji, H. Xu, H. Li, H. Li and Q. Zhang, RSC Adv., 2016, 6, 3600–3607 RSC.
- M. Yan, Y. Wu, F. Zhu, Y. Hua and W. Shi, Phys. Chem. Chem. Phys., 2016, 18, 3308–3315 RSC.
- M. Yan, Y. Wu, Y. Yan, X. Yan, F. Zhu, Y. Hua and W. Shi, ACS Sustainable Chem. Eng., 2015, 4, 757–766 CrossRef.
- F. Kiantazh and A. Habibi-Yangjeh, Solid State Sci., 2015, 49, 68–77 CrossRef CAS.
- T. Zhu, Y. Song, H. Ji, Y. Xu, Y. Song, J. Xia, S. Yin, Y. Li, H. Xu, Q. Zhang and H. Li, Chem. Eng. J., 2015, 271, 96–105 CrossRef CAS.
- J. Zhang and Z. Ma, Molecular Catalysis, 2017, 436, 190–198 CrossRef CAS.
- Q. Zhu, W.-S. Wang, L. Lin, G.-Q. Gao, H.-L. Guo, H. Du and A.-W. Xu, J. Phys. Chem. C, 2013, 117, 5894–5900 CrossRef CAS.
- S. Huang, Y. Xu, Z. Chen, M. Xie, H. Xu, M. He, H. Li and Q. Zhang, RSC Adv., 2015, 5, 71035–71045 RSC.
- J. Zhang and Z. Ma, J. Colloid Interface Sci., 2018, 524, 16–24 CrossRef CAS PubMed.
- Z. Wang, J. Zhang, J. Lv, K. Dai and C. Liang, Appl. Surf. Sci., 2017, 396, 791–798 CrossRef CAS.
- L. Jing, Y. Xu, C. Qin, J. Liu, S. Huang, M. He, H. Xu and H. Li, Mater. Res. Bull., 2017, 95, 607–615 CrossRef CAS.
- M. Gaumet, A. Vargas, R. Gurny and F. Delie, Eur. J. Pharm. Biopharm., 2008, 69, 1–9 CrossRef CAS PubMed.
- R. Cao, H. Yang, X. Deng, S. Zhang and X. Xu, Sci. Rep., 2017, 7, 15001 CrossRef PubMed.
- B. Wiley, Y. Sun, B. Mayers and Y. Xia, Chem. Eur. J., 2005, 11, 454–463 CrossRef CAS PubMed.
- Y. Song, S. Xue, G. Wang, J. Jin, Q. Liang, Z. Li and S. Xu, J. Phys. Chem. Solids, 2018, 121, 329–338 CrossRef CAS.
- T. Li, Y. He, H. Lin, J. Cai, L. Dong, X. Wang, M. Luo, L. Zhao, X. Yi and W. Weng, Appl. Catal., B, 2013, 138–139, 95–103 CrossRef CAS.
- S. Zhang, H. Gao, X. Liu, Y. Huang, X. Xu, N. S. Alharbi, T. Hayat and J. Li, ACS Appl. Mater. Interfaces, 2016, 8, 35138–35149 CrossRef CAS PubMed.
- J. Zhang and Z. Ma, J. Taiwan Inst. Chem. Eng., 2018, 88, 177–185 CrossRef CAS.
- K. Dai, D. Li, L. Lu, Q. Liu, C. Liang, J. Lv and G. Zhu, Appl. Surf. Sci., 2014, 314, 864–871 CrossRef CAS.
- S. Wang, D. Li, C. Sun, S. Yang, Y. Guan and H. He, Appl. Catal., B, 2014, 144, 885–892 CrossRef CAS.
- Y. Wan, C. Liang, Y. Xia, W. Huang and Z. Li, Appl. Surf. Sci., 2017, 396, 48–57 CrossRef CAS.
|
| This journal is © The Royal Society of Chemistry 2019 |
Click here to see how this site uses Cookies. View our privacy policy here.  Open Access Article
 *ab,
Xianyu Leia and
Shang Gonga
![[thin space (1/6-em)]](https://www.rsc.org/images/entities/char_2009.gif) :
:![[thin space (1/6-em)]](https://www.rsc.org/images/entities/char_2009.gif) 1 sample reached 98.6%. The EIS and photocurrent results demonstrated that the enhancement of the visible light photocatalytic activity was attributed to the efficient electron–hole pair separation. In addition, the scavenging reactions conducted via the addition of different scavengers confirmed that h+ and ·O2− were the main active species in the reaction. The present study offers potential for the degradation of contaminants.
1 sample reached 98.6%. The EIS and photocurrent results demonstrated that the enhancement of the visible light photocatalytic activity was attributed to the efficient electron–hole pair separation. In addition, the scavenging reactions conducted via the addition of different scavengers confirmed that h+ and ·O2− were the main active species in the reaction. The present study offers potential for the degradation of contaminants.![[thin space (1/6-em)]](https://www.rsc.org/images/entities/char_2009.gif) :
:![[thin space (1/6-em)]](https://www.rsc.org/images/entities/char_2009.gif) 1, 5
1, 5![[thin space (1/6-em)]](https://www.rsc.org/images/entities/char_2009.gif) :
:![[thin space (1/6-em)]](https://www.rsc.org/images/entities/char_2009.gif) 1, 7
1, 7![[thin space (1/6-em)]](https://www.rsc.org/images/entities/char_2009.gif) :
:![[thin space (1/6-em)]](https://www.rsc.org/images/entities/char_2009.gif) 1, and 9
1, and 9![[thin space (1/6-em)]](https://www.rsc.org/images/entities/char_2009.gif) :
:![[thin space (1/6-em)]](https://www.rsc.org/images/entities/char_2009.gif) 1, and the corresponding samples were denoted as S1, S2, S3, S4. In brief, pure Ag/AgBr was prepared by precipitation of 3 mmol AgNO3 with 3 mmol KBr followed by photoreduction for 20 minutes. Ag3VO4 was obtained by precipitation of 6 mmol AgNO3 with 2 mmol Na3VO4.
1, and the corresponding samples were denoted as S1, S2, S3, S4. In brief, pure Ag/AgBr was prepared by precipitation of 3 mmol AgNO3 with 3 mmol KBr followed by photoreduction for 20 minutes. Ag3VO4 was obtained by precipitation of 6 mmol AgNO3 with 2 mmol Na3VO4.
![[thin space (1/6-em)]](https://www.rsc.org/images/entities/char_2009.gif) 000 rpm for 5 min to separate the catalyst from the solution. Analysis of the absorbance of the supernatant at each of the abovementioned intervals was performed using a UV-vis spectrophotometer. The role of various active species in the photocatalytic system was investigated by adding different active species capture agents, including 0.2 g ammonium oxalate (AO), 3 mL isopropanol (IPA) and 8 mg benzoquinone (BQ), to the solution.
000 rpm for 5 min to separate the catalyst from the solution. Analysis of the absorbance of the supernatant at each of the abovementioned intervals was performed using a UV-vis spectrophotometer. The role of various active species in the photocatalytic system was investigated by adding different active species capture agents, including 0.2 g ammonium oxalate (AO), 3 mL isopropanol (IPA) and 8 mg benzoquinone (BQ), to the solution.


