 Open Access Article
Reusable bentonite clay: modelling and optimization of hazardous lead and p-nitrophenol adsorption using a response surface methodology approach
Mohamed Zbair *a,
Zakaria Anfar
 b and
Hassan Ait Ahsaine
 b
b
aLaboratory of Catalysis and Corrosion of Materials, Chouaïb Doukkali University, Faculty of Sciences El Jadida, BP. 20, El Jadida 24000, Morocco. E-mail: zbair.mohamed@gmail.com
bMaterials and Environment Laboratory, Ibn Zohr University, Faculty of Sciences, Agadir, Morocco
First published on 15th February 2019
Abstract
In this work, bentonite clay (BC) calcined at 500 °C was used as an adsorbent (BC-500) for the adsorption of Pb2+ and p-nitrophenol. The ability of BC-500 for the removal of Pb2+ and p-nitrophenol has been investigated. The adsorption studies tailored well the pseudo-first-order and the Langmuir model for Pb2+ and p-nitrophenol both. In addition, the optimal removal of Pb2+ and p-nitrophenol was found at pH 5 for Pb2+ and pH 6 for p-nitrophenol. However, the change of temperature (20–60 °C) was found to have a negative effect on the adsorption process on BC-500. Based on the Dubinin–Radushkevich model the adsorption occurs via a physical process. Accordingly, the adsorption mechanism was proposed using N2-physisorption analysis before and after adsorption of Pb2+ and p-nitrophenol. The reusability of BC-500 was examined and the outcomes recommended that BC-500 had good potential as an economic and proficient adsorbent for Pb2+ or p-nitrophenol from contaminated water. Finally, the experimental Pb2+ and p-nitrophenol removal efficiency were found to be 90.93 ± 2.15% and 98.06 ± 1.87% while the predicted value by model equals 91.28 ± 1.68 and 97.24 ± 2.54, respectively, showing that the predicted model values are in good agreement with the experimental value.
1. Introduction
At present, pollution caused by organic and inorganic compounds is a major problem for the world and is likely to cause health hazards, harm to ecology, damage to structures or amenities, and interference with the legitimate use of water.1 Industries such as papermaking, electroplating, metal finishing, textiles, storage batteries, lead smelting, mining, plating, ceramics, leather, food, rubber, cosmetics, and plastics use different chemical compounds, which makes it possible to produce toxic effluents containing organic and inorganic contaminants.2 Lead (Pb) is one of the most toxic elements, even at low concentrations, because of its presence in automobile fuel and the subsequent emission into the atmosphere in the exhaust gases.3 Pb(II) metals affect the central nervous system, kidneys, liver, and gastrointestinal system, and may directly or indirectly cause diseases such as anemia, encephalopathy, hepatitis, and the nephrotic syndrome.4 p-Nitrophenol is another toxic pollutant (found particularly in the effluents from pesticides, pharmaceuticals, petrochemicals, and other industries) with an impact on many organisms that live in aquatic ecosystems. The presence of p-nitrophenol and its analogues in the environment has become a great concern in recent years because of their increased discharge, toxic nature and adverse effects on the receiving water bodies.5 Moreover, p-nitrophenol is responsible to cause degeneration in human proteins, tissue erosion, paralysis of the central nervous system, and damage to the liver, kidney and pancreas.6 As a priority toxin (US Environmental Protection Agency) because of its potential harm on aquatic life, plants and human beings even at low concentrations. p-Nitrophenol is a common constituent of contaminated soil, ground water or leachate.7,8 Hence, p-nitrophenol may cause severe environmental and public health problems, and it is mandatory to be treated before being discharged into the environment.The wide usage of Pb(II) and p-nitrophenol in various industries have triggered the necessities of developing an efficient method to remove these pollutants from wastewaters.9 The most common methods for removal of these pollutants from industrial effluents include chemical precipitation, oxidation, and ion exchanges and adsorption etc.7,8,10 Adsorption process belongs to this category and it is found to be very effective and is applied in the liquid phase.1,11–20 Many adsorbents have been tested on the adsorption of Pb2+ and p-nitrophenol. For instance, Tran et al.11 have been reported 4.112 mmol g−1 of Pb2+ adsorption capacity using phenylalanine–Mg/AL(LDH). Yuanqing Huang et al.21 have utilized a nitrilotriacetic acid anhydride modified ligno-cellulosic material (NTAA-LCM) toward Pb2+ removal and indicated an adsorption capacity of 303.5 mg g−1 at 298 K. Also, Pb2+ was biosorbed using waste biomass (160 mg g−1 at 25 °C).22 For p-nitrophenol removal, Q. Zhang et al.23 have been found an adsorption capacity of 102 mg g−1 by ZnAl-layered double hydroxides. B. Liu et al.24 reached a capacity of 11 mg g−1 by coal fly ash. Furthermore, Muthanna J. Ahmed et al.25 have been utilized microporous activated carbon with an adsorption capacity of 185 mg g−1.
In recent years, clays are alternative solutions for acting as activated carbon. Clays have been used for thousands of years and continue to be among the leading industrial material because they are natural, earthy and fine-grained material.26 For a long time, clays have been also used for adsorption of various organic, inorganic substances due to its low cost and high removal efficiency (high surface area and exchange capacities).10,27–31 However, on our knowledge there is lack of information on the adsorption of Pb(II) and p-nitrophenol especially on bentonite clay and the effect of some variables on its adsorption capacity, optimization using response surface methodology and regeneration. The Response Surface Methodology (RSM) is a collection of mathematical and statistical techniques useful for the modeling and analysis of problems in which response of interest is affected by several variables (Kumar et al., 2017). Several published paper has been reported the utilization of RSM for the optimization and verification of scientific researches and industrial studies.32–34
In this research, bentonite clay (BC) from the region of Safi (Morocco) has been used as an adsorbent to remove Pb2+ and p-nitrophenol from aqueous solution. Adsorption experiments have been performed to look for equilibrium as well as adsorption kinetics. The experimental data were compared with by others studies and adsorption mechanism was proposed. RSM approach also was applied to determine the optimum removal efficiency and also to explain the relations between Pb2+ and p-nitrophenol removal and the pertinent parameters.
2. Experimental
2.1. Adsorbent's preparation
The adsorbent used in this study is the bentonite clay (BC) from the region of Safi (Morocco). The BC was primarily washed several times and then milled and sieved, acquiring the average diameter of 10 μm. The clay was subsequently calcined over 500 °C in a muffle for a period of 6 h. The calcination process is used in order to increase the adsorbent's stability. The obtained material was labeled: BC-500.2.2. Characterization of adsorbent
BC-500 was analyzed using the X-ray diffraction (diffractometer Bruker D8 Advanced). Copper Kα radiation (λ = 1.5406 nm) produced at 50 kV and 20 mA. Infrared Spectra of BC-500 was recorded using Fourier Transform Spectrometer (Shimadzu FTIR-8400S) with a resolution of 4 cm−1 and 20 scans (400 to 4000 cm−1). The surface area of BC-500 was determined using Micromeritics ASAP 2010. Scanning Electron Microscopy analysis was done using (Hitachi S2500, Japan). Scanning electron microscopy (SEM) analyses were performed using FEI, Quanta 200-ESEM operated at 20 kV. X-Ray fluorescence elemental analysis of BC-500 was done using Philips spectrophotometer equipment. The PZC (point zero charge) is the pH at which the surface has zero net charge; known as pHpzc it is characteristic for amphoteric surfaces and affected by the type of surface sites and the structure. For the PZC determination 0.20 g of BC-20 were mixed with 50 mL of 0.01 M NaCl solution for 2 days. The starting solutions pH (2.0 to 12.0) was adjusted using HCl and NaOH. After 2 days, the final pH was measured. The point of zero charge of the AC-HP (pHpzc) is the point where the curve pHfinal versus pHinitial crosses the line pHinitial = pHfinal.16,35–372.3. Adsorbate
Stock solutions (1000 mg L−1) of tested adsorbate were prepared by dissolving p-nitrophenol (Sigma-Aldrich) in double distilled water and Pb2+ was prepared by dissolving Pb(NO3)2 (Sigma-Aldrich) in 1% HNO3 solution to avoid hydrolysis formation and precipitation. The working solution was prepared by diluting stock solution to appropriate volumes.2.4. Adsorption experiments
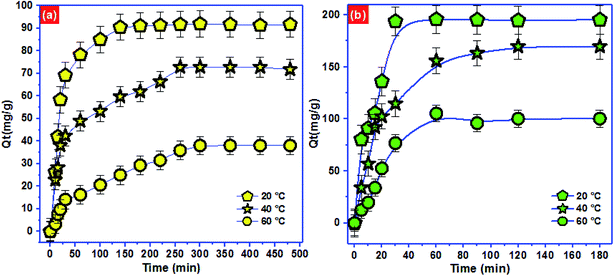
Adsorption experiment was executed in duplicate, and the results were averaged. If the bias of the repeated experiment exceeded 15%, a triplicate run was performed.The influence of the initial pH on adsorption of Pb2+ and p-nitrophenol onto BC-500 was observed by adjusting the pH value (2.0–12.0) at 20 °C by using 0.5 M HCl or 0.5 M NaOH prior to the experiments. Kinetics essays were carried out at three temperatures (20, 40, and 60 °C) in an Erlenmeyer by mixing 100 mg of BC-500 with 200 mL of Pb2+ and p-nitrophenol solution (concentration of 50 mg L−1). The system was constantly shaken in order to keep the mixture's homogeneity and aliquots were collected at different time intervals (Pb2+: 0–500 min and p-nitrophenol: 0–180 min). For adsorption equilibrium studies: various Pb2+ and p-nitrophenol solutions with different initial concentration at 20 °C (5–200 mg L−1 for Pb2+ and from 10–600 mg L−1 for p-nitrophenol). After the specified time, suspensions were filtered through filter paper Whatman 44. The concentration of the supernatant liquid of Pb2+ was determined by the absorption spectrophotometer AA-670. However, the concentration of p-nitrophenol was determined at λmax = 315 nm using UV-Vis spectrophotometer spectrometry (Shimadzu-2600). Diverse theoretical kinetic and isotherm models are applied to experimental data in order to determine the best-fitting model Table 1.
| Formula | Utility | Parameters | Ref. |
|---|---|---|---|
 |
Adsorption capacity | C0 (mg L−1) and Ce,t (mg L−1) are the initial and equilibrium concentrations, respectively. m (g) is the weight of adsorbent and V (L) is the volume | 38 |
 |
Removal efficiency | 39 | |
| Qt = Qcal(1 − expK1t) | Pseudo-first-order | Qe (mg g−1) and Qt (mg g−1) are the adsorbed amounts at equilibrium and at times t (min), respectively. K1 (min−1): the rate constant; K2 (g mg−1 min−1): rate constant | 40 |
 |
Pseudo-second-order | 41 | |
 |
Intraparticle diffusion | Kip (mg g−1 min−1/2): rate coefficient; C: thickness of the boundary layer | 42 |
 |
Langmuir isotherm | KL: direct measure of the intensity of the adsorption process; Qm: maximum adsorption capacity | 43 |
 |
Adsorption feasibility | The adsorption process can be de fined as irreversible (RL = 0), favorable (RL between 0 and 1), linear (RL = 1) or unfavorable (RL < 1) | 44 |
 |
Freundlich isotherm | KF: adsorption capacity; n: adsorption behavior | 45 |
 |
Dubinin–Radushkevich isotherm | QDR (mg g−1) the theoretical adsorption capacity; KDR (mol2 kJ−2) the constant related to adsorption energy and ε the Polanyi potential; EDR (kJ mol−1) is the mean free energy of adsorption | 46–48 |
 |
|||
 |
|||
ΔG° = −RT![[thin space (1/6-em)]](https://www.rsc.org/images/entities/char_2009.gif) ln ln![[thin space (1/6-em)]](https://www.rsc.org/images/entities/char_2009.gif) Kc Kc |
Gibbs free energy | ΔG°: Gibbs free energy change; Kc: an equilibrium constant (dimensionless); R: gas constant; T: temperature | 49–51 |
 |
Van't Hoff | ΔS°: entropy change; ΔH°: enthalpy change |
2.5. Response surface methodology (RSM) technique
Among the methods used to optimize and modeling the adsorption process is the experimental methodology designs, more precisely the optimization by the RSM.15 This method has attracted the attention of researchers in recent years.32–34 Response surface methodology (RSM) was used to obtain optimum operational parameters.52,53 The experimental levels for lead and p-nitrophenol adsorption were presented in Tables 2 and 3, respectively. The experimental results, as well as the CCD matrix, were shown in Table 4. Therefore, the quadratic polynomial equation that links the response lead and p-nitrophenol removal with three studied parameters were presented in equations below.where Y is the predicted response lead or p-nitrophenol adsorption, b0 is the intercept coefficient, bi the linear terms, bii the squared terms, bij the interaction terms, and X1, X2 and X3 represent the coded independent variables of pH, temperature and concentration, respectively.
| Variable | Factor | Unit | −1.68(α) | −1 | 0 | 1 | +1.68(α) |
|---|---|---|---|---|---|---|---|
| X1 | pH | — | 2.63 | 4 | 6 | 8 | 9.36 |
| X2 | Temperature | °C | 11.59 | 15 | 20 | 25 | 28.40 |
| X3 | Concentration | mg L−1 | 39.90 | 44 | 50 | 56 | 60.09 |
| Variable | Factor | Unit | −1.68(α) | −1 | 0 | 1 | +1.68(α) |
|---|---|---|---|---|---|---|---|
| X1 | pH | — | 1.63 | 3 | 5 | 8 | 8.36 |
| X2 | Temperature | °C | 11.59 | 15 | 20 | 25 | 28.40 |
| X3 | Concentration | mg L−1 | 39.90 | 44 | 50 | 56 | 60.09 |
| No. exp. | X1 | X2 | X3 | Lead adsorption removal% | p-Nitrophenol adsorption removal% |
|---|---|---|---|---|---|
| 1 | −1 | −1 | −1 | 32.52 | 48.23 |
| 2 | 1 | −1 | −1 | 80.54 | 72.71 |
| 3 | −1 | 1 | −1 | 43.30 | 51.21 |
| 4 | 1 | 1 | −1 | 81.62 | 63.62 |
| 5 | −1 | −1 | 1 | 36.46 | 45.45 |
| 6 | 1 | −1 | 1 | 67.50 | 66.60 |
| 7 | −1 | 1 | 1 | 33.41 | 48.48 |
| 8 | 1 | 1 | 1 | 58.56 | 56.82 |
| 9 | −α | 0 | 0 | 3.44 | 10.20 |
| 10 | α | 0 | 0 | 61.47 | 30.21 |
| 11 | 0 | −α | 0 | 76.82 | 77.85 |
| 12 | 0 | α | 0 | 75.84 | 73.20 |
| 13 | 0 | 0 | −α | 73.48 | 88.86 |
| 14 | 0 | 0 | α | 52.02 | 80.29 |
| 15 | 0 | 0 | 0 | 91.68 | 97.64 |
| 16 | 0 | 0 | 0 | 92.92 | 97.74 |
| 17 | 0 | 0 | 0 | 91.48 | 96.44 |
3. Results and discussion
3.1. Characterization of BC-500
XRD pattern of the BC-500 exhibited mostly smectite described by the reflection of d(001) = 1.54 nm and minor impurities of quartz (Fig. 1a). Moreover, XRD of BC-500 presented the specific reflections consistent to d values of 1.54 nm (001), 0.50 nm (003), 0.37 nm (004) and 0.29 nm (005) for the basal values for smectites.54 However, the reflexion of d(003) = 0.44 nm, d(110) = 0.25 nm, and d(210) = 0.16 nm is attributed to the presence of montmorillonite.55,56 The reflection of d(060) = 0.14 nm is linked to a dioctahedral smectite in which the high intensity of d060 reflection designated a large size of the coherent domains along the b direction.54,57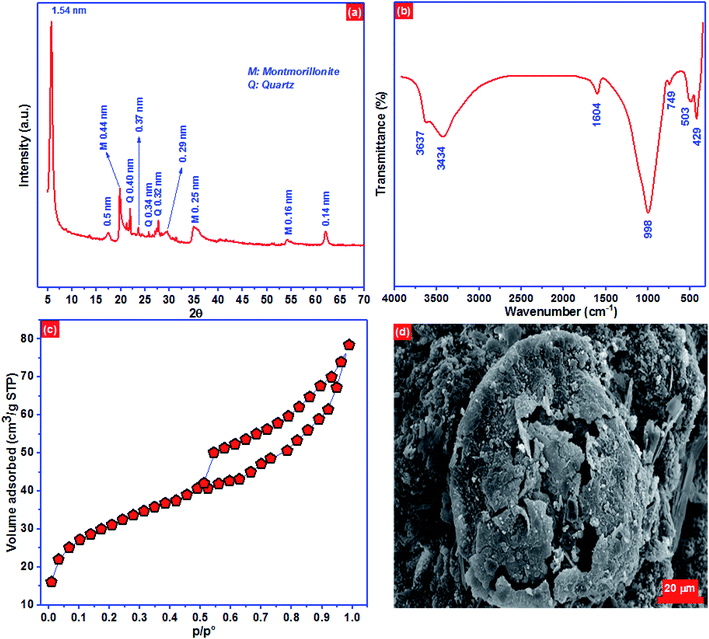 | ||
| Fig. 1 (a) XRD pattern, (b) FTIR spectra, (c) N2 physisorption isotherm and (d) the surface morphology of BC-500. | ||
FTIR spectra can reveal the surface functional groups on BC-500 surface qualitatively based on the typical absorbed energy for each bond in certain groups.58 The surface functional groups in BC-500 are depicted in Fig. 1b. The peak located at 3637 cm−1 is ascribed to the groups stretching vibrations OH coordinated octahedral layer to Al(Mg)–O–H.59,60 At 3434 cm−1 the peak corresponds to OH stretching of structural hydroxyl groups. The peak at 1604 cm−1 is associated with H–O–H deformation of water. However, the peaks observed at around 998 and 749 cm−1 are linked to Si–O–Si and Si–O stretching of silica and quartz.61 The peaks at 503 and 429 cm−1 are assigned to Al–O–Si and Si–O deformation, respectively.56
Nitrogen physisorption isotherm of BC-500 presented in Fig. 1c, represent type IV adsorption isotherm with type H3 hysteresis loops which are characteristics of slit-like pore materials. The noticeable hysteresis loop can be seen on the BC-500 isotherm, signifying the existence of capillary condensation and the presence of mesopores. The BET surface area, total pore volume, and pore size of BC-500 are 101.2 m2 g−1, 0.26 cm3 g−1, and 4.8 nm, respectively. The surface morphology of BC-500 (Fig. 1d) shows porous and heterogeneous structures. This result is also in accord with the specific surface area of BC-500.
Elementary chemical analysis by X-ray fluorescence (Table 5) displays that Al2O3 and SiO2 are the principal elements with a ratio of SiO2/Al2O3 equal to 2.11. This value and the low content of K2O (0.20%) designate that the BC-500 used in this work belongs to the family of smectite.62 Moreover, the existence of exchangeable cations such as Ca2+, Na+, and Mg2+ indicates that the analyzed BC-500 has a high cation exchange capacity. These outcomes are entirely consistent with those stated by Er-ramly and Ider.63
| SiO2 | Al2O3 | MgO | Na2O | Fe2O3 | TiO2 | CaO | K2O | P2O5 | LOI | Total |
|---|---|---|---|---|---|---|---|---|---|---|
| 54.11 | 25.62 | 5.12 | 1.02 | 1.20 | 0.29 | 2.62 | 0.20 | 0.03 | 9.48 | 99.69 |
3.2. Adsorption of Pb2+ and p-nitrophenol
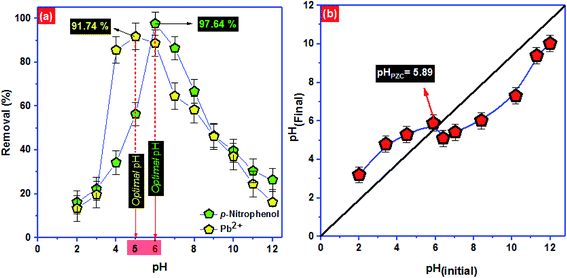
The removal efficiency increased from 13.4 to 91.74% for Pb2+ and 16.2–97.64% for p-nitrophenol by increasing the solution pH from 2.0 to 5.0 for Pb2+ and 2.0 to 6.0 for p-nitrophenol. However, the adsorption starts decreasing by 16.2 and 26.4% at pH 12.0 for Pb2+ and p-nitrophenol, respectively (Fig. 2a). The surface of the BC-500 has the point of zero charges (pHpzc) at about 5.89 (Fig. 2b). The decrease in H3O+ with increasing pH in the acidic solution might increase the electrostatic attraction between the positively charged surface of the BC-500 and the partially negative charge of the p-nitrophenol molecules, consequently increasing the adsorption. The BC-500 surface starts to develop a partial negative charge at pH higher than pHpzc (5.89) and the p-nitrophenol molecules exists as deprotonated from (p-nitrophenolate anion) at pH > pKa = 7.15,67 this forms an electrostatic repulsions between the negatively charges p-nitrophenol molecules and negative surface of BC-500, which is consistent with previous studies.5,68,69
At pH value between 2.0 to 4.0, the low removal of Pb2+ may be due to the competition with H+ ions on active sites of BC-500. Furthermore, the decrease in the removal efficiency at pH values (6.0–12.0) might be linked to the formation of Pb(OH)2 and an insoluble precipitate of Pb2+.70 In most of the stated studies regarding heavy metal ions adsorption onto various adsorbent, the adsorption removal displays a maximum for an initial pH at around 5.70–74
| Pseudo-first-order | Pseudo-second-order | |||||||
|---|---|---|---|---|---|---|---|---|
| Qe,exp (mg g−1) | Qe,cal (mg g−1) | K1 (min−1) | R2 | Qe,cal (mg g−1) | K2 (g mg−1 min−1) | R2 | ||
| Pb2+ | 20 °C | 91.74 | 90.66 ± 1.07 | 0.043 | 0.988 | 97.96 ± 1.84 | 0.0006 | 0.980 |
| 40 °C | 71.74 | 75.09 ± 1.76 | 0.031 | 0.976 | 67.51 ± 7.12 | 0.0005 | 0.930 | |
| 60 °C | 38.04 | 38.78 ± 1.45 | 0.008 | 0.982 | 47.90 ± 2.24 | 0.0002 | 0.973 | |
| p-Nitrophenol | 20 °C | 195.36 | 197.66 ± 7.29 | 0.066 | 0.961 | 219.13 ± 12.07 | 0.0004 | 0.948 |
| 40 °C | 169.71 | 168.08 ± 3.04 | 0.044 | 0.993 | 196.66 ± 5.86 | 0.0003 | 0.990 | |
| 60 °C | 100.36 | 104.53 ± 5.18 | 0.034 | 0.993 | 128.18 ± 12.23 | 0.0003 | 0.939 | |
| Intraparticle diffusion | ||||
|---|---|---|---|---|
| Kip | C | R2 | ||
| Pb2+ | 20 °C | 3.47 | 33.39 ± 8.19 | 0.705 |
| 40 °C | 2.99 | 18.48 ± 4.08 | 0.877 | |
| 60 °C | 1.94 | 1.079 ± 1.36 | 0.861 | |
| p-Nitrophenol | 20 °C | 13.91 | 54.18 ± 21.22 | 0.740 |
| 40 °C | 13.44 | 24.10 ± 1.78 | 0.876 | |
| 60 °C | 8.84 | 5.93 ± 1.42 | 0.828 | |
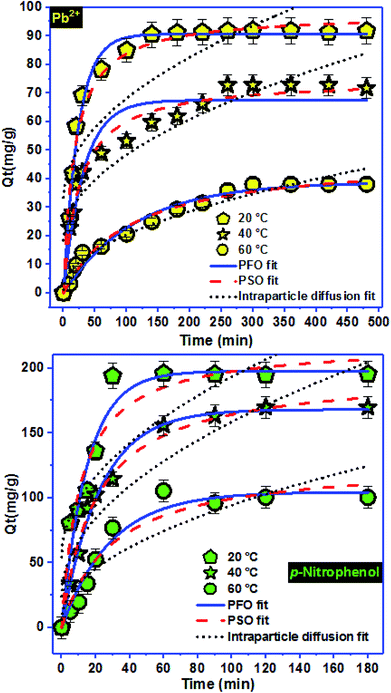
To approve the best model that describe the adsorption kinetics of Pb2+ and p-nitrophenol onto BC-500, we usually compare the value of correlation coefficients and standard error of estimate (SEE) allowing the correlation between experimental data and the model-predicted values. The nonlinear plots of Pb2+ and p-nitrophenol adsorption kinetics and the calculated kinetic parameters are given in Fig. 4 and Table 6. As can be seen, the correlation coefficients found from PFO model was higher compared with R2 gotten from PSO model. Additionally, the SEE of PFO model was the lowest one compared to PSO model. Consequently, PFO model describe well the adsorption data of Pb2+ and p-nitrophenol onto BC-500 at all studied temperature. Besides, the experimental adsorption capacity of Pb2+ and p-nitrophenol onto BC-500 were very close to the calculated one by PFO model (Table 6).
In other hand, the increase in temperature decrease the acceleration of Pb2+ and p-nitrophenol adsorption on BC-500, which was certificated by the decrease in the second-order rate constants (K2). This might be due to the increase of solution viscosity at high temperature and thus diminish the mass transfer and diffusion of the Pb2+ and p-nitrophenol inside BC-500.
Moreover, Fig. 4 displays the curve-fitting plots of IPD model for Pb2+ and p-nitrophenol onto BC-500 adsorption. The values of the intercept C of Pb2+ and p-nitrophenol give an idea about the boundary layer thickness: the larger intercept, the greater is the boundary layer effect in adsorption by BC-500. In the meantime, the plots do not pass over the origin, this specifies that there lies some degree of boundary layer control and the IPD is not the lonely rate-controlling step, but also other processes may control the rate of adsorption of Pb2+ and p-nitrophenol.75 Hence, the IPD model is not appropriate for describing the Pb2+ and p-nitrophenol removal from water onto BC-500. It can be concluding that the PFO model described well the kinetics data of Pb2+ and p-nitrophenol compared to PFO and IPD models.
| Langmuir isotherm | Freundlich isotherm | ||||||
|---|---|---|---|---|---|---|---|
| Qmax (mg g−1) | KL (L mg−1) | RL | R2 | KF ((mg g−1) (mg L−1)−n) | n | R2 | |
| Pb2+ | 94.01 | 2.97 | 0.002 | 0.942 | 46.24 | 5.93 | 0.760 |
| p-Nitrophenol | 284.25 | 16.05 | 0.0001 | 0.971 | 145.01 | 8.01 | 0.886 |
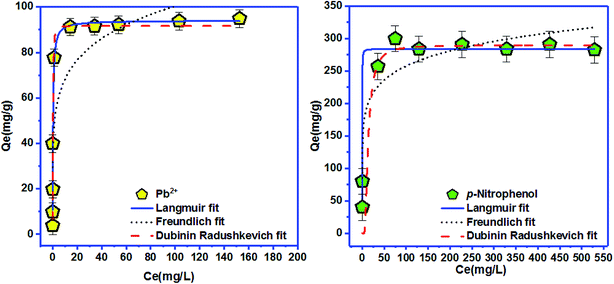
To elucidate the physical and chemical adsorption nature of Pb2+ and p-nitrophenol onto BC-500, Langmuir and Freundlich isotherms are insufficient, for this purpose D–R isotherm is normally used.30 The mean free energy of adsorption EDR (EDR of transference for 1 mol of solute from solution to the surface of CB-500 (ref. 76)), for Pb2+ and p-nitrophenol adsorption onto BC-500 was found equal to 1.386 kJ mol−1 (for Pb2+ adsorption) and 0.060 kJ mol−1 (for p-nitrophenol adsorption) (Table 7). These values are matching with other earlier studies using natural clay for adsorption in aqueous solutions.30 Following the D–R isotherm model, |E| values between 1–8 kJ mol−1 specify that the adsorption is a physical process, whereas, when |E| are between 8.0 kJ mol−1 and 16 kJ mol−1 the adsorption occurs at an ion-exchange-type surface.77 In our study, Pb2+ and p-nitrophenol adsorption onto BC-500, we found the values of EDR is in the range of 1–8 kJ mol−1, and consequently, mean that in our case the adsorption occurs via a physical process on BC-500. The adsorption capacity of BC-500 is compared to several adsorbents presented in Table 8. We found that the sorption capacity of BC-500 is better compared to others adsorbents.
| Adsorbent | Pb2+ | p-Nitrophenol | Ref. |
|---|---|---|---|
| BC-500 | 94 | 284 | This study |
| Phaseolus hulls activated carbon | 21 | — | 78 |
| Ulva lactuca (AAC) | 83 | — | 79 |
| Apricot stone | 23 | — | 80 |
| Pecan shell | 64 | — | 81 |
| Nano illite/smectite clay | 2 | — | 82 |
| ZnAl-layered double hydroxides | — | 102 | 23 |
| Microporous activated carbon | — | 185 | 25 |
| Hypercrosslinked magnetic polymer | — | 153 | 83 |
| Coal fly ash | — | 11 | 24 |
| H3PO3-treated coal | — | 256 | 84 |
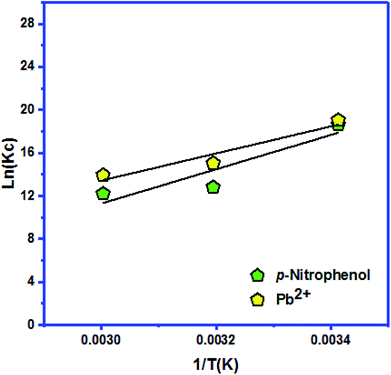
| ΔH (kJ mol−1) | ΔS (kJ mol−1 K−1) | ΔG (kJ mol−1) | ||||
|---|---|---|---|---|---|---|
| 293 K | 313 K | 333 K | ||||
| Ketoprofen | −104.499 | −0.201 | KC | 184![[thin space (1/6-em)]](https://www.rsc.org/images/entities/char_2009.gif) 568 568![[thin space (1/6-em)]](https://www.rsc.org/images/entities/char_2009.gif) 580 580 |
3![[thin space (1/6-em)]](https://www.rsc.org/images/entities/char_2009.gif) 415 415![[thin space (1/6-em)]](https://www.rsc.org/images/entities/char_2009.gif) 381.2 381.2 |
1![[thin space (1/6-em)]](https://www.rsc.org/images/entities/char_2009.gif) 126 126![[thin space (1/6-em)]](https://www.rsc.org/images/entities/char_2009.gif) 960.8 960.8 |
| −46.365 | −39.148 | −38.580 | ||||
| p-Nitrophenol | −132.467 | −0.303 | KC | 123![[thin space (1/6-em)]](https://www.rsc.org/images/entities/char_2009.gif) 915 915![[thin space (1/6-em)]](https://www.rsc.org/images/entities/char_2009.gif) 710.3 710.3 |
362![[thin space (1/6-em)]](https://www.rsc.org/images/entities/char_2009.gif) 868.435 868.435 |
199![[thin space (1/6-em)]](https://www.rsc.org/images/entities/char_2009.gif) 963.6695 963.6695 |
| −463.657 | −33.313 | −33.792 | ||||
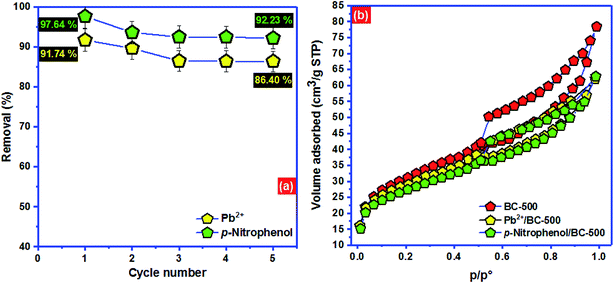 | ||
| Fig. 7 (a) Regeneration of BC-500 and (b) adsorption mechanism of Pb2+ and p-nitrophenol onto BC-500. | ||
To advance the investigation of adsorption comportment of Pb2+ and p-nitrophenol onto BC-500, Fig. 7b displays the nitrogen physisorption isotherm for BC-500 before and after adsorption of Pb2+ and p-nitrophenol. After the adsorption of Pb2+ and p-nitrophenol onto BC-500, the surface area decreases noticeably from 101.2 to 94.4 m2 g−1 and from 101.2 to 88.6 m2 g−1, respectively. The total pore volume also diminishes from 0.26 to 0.19 cm3 g−1 for Pb2+/BC-500 and from 0.26 to 0.14 cm3 g−1, which proves that the adsorbed Pb2+ and p-nitrophenol choose to be stored in the pores of BC-500 which is consistent with the outcomes of Dubinin–Radushkevich model.
| NOM | Coefficient | P-value |
|---|---|---|
| Lead adsorption | ||
| Model | — | <0.0001 |
| b0 | 92.081 | <0.0001 |
| b1 | 17.583 | <0.0001 |
| b2 | −0.130 | 0.709 |
| b3 | −5.722 | <0.0001 |
| b1-1 | −21.246 | <0.0001 |
| b2-2 | −5.733 | <0.0001 |
| b3-3 | −10.535 | <0.0001 |
| b1-2 | −1.949 | 0.00293 |
| b1-3 | −3.769 | <0.0001 |
| b2-3 | −2.981 | 0.000248 |
| Lack of fit | 0.26 | |
| R2 | 0.999 | |
| RAdj2 | 0.998 | |
![[thin space (1/6-em)]](https://www.rsc.org/images/entities/char_2009.gif) |
||
| p-Nitrophenol adsorption | ||
| Model | — | <0.0001 |
| b0 | 53.532 | <0.0001 |
| b1 | 17.249 | <0.0001 |
| b2 | 10.802 | 0.0200 |
| b3 | 8.605 | 0.0206 |
| b1-1 | −2.998 | <0.0001 |
| b2-2 | −2.689 | <0.0001 |
| b3-3 | −4.416 | <0.0001 |
| b1-2 | −0.720 | 0.0218 |
| b1-3 | −2.542 | 0.2040 |
| b2-3 | −4.090 | 0.9070 |
| Lack of fit | 0.104 | |
| R2 | 0.997 | |
| RAdj2 | 0.994 | |
• The term ‘P-value’ less than 0.05 implies that designed model is significant for both lead or p-nitrophenol.
• The correlation coefficient (R2) and the adjusted correlation coefficient (RAdj2) prove the existence of a good correlation between data.
• The coefficients significations of models were studied at the 5% confidence level and their P-values less than 0.05, except b2 for lead adsorption and b2-1, b1-3 for p-nitrophenol adsorption.
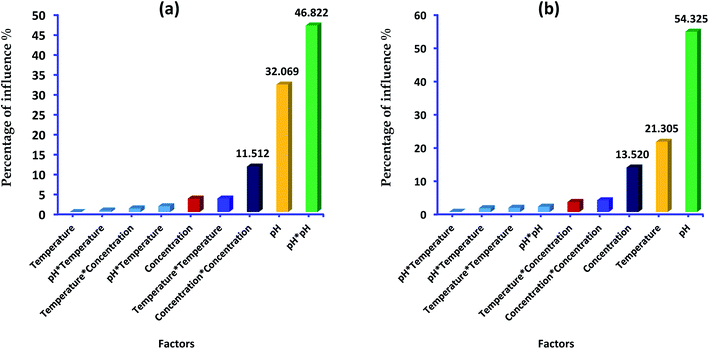
In addition, Pareto diagram presented in Fig. 8 indicates that the parameters including square effect of pH, pH and square effect of concentration represent more than 90% of response variation in the case of lead adsorption. In the case of p-nitrophenol adsorption, pH, temperature and concentration influence the removal efficiency by 54.03%, 21.30% and 13.52, respectively. As results, Pareto analysis showed that the influence of pH was very high compared with other factors in both systems, which confirms the effect of electrostatic attractions mechanism during the adsorption of lead and p-nitrophenol.
The developed models for lead or p-nitrophenol adsorption were giving below using the quadratic polynomial equation.
| R% (lead) = 92.081 + 17.583XpH − 5.722Xconcentration − 21.246XpH × XpH − 5.733XTemperature × XTemperature − 10.535Xconcentration × Xconcentration −1.949XpH × Xconcentration − 3.769XpH × Xconcentration − 2.981Xconcentration × XTemperature |
| R% (p-nitrophenol) = 53.532 + 17.249XpH + 10.802XTemperature + 8.605Xconcentration − 2.998XpH × XpH − 2.689XTemperature × XTemperature − 4.416Xconcentration × Xconcentration − 0.720XpH × XTemperature − 2.542XXpH × Xconcentration − 4.090Xconcentration × XTemperature |
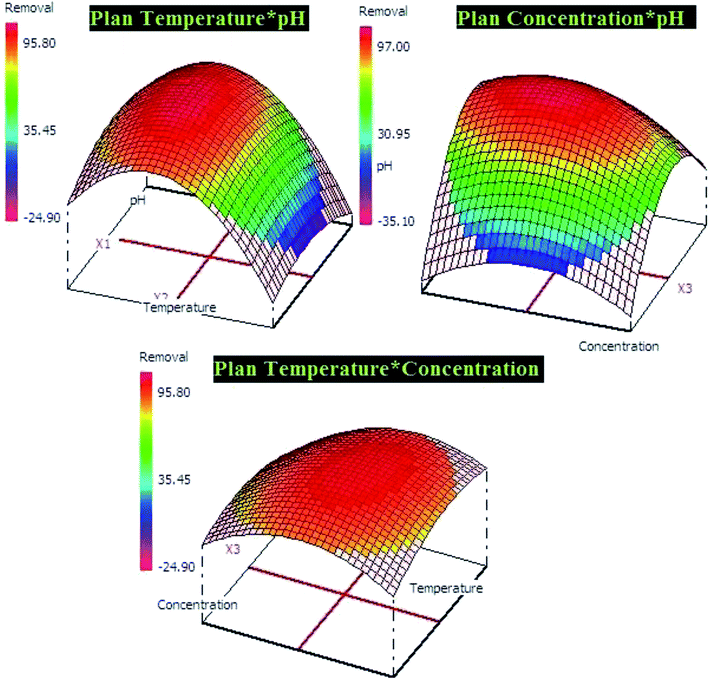
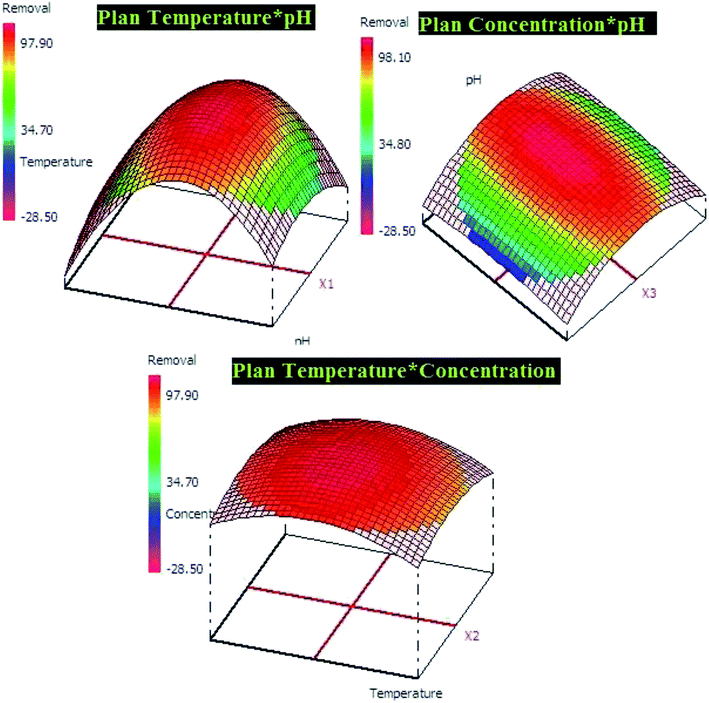
The both equations were used to elaborate the response surfaces which allows to obtain the optimization parameters of lead and p-nitrophenol adsorption and well understood the process (Fig. 9 and 10). Based on RSM presentation, the optimum conditions in term of lead and p-nitrophenol removal were showed in Table 11. Under these conditions the experimental and predicted removal by the obtained model showing a high correlation, which indicate the importance of this study in terms of modeling and optimization.
| Adsorption of lead (pH = 5.0, temperature = 20.0 °C, concentration = 50.0 mg L−1) | |
|---|---|
| Predicted | Experimental |
| 91.28 ± 1.68 | 90.93 ± 2.15 |
| Adsorption of p-nitrophenol (pH = 6.0, temperature = 20.0 °C, concentration = 50.0 mg L−1) | |
|---|---|
| Predicted | Experimental |
| 97.24 ± 2.54 | 98.06 ± 1.87 |
4. Conclusion
In this study, BC-500 as the low-cost adsorbent is talented to remove Pb2+ and p-nitrophenol from contaminated water very efficiently. The adsorption kinetic studies demonstrate that the removal of Pb2+ and p-nitrophenol is a rapid process and the adsorption process follows the pseudo-first-order model, demonstrating that Pb2+ and p-nitrophenol has a strong affinity on the BC-500 surface. It was found that the experimental isotherm data can be tailored well to the Langmuir equilibrium equation and BC-500 has very high Pb2+ and p-nitrophenol adsorption capacity of approximately 94 mg g−1 and 284 mg g−1 at 20 °C, respectively. Increasing temperature (20–60 °C) has an effect negative on adsorption capacity Pb2+ and p-nitrophenol. The removal of Pb2+ and p-nitrophenol depend clearly on the pH of the solution. The study on adsorption mechanism displays that the adsorption of Pb2+ and p-nitrophenol on BC-500 is dominated by physisorption process. Finally, the optimized parameters by the RSM method showed a good agreement between the predicted and experimental results.Conflicts of interest
Authors declare that they have no conflict of interest.Acknowledgements
This work was supported by the Ibn Zohr University, Faculty of Sciences-Morocco.References
- T. S. Anirudhan and M. Ramachandran, J. Colloid Interface Sci., 2006, 299, 116–124 CrossRef CAS PubMed.
- T. S. Anirudhan and M. Ramachandran, Process Saf. Environ. Prot., 2015, 95, 215–225 CrossRef CAS.
- A. H. Jawad, R.A. Rachid, M. A. M. Ishak and L. D. Wilson, Desalin. Water Treat., 2016, 1, 25194–25206 CrossRef.
- L. Wang, J. Zhang, R. Zhao, Y. Li, C. Li and C. Zhang, Bioresour. Technol., 2010, 101, 5808–5814 CrossRef CAS PubMed.
- B. Zhang, F. Li, T. Wu, D. Sun and Y. Li, Colloids Surf., A, 2015, 464, 78–88 CrossRef CAS.
- A. dos Santos, M. F. Viante, D. J. Pochapski, A. J. Downs and C. A. P. Almeida, J. Hazard. Mater., 2018, 355, 136–144 CrossRef CAS PubMed.
- S. Dutta, J. K. Basu and R. N. Ghar, Sep. Purif. Technol., 2001, 21, 227–235 CrossRef CAS.
- S. Haydar, M. A. Ferro-García, J. Rivera-Utrilla and J. P. Joly, Carbon, 2003, 41, 387–395 CrossRef CAS.
- W. S. W. Ngah and S. Fatinathan, J. Environ. Manage., 2010, 91, 958–969 CrossRef CAS PubMed.
- S. S. Tahir and R. Naseem, Sep. Purif. Technol., 2007, 53, 312–321 CrossRef CAS.
- H. N. Tran, C.-C. Lin and H.-P. Chao, Sep. Purif. Technol., 2018, 192, 36–45 CrossRef CAS.
- H. J. He, Z. H. Xiang, X. J. Chen, H. Chen, H. Huang, M. Wen and C. P. Yang, Int. J. Environ. Sci. Technol., 2018, 15, 1491–1500 CrossRef CAS.
- M. Zbair, Z. Anfar, H. Khallok, H. A. Ahsaine, M. Ezahri and N. Elalem, Fullerenes, Nanotubes, Carbon Nanostruct., 2018, 26, 433–442 CrossRef CAS.
- Z. Anfar, M. Zbair, H. A. Ahsaine, M. Ezahri and N. El Alem, Fullerenes, Nanotubes, Carbon Nanostruct., 2018, 26, 389–397 CrossRef CAS.
- M. Zbair, Z. Anfar, H. A. Ahsaine, N. El Alem and M. Ezahri, J. Environ. Manage., 2018, 206, 383–397 CrossRef CAS PubMed.
- M. Zbair, H. A. Ahsaine and Z. Anfar, J. Cleaner Prod., 2018, 202, 571–581 CrossRef CAS.
- Z. Anfar, R. El Haouti, S. Lhanafi, M. Benafqir, Y. Azougarh and N. El Alem, J. Environ. Chem. Eng., 2017, 5, 5857–5867 CrossRef CAS.
- H. Ait Ahsaine, M. Zbair, Z. Anfar, Y. Naciri, R. El haouti, N. El Alem and M. Ezahri, Mater. Today Chem., 2018, 8, 1–12 CrossRef.
- I. Anastopoulos, A. Bhatnagar, B. Hameed, Y. S. Ok and M. Omirou, J. Mol. Liq., 2017, 240, 179–188 CrossRef CAS.
- L. Bulgariu and D. Bulgariu, J. Cleaner Prod., 2018, 197, 875–885 CrossRef CAS.
- Y. Huang, C. Yang, Z. Sun, G. Zeng and H. He, RSC Adv., 2015, 5, 11475–11484 RSC.
- C. Yan, Y. Chunping, H. Huijun, Z. Guangming, Z. Kun and Y. Zhou, J. Environ. Eng., 2016, 142, C4015001 CrossRef.
- Q. Zhang, C. Peter Okoli, L. Wang and T. Liang, Desalin. Water Treat., 2015, 55, 1575–1585 CrossRef CAS.
- B. Liu, F. Yang, Y. Zou and Y. Peng, J. Chem. Eng. Data, 2014, 59, 1476–1482 CrossRef CAS.
- M. Ahmed and S. Theydan, Adsorptive removal of p-nitrophenol on microporous activated carbon by FeCl3 activation: equilibrium and kinetics studies, 2014, vol. 55 Search PubMed.
- A. Sari, M. Tuzen and M. Soylak, J. Hazard. Mater., 2007, 144, 41–46 CrossRef CAS PubMed.
- G. Bereket, A. Z. Aroǧuz and M. Z. Özel, J. Colloid Interface Sci., 1997, 187, 338–343 CrossRef CAS PubMed.
- M. Tuzen, E. Melek and M. Soylak, J. Hazard. Mater., 2006, 136, 597–603 CrossRef CAS PubMed.
- N. L. D. Filho, W. L. Polito and Y. Gushikem, Talanta, 1995, 42, 1031–1036 CrossRef CAS PubMed.
- S. Veli and B. Alyüz, J. Hazard. Mater., 2007, 149, 226–233 CrossRef CAS PubMed.
- S. S. Tahir and N. Rauf, Chemosphere, 2006, 63, 1842–1848 CrossRef CAS PubMed.
- K. Zhao, Y. Cheng, H. Liu, C. Yang, L. Qiu, G. Zeng and H. He, RSC Adv., 2015, 5, 66013–66023 RSC.
- L. Qiu, Y. Cheng, C. Yang, G. Zeng, Z. Long, S. Wei, K. Zhao and L. Luo, RSC Adv., 2016, 6, 17036–17045 RSC.
- C. Yang, K. Zhao, Y. Cheng, G. Zeng, M. Zhang, J. Shao and L. Lu, Sep. Purif. Technol., 2016, 163, 153–161 CrossRef CAS.
- T. K. M. Prashantha Kumar, T. R. Mandlimath, P. Sangeetha, P. Sakthivel, S. K. Revathi, S. K. Ashok Kumar and S. K. Sahoo, RSC Adv., 2015, 5, 108034–108043 RSC.
- D. Mohan, A. Sarswat, V. K. Singh, M. Alexandre-Franco and C. U. Pittman Jr, Chem. Eng. J., 2011, 172, 1111–1125 CrossRef CAS.
- J. S. Noh and J. A. Schwarz, J. Colloid Interface Sci., 1989, 130, 157–164 CrossRef CAS.
- J. Wang, C. P. Huang, H. E. Allen, D. K. Cha and D. W. Kim, J. Colloid Interface Sci., 1998, 208, 518–528 CrossRef CAS PubMed.
- V. K. Garg, R. Gupta, A. B. Yadav and R. Kumar, Bioresour. Technol., 2003, 89, 121–124 CrossRef CAS PubMed.
- S. Lagergren, K. Sven. Vetenskapsakad. Handl., 1898, 24, 1 Search PubMed.
- G. McKay, Process Biochem., 1999, 34, 451 CrossRef.
- J. C. Weber and W. J. Morris, J. Sanit. Eng. Div., Am. Soc. Civ. Eng., 1963, 89, 31–60 Search PubMed.
- I. Langmuir, J. Am. Chem. Soc., 1916, 38, 2221–2295 CrossRef CAS.
- S. Fan, Y. Wang, Z. Wang, J. Tang, J. Tang and X. Li, J. Environ. Chem. Eng., 2017, 5, 601–611 CrossRef CAS.
- H. Freundlich, Z. Phys. Chem., 1906, 57, 385 CAS.
- L. V. Dubinin and M. M. Radushkevich, Proc. Acad. Sci. USSR, Phys. Chem. Sect., 1947, 55, 331–333 Search PubMed.
- G. F. Cerofolini, Surf. Sci., 1975, 51, 333–335 CrossRef CAS.
- M. Ghasemi, M. Naushad, N. Ghasemi and Y. Khosravi-fard, J. Ind. Eng. Chem., 2014, 20, 2193–2199 CrossRef CAS.
- E. C. Lima, A. Hosseini-Bandegharaei, J. C. Moreno-Piraján and I. Anastopoulos, J. Mol. Liq., 2019, 273, 425–434 CrossRef CAS.
- I. Anastopoulos and G. Z. Kyzas, J. Mol. Liq., 2016, 218, 174–185 CrossRef CAS.
- P. S. Ghosal and A. K. Gupta, J. Mol. Liq., 2017, 225, 137–146 CrossRef CAS.
- Z. Anfar, M. Zbair, H. A. Ahsaine, M. Ezahri and N. E. Alem, Fullerenes, Nanotubes, Carbon Nanostruct., 2018, 26, 389–397 CrossRef CAS.
- M. Zbair, K. Ainassaari, Z. El Assal, S. Ojala, N. El Ouahedy, R. L. Keiski, M. Bensitel and R. Brahmi, Environ. Sci. Pollut. Res., 2018, 25, 35657–35671 CrossRef CAS PubMed.
- F. G. Alabarse, R. V. Conceição, N. M. Balzaretti, F. Schenato and A. M. Xavier, Appl. Clay Sci., 2011, 51, 202–208 CrossRef CAS.
- X. Wang, S. Lu, L. Chen, J. Li, S. Dai and X. Wang, J. Radioanal. Nucl. Chem., 2015, 306, 497–505 CrossRef CAS.
- M. El Miz, H. Akichoh, D. Berraaouan, S. Salhi and A. Tahani, Am. J. Chem., 2017, 7, 105–112 Search PubMed.
- L. M. Calarge, A. Meunier and M. L. L. Formoso, J. South Am. Earth Sci., 2003, 16, 187–198 CrossRef.
- H. A. Ahsaine, M. Zbair and R. El Haouti, Desalin. Water Treat., 2017, 85, 330–338 CrossRef.
- J. Madejová, W. P. Gates and S. Petit, in Infrared and Raman Spectroscopies of Clay Minerals, ed. W. P. Gates, J. T. Kloprogge, J. Madejová and F. Bergaya, Elsevier, 2017, vol. 8, pp. 107–149 Search PubMed.
- C. T. Johnston, in Infrared and Raman Spectroscopies of Clay Minerals, ed. W. P. Gates, J. T. Kloprogge, J. Madejová and F. Bergaya, Elsevier, 2017, vol. 8, pp. 288–309 Search PubMed.
- M. L. Cantuaria, A. F. de Almeida Neto, E. S. Nascimento and M. G. A. Vieira, J. Cleaner Prod., 2016, 112, 1112–1121 CrossRef CAS.
- L. Bounab, K. Draoui, M. Ahrouch, M. Hadri, D. Bouchta and A. Barhoun, J. Mater. Environ. Sci., 2017, 8, 244–256 CAS.
- A. Er-ramly and A. Ider, Phys. Chem. News, 2011, 61, 112–119 CAS.
- H. N. Tran, C.-C. Lin, S. H. Woo and H.-P. Chao, Appl. Clay Sci., 2018, 154, 17–27 CrossRef CAS.
- I. Anastopoulos, I. Margiotoudis and I. Massas, Int. J. Phytorem., 2018, 20, 831–838 CrossRef CAS PubMed.
- M. Zbair, K. Ainassaari, A. Drif, S. Ojala, M. Bottlinger, M. Pirilä, R. L. Keiski, M. Bensitel and R. Brahmi, Environ. Sci. Pollut. Res., 2018, 25, 1869–1882 CrossRef CAS PubMed.
- D. Tang, Z. Zheng, K. Lin, J. Luan and J. Zhang, J. Hazard. Mater., 2007, 143, 49–56 CrossRef CAS PubMed.
- T.-H. Pham, B.-K. Lee and J. Kim, Process Saf. Environ. Prot., 2016, 104, 314–322 CrossRef CAS.
- G. Xue, M. Gao, Z. Gu, Z. Luo and Z. Hu, Chem. Eng. J., 2013, 218, 223–231 CrossRef CAS.
- M. Momčilović, M. Purenović, A. Bojić, A. Zarubica and M. Ranđelović, Desalination, 2011, 276, 53–59 CrossRef.
- A. Üçer, A. Uyanik and Ş. F. Aygün, Sep. Purif. Technol., 2006, 47, 113–118 CrossRef.
- K. Kadirvelu, C. Faur-Brasquet and P. Le Cloirec, Langmuir, 2000, 16, 8404–8409 CrossRef CAS.
- C. Faur-Brasquet, Z. Reddad, K. Kadirvelu and P. Le Cloirec, Appl. Surf. Sci., 2002, 196, 356–365 CrossRef CAS.
- S.-T. Lin, H. N. Tran, H.-P. Chao and J.-F. Lee, Appl. Clay Sci., 2018, 162, 443–453 CrossRef CAS.
- A. Sharma, Z. Syed, U. Brighu, A. B. Gupta and C. Ram, J. Cleaner Prod., 2019 DOI:10.1016/j.jclepro.2019.01.236.
- F. Granados-Correa and J. Jiménez-Becerril, J. Hazard. Mater., 2009, 162, 1178–1184 CrossRef CAS PubMed.
- Y. Zeng, Z. Zeng, T. Ju and F. Zhang, Microporous Mesoporous Mater., 2015, 210, 60–68 CrossRef CAS.
- M. M. Rao, D. K. Ramana, K. Seshaiah, M. C. Wang and S. W. C. Chien, J. Hazard. Mater., 2009, 166, 1006–1013 CrossRef CAS PubMed.
- W. M. Ibrahim, A. F. Hassan and Y. A. Azab, Egypt. J. Basic Appl. Sci., 2016, 3, 241–249 CrossRef.
- M. Kobya, E. Demirbas, E. Senturk and M. Ince, Bioresour. Technol., 2005, 96, 1518–1521 CrossRef CAS.
- R. R. Bansode, J. N. Losso, W. E. Marshall, R. M. Rao and R. J. Portier, Bioresour. Technol., 2003, 89, 115–119 CrossRef CAS PubMed.
- J. Yin, C. Deng, Z. Yu, X. Wang and G. Xu, Water, 2018, 10, 210 CrossRef.
- Y. Ma, Q. Zhou, A. Li, C. Shuang, Q. Shi and M. Zhang, J. Hazard. Mater., 2014, 266, 84–93 CrossRef CAS PubMed.
- S.-H. Lin and R.-S. Juang, J. Environ. Manage., 2009, 90, 1336–1349 CrossRef CAS PubMed.
- H. N. Tran, S. J. You, A. Hosseini-Bandegharaei and H. P. Chao, Water Res., 2017, 120, 88–116 CrossRef CAS PubMed.
- H. N. Tran, S.-J. You and H.-P. Chao, J. Environ. Chem. Eng., 2016, 4, 2671–2682 CrossRef CAS.
- A. Elouahli, M. Zbair, Z. Anfar, H. A. Ahsaine, H. Khallok, R. Chourak and Z. Hatim, Surf. Interfaces, 2018, 13, 139–147 CrossRef CAS.
- H. Ait Ahsaine, Z. Anfar, M. Zbair, M. Ezahri and N. El Alem, J. Chem., 2018, 1–14 Search PubMed.
- M. Zbair, Z. Anfar, H. A. Ahsaine and H. Khallok, RSC Adv., 2019, 9, 1084–1094 RSC.
| This journal is © The Royal Society of Chemistry 2019 |


