 Open Access Article
Hydrodesulfurization of dibenzothiophene using Pd-promoted Co–Mo/Al2O3 and Ni–Mo/Al2O3 catalysts coupled with ionic liquids at ambient operating conditions†
Yaseen Muhammad ab,
Ata Ur Rahmanb,
Haroon Ur Rashida,
Maria Sahibzadac,
Sidra Subhanab and
Zhangfa Tong
 *a
*a
aSchool of Chemistry and Chemical Engineering, Key Laboratory of Petrochemical Resource Processing and Process Intensification Technology, Guangxi University, Guangxi 530004, P. R. China. E-mail: zhftong@sina.com
bInstitute of Chemical Sciences, University of Peshawar, Peshawar, 25120, KP, Pakistan
cDepartment of Chemistry, Umea University, Umea, Sweden
First published on 2nd April 2019
Abstract
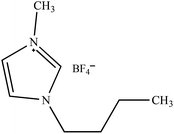
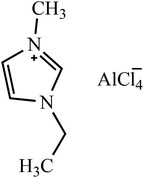
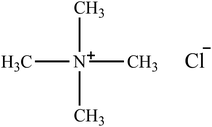
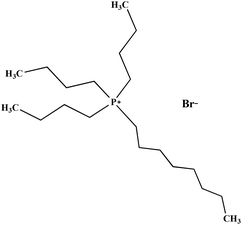
Sulfur compounds in fuel oils are a major source of atmospheric pollution. This study is focused on the hydrodesulfurization (HDS) of dibenzothiophene (DBT) via the coupled application of 0.5 wt% Pd-loaded Co–Mo/Al2O3 and Ni–Mo/Al2O3 catalysts with ionic liquids (ILs) at ambient temperature (120 °C) and pressure (1 MPa H2). The enhanced HDS activity of the solid catalysts coupled with [BMIM]BF4, [(CH3)4N]Cl, [EMIM]AlCl4, and [(n-C8H17)(C4H9)3P]Br was credited to the synergism between hydrogenation by the former and extractive desulfurization and better H2 transport by the latter, which was confirmed by DFT simulation. The Pd-loaded catalysts ranked highest by activity i.e. Pd–Ni–Mo/Al2O3 > Pd–Co–Mo/Al2O3 > Ni–Mo/Al2O3 > Co–Mo/Al2O3. With mild experimental conditions of 1 MPa H2 pressure and 120 °C temperature and an oil![[thin space (1/6-em)]](https://www.rsc.org/images/entities/char_2009.gif) :
:![[thin space (1/6-em)]](https://www.rsc.org/images/entities/char_2009.gif) IL ratio of 10
IL ratio of 10![[thin space (1/6-em)]](https://www.rsc.org/images/entities/char_2009.gif) :
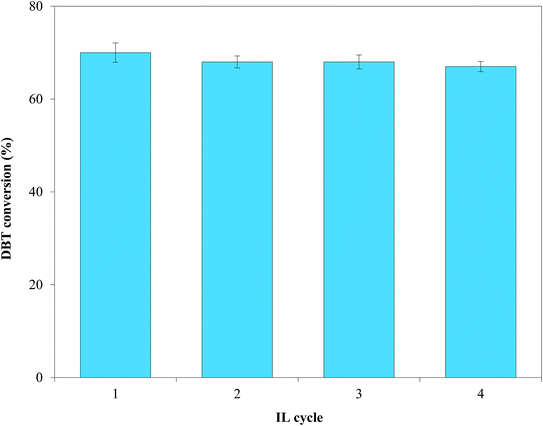
:![[thin space (1/6-em)]](https://www.rsc.org/images/entities/char_2009.gif) 3.3, DBT conversion was enhanced from 21% (by blank Ni–Mo/Al2O3) to 70% by Pd–Ni–Mo/Al2O3 coupled with [(n-C8H17)(C4H9)3P]Br. The interaction of polarizable delocalized bonds (in DBT) and van der Waals forces influenced the higher solubility in ILs and hence led to higher DBT conversion. The IL was recycled four times with minimal loss of activity. Fresh and spent catalysts were characterized by FESEM, ICP-MS, EDX, XRD, XPS and BET surface area techniques. GC-MS analysis revealed biphenyl as the major HDS product. This study presents a considerable advance to the classical HDS processes in terms of mild operating conditions, cost-effectiveness, and simplified mechanization, and hence can be envisaged as an alternative approach for fuel oil processing.
3.3, DBT conversion was enhanced from 21% (by blank Ni–Mo/Al2O3) to 70% by Pd–Ni–Mo/Al2O3 coupled with [(n-C8H17)(C4H9)3P]Br. The interaction of polarizable delocalized bonds (in DBT) and van der Waals forces influenced the higher solubility in ILs and hence led to higher DBT conversion. The IL was recycled four times with minimal loss of activity. Fresh and spent catalysts were characterized by FESEM, ICP-MS, EDX, XRD, XPS and BET surface area techniques. GC-MS analysis revealed biphenyl as the major HDS product. This study presents a considerable advance to the classical HDS processes in terms of mild operating conditions, cost-effectiveness, and simplified mechanization, and hence can be envisaged as an alternative approach for fuel oil processing.
1. Introduction
Organosulfur compounds leading to the production of deleterious and hazardous sulfur oxides, i.e. SOx, from the combustion of fuel oils has led to the permissible limits of sulfur becoming much more stringent over the years.1 Among the many desulfurization approaches, such as oxidative desulfurization,2 biodesulfurization3 and extractive desulfurization,4 hydrodesulfurization (HDS) ranks higher, attributed to its diverse nature, high practicability and efficiency.5 HDS generally utilizes a Co or Ni sulfide phase added to Mo impregnated over Al2O3-supported catalysts.6–8 Furthermore, incorporation of a third promoter metal, i.e. Pt, Pd, and Ir, can further enhance the HDS activity of classical catalysts.5,9,10 Despite its efficient and versatile nature, HDS suffers from complex mechanization, poor safety and harsh temperature (380–400 °C) and pressure (8 MPa) operating conditions.11–13 Similarly, expensive catalytic promoters like Pt, Pd, and Ir further add to the uncontrolled process costs. Thus, an HDS process operated at mild temperature and pressure over a low-cost catalyst without compromising on the process efficiency could offer an alternative route for fuel oil processing.Apart from HDS, a newer approach to fuel oil desulfurization research is extraction using ionic liquids (ILs).14,15 Aspects such as ease of synthesis, high recycling ability, low volatility, high thermal stability and environmental friendliness are credited for the widespread application of ILs.16 However, few studies on the integrated application of ILs with solid catalysts have been reported in hydrogenation reactions,17 which emphasizes that ILs coupled with solid catalysts should be tested for HDS of fuel oils.
In previous work, we reported 52% dibenzothiophene (DBT) conversion in a HDS process with a mild operating temperature and pressure by the coupled application of selected ILs with Ce–Ni–Mo/Al2O3 catalysts.18 However, to further improve the efficiency of solid catalyst-coupled ILs HDS processes, more exploration is required for new types of catalysts and ILs.
Pd has been reported as a more promising promoter for classical HDS catalysts than many of its counterparts, e.g. Ir and Ru.19,20 However, to our knowledge, no studies on the HDS of DBT coupled with ILs using Pd-promoted Co–Mo/Al2O3 and Ni–Mo/Al2O3 catalysts at mild operating conditions have been reported so far. Extractive desulfurization by ILs can augment the hydrogenation by solid catalysts in their blended application at mild operating conditions. Low Pd loading and mild operating conditions can concomitantly lead to cost-effectiveness and process safety. Thus, in this work, HDS of DBT was performed at 120 °C temperature and 1 MPa H2 pressure over low (0.5 wt%) Pd-loaded Co–Mo/Al2O3 and Ni–Mo/Al2O3 sulfide phase catalysts coupled with selected ILs. The fresh and spent catalysts were characterized by X-ray photoelectron spectroscopy (XPS), field emission scanning electron microscopy (FESEM), inductively coupled plasma mass spectrometry (ICP-MS), energy dispersive X-ray (EDX), X-ray diffraction (XRD) and BET surface area techniques. The reaction products were quantitatively and qualitatively analyzed via high-pressure liquid chromatography (HPLC) and gas chromatography coupled with mass spectrometry (GC-MS), respectively, and a suitable reaction mechanism was proposed.
2. Materials and methods
2.1. Chemicals
All the reagents used in this study were of analytical reagent grade and were used without further purification. DBT, n-octane, the Al2O3 support and Ni(NO3)2·4H2O were purchased from Sinopharm Chemical Reagent Co. Ltd. Co(NO3)2·6H2O was obtained from Tian Jin Shifu Chen Chemical Reagent Factory, China. Ammonium heptamolybdate ((NH4)6Mo7O24·4H2O) was purchased from Jin Mao Chemical Reagent Co. Ltd, while palladium chloride (PdCl2) was provided by Sa En Chemical Technology, Co. Ltd. Shang Hai, China. Five different ILs were purchased from Shanghai Cheng Jie Chemical Co. Ltd. China. Pure H2 gas was used in all hydrogenation experiments.2.2. Experimental
![[thin space (1/6-em)]](https://www.rsc.org/images/entities/char_2009.gif) :
:![[thin space (1/6-em)]](https://www.rsc.org/images/entities/char_2009.gif) IL ratio, were separately optimized.
IL ratio, were separately optimized.
The catalytic activity in terms of DBT conversion (%) was calculated using eqn (1):
 | (1) |
3. Results and discussion
3.1. Characterization of catalysts
Fig. 2 shows the FESEM images of pure Al2O3 and fresh Co–Mo/Al2O3, Ni–Mo/Al2O3, Pd–Co–Mo/Al2O3, and Pd–Ni–Mo/Al2O3 catalysts while Fig. S2† summarizes the FESEM images of spent versions of these catalysts. The data in Table 1 and FESEM images in Fig. 2a reveal the highly porous nature of the Al2O3 support. Fig. 2b shows that uniformly deposited Mo and Co species led to a decrease in the porosity and surface area and an increase in the particle size compared to those of the pure support (Table 1).21–23 The bimetallic Co–Mo/Al2O3 and Ni–Mo/Al2O3 catalysts possessed less compact morphology (Fig. 2(b and c)) than those of trimetallic Pd–Co–Mo/Al2O3 and Pd–Ni–Mo/Al2O3 (Fig. 2(d and e)). The spent catalysts (Fig. S2(a–d)†) (tested in HDS reaction at optimized conditions of 4 h, 1 MPa H2 pressure at 120 °C using an oil![[thin space (1/6-em)]](https://www.rsc.org/images/entities/char_2009.gif) :
:![[thin space (1/6-em)]](https://www.rsc.org/images/entities/char_2009.gif) IL ratio of 10
IL ratio of 10![[thin space (1/6-em)]](https://www.rsc.org/images/entities/char_2009.gif) :
:![[thin space (1/6-em)]](https://www.rsc.org/images/entities/char_2009.gif) 3.3) suffered a significant decrease in porosity, resulting in the appearance of clots with an overall increase in particle size and pore diameter (Table 1).24 This could be due to the deposition of DBT or HDS products, and preferential utilization of micro- and meso-pores during the HDS reaction.25 Compared to the spent Co–Mo/Al2O3 and Ni–Mo/Al2O3 catalysts in Fig. S2(a and b),† the spent Pd-promoted (Pd–Co–Mo/Al2O3 and Pd–Ni–Mo/Al2O3) catalysts in Fig. S2(c and d)† exhibited a much more compact and packed morphology, which might be the result of more sulfur species deposited being deposited owing to their much higher DBT conversion than Co–Mo/Al2O3 and Ni–Mo/Al2O3 (to be discussed in the following sections).
3.3) suffered a significant decrease in porosity, resulting in the appearance of clots with an overall increase in particle size and pore diameter (Table 1).24 This could be due to the deposition of DBT or HDS products, and preferential utilization of micro- and meso-pores during the HDS reaction.25 Compared to the spent Co–Mo/Al2O3 and Ni–Mo/Al2O3 catalysts in Fig. S2(a and b),† the spent Pd-promoted (Pd–Co–Mo/Al2O3 and Pd–Ni–Mo/Al2O3) catalysts in Fig. S2(c and d)† exhibited a much more compact and packed morphology, which might be the result of more sulfur species deposited being deposited owing to their much higher DBT conversion than Co–Mo/Al2O3 and Ni–Mo/Al2O3 (to be discussed in the following sections).
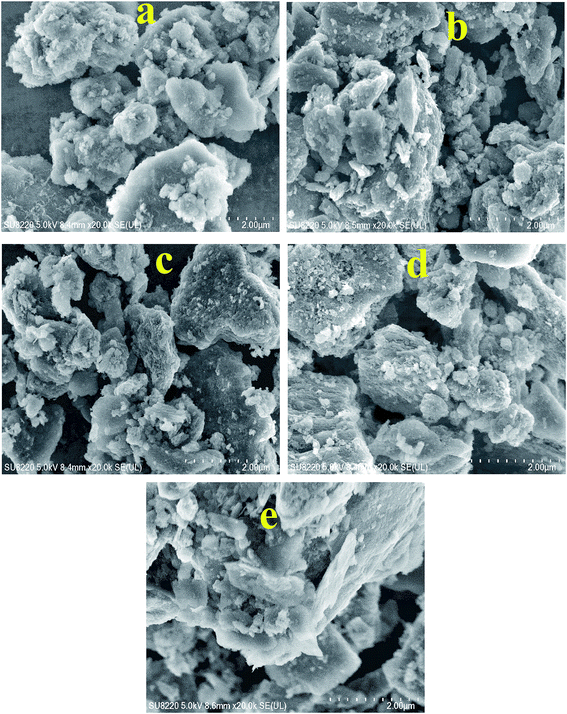 | ||
| Fig. 2 FESEM images of (a) Al2O3 and the fresh catalysts (b) Co-M/Al2O3, (c) Ni–Mo/Al2O3, (d) Pd–Co–Mo/Al2O3 and (e) Pd–Ni–Mo/Al2O3. | ||
| Sample | BET surface area (m2 g−1) | Langmuir surface area (m2 g−1) | Pore volume (cm3 g−1) | Pore diameter (nm) | ||||
|---|---|---|---|---|---|---|---|---|
| Fresh | Spent | Fresh | Spent | Fresh | Spent | Fresh | Spent | |
| Al2O3 | 200.8 | — | 291.5 | — | 0.30 | — | 6.0 | — |
| Co–Mo/Al2O3 | 109.6 | 99.1 | 156.6 | 148.5 | 0.21 | 0.19 | 7.7 | 7.6 |
| Ni–Mo/Al2O3 | 120.5 | 91.9 | 172.5 | 138.0 | 0.22 | 0.17 | 7.4 | 7.5 |
| Pd–Co–Mo/Al2O3 | 115.1 | 72.5 | 164.2 | 109.4 | 0.22 | 0.16 | 8.0 | 9.0 |
| Pd–Ni–Mo/Al2O3 | 108.4 | 79.9 | 155.0 | 119.8 | 0.22 | 0.17 | 8.2 | 8.6 |
The ICP-MS results in Table S1† advocate lower concentrations of the impregnated metals in the four types of catalysts than the theoretical values, which could be attributed to the leaching of some metal species during the catalyst synthesis or improper dissolution of the catalysts for ICP analysis, especially for the Pd-based catalysts. The concentration of all metals in the spent catalysts was considerably decreased, which could be attributed to their agglomeration (FESEM images in Fig. S2†) or disposition of HDS products after being tested in the HDS of DBT. The EDX spectrum (Fig. S3(a)†) of the Al2O3 support shows abundant Al and O species. Fig. S3(b–e)† confirms the successful impregnation of Co, Ni, Mo and Pd onto the Al2O3 support.26 Furthermore, the EDX elemental mappings for the fresh catalysts in Fig. S4A† suggest the uniform distribution of Co, Ni, Mo and Pd over the support surface, which was considerably decreased for the spent catalysts (Fig. S4B†), which was attributed to the blockage of the surface by DBT molecules in the latter. Moreover, the EDX elemental mapping results further confirmed that Mo had the densest distribution ((Fig. S4A(g–j) and S4B(r–u)†) while Pd had the lowest distribution density (Fig. S4A(e and f) and S4B(p and q)†). Al present in the bulk in the Al2O3 support possessed the densest distribution (Fig. S4A(k)†).
Porosity, specific surface area (SSA) and Langmuir surface area data for the Al2O3 support and various catalysts are provided in Table 1. The SSA of the support was considerably decreased upon the impregnation of Co, Ni, Mo and Pd.7,27 The hysteresis loop at higher relative pressure (P/Po > 0.6) in Fig. S5† indicates the predominant presence of micropores and mesopores.28 Spent catalysts (tested in HDS reaction for 4 h, 1 MPa H2 pressure at 120 °C using an oil![[thin space (1/6-em)]](https://www.rsc.org/images/entities/char_2009.gif) :
:![[thin space (1/6-em)]](https://www.rsc.org/images/entities/char_2009.gif) IL ratio of 10
IL ratio of 10![[thin space (1/6-em)]](https://www.rsc.org/images/entities/char_2009.gif) :
:![[thin space (1/6-em)]](https://www.rsc.org/images/entities/char_2009.gif) 3.3) exhibited a significantly high decrease in SSA, which could be attributed to the deposition of DBT or HDS products.29 The decrease in the SSA and increase in the pore diameter after the addition of Co or Ni to the Al2O3 support and Pd to the Co–Mo/Al2O3 or Ni–Mo/Al2O3 catalysts could be attributed to the increase in mesoporosity.30 In the case of the spent catalysts (Table 1), the net increase in the pore diameter and decrease in the pore volume could be owing to the preferential utilization of micro- and meso-pores during the HDS reaction, leaving macropores behind with their larger pore diameter.30
3.3) exhibited a significantly high decrease in SSA, which could be attributed to the deposition of DBT or HDS products.29 The decrease in the SSA and increase in the pore diameter after the addition of Co or Ni to the Al2O3 support and Pd to the Co–Mo/Al2O3 or Ni–Mo/Al2O3 catalysts could be attributed to the increase in mesoporosity.30 In the case of the spent catalysts (Table 1), the net increase in the pore diameter and decrease in the pore volume could be owing to the preferential utilization of micro- and meso-pores during the HDS reaction, leaving macropores behind with their larger pore diameter.30
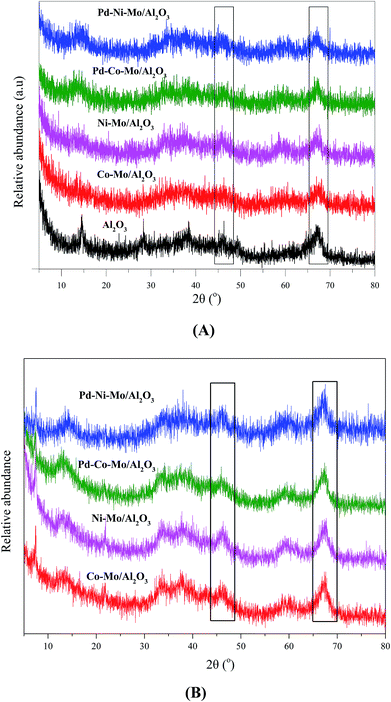
The XRD patterns of Al2O3 and fresh catalysts compiled in Fig. 3 suggest a high degree of dispersion with a minimum degree of crystallization. Fig. 3A shows strong peaks for Al2O3 at 2θ of 47° and 67° (black rectangles),31,32 which were weakened by the incorporation of Co, Ni, Mo or Pd, suggesting that the catalysts maintained the proper pore structure required for the HDS reaction. The peaks at 2θ of 33° and 59° were ascribed to MoS2 species in all catalysts33,34 while Ni showed a weak peak at 2θ of 60° in Ni–Mo/Al2O3 and Pd–Ni–Mo/Al2O3.35 The XRD patterns of the spent catalysts shown in Fig. 3B indicate that there was little change in the bulk structure compared with those of the fresh catalysts (Fig. 3A) suggesting their stable nature under the current HDS reaction conditions.36 However, from the XRD patterns in Fig. 3B, one can see the decrease in the dispersion of metallic species as the peaks become sharper compared to the fresh catalysts (Fig. 3A), which could be due to the deposition of sulfur moieties after the HDS reaction. It can be concluded from Fig. 3(A and B) that with low metal loading, specifically of Pd, and a highly amorphous nature with a high degree of dispersion of the catalyst (Fig. S4A and S4B†), the XRD data provided little information about the exact composition and crystallinity of the individual species18,33. Furthermore, the low metal loading of Pd (0.5 wt%) was below the detection limit of the XRD instrument and hence no clear peak appeared for Pd in the Pd–Co–Mo/Al2O3 or Pd–Ni–Mo/Al2O3 catalysts.
The full survey XPS spectra of the four types of fresh catalysts are shown in Fig. S6(I),† confirming the presence of Co, Mo, Ni and Al. In Fig. S6(I),† the presence of a large amount of C 1s could be owing to the presence of organic compounds or the C left from cyclohexane in the presulfidation step.37 The Co–Mo/Al2O3 catalyst in Fig. 4A exhibited two prominent peaks at binding energies (BE) of 231.2 eV and 234.5 eV ascribed to Mo 3d5/2 and Mo 3d3/2 as MoS3 phase, respectively.38,39 Elemental Mo (at 227.5 or 230.6 eV)39 was not detected in any of the samples, indicating the complete sulfidation of Mo species. The shift towards higher BE of Mo 3d5/2 (231.5 eV) and Mo 3d3/2 (235.0 eV) (Fig. 4A) for Pd–Co–Mo/Al2O3 compared to those in Co–Mo/Al2O3 could be attributed to the stronger interaction of Mo with Pd in the former. On the contrary, the lower BE for Mo 3d5/2 and 3d3/2 (230.9 and 234.5, respectively) in Pd–Ni–Mo/Al2O3 than those for the same two states in Ni–Mo/Al2O3 (231.8 and 235.3, respectively) in (Fig. 4B) was indicative of a weaker interaction between Mo and Pd species in Pd–Ni–Mo/Al2O3, leading to better dispersion of the active phase, which can play an active role in enhancing the catalytic activity towards DBT conversion. The degree of interaction of Pd with Mo in the Pd–Co–Mo/Al2O3 and Pd–Ni–Mo/Al2O3 catalysts could be justified by a charge compensation model in which Mo loses d-electrons and gains sp-electrons while Pd gains d-electrons and loses sp electrons.40 The weaker interaction of Pd with Ni in the Pd–Ni–Mo/Al2O3 catalyst (lower BE in Fig. 4B) could be attributed to stronger Ni–Mo interaction owing to the 3d84S0 configuration than that in the Pd–Co–Mo/Al2O3 catalyst (with 3d74S0 configuration).41 In brief, XPS analysis indirectly confirmed the extremely low loading of Pd (0.5 wt%) in Pd–Co–Mo/Al2O3 and Pd–Ni–Mo/Al2O3 catalysts, which was not achieved by XRD analysis. A similar trend can be observed in Fig. S6(II and III)† showcasing the S 2p3/2 and S 2p1/2 states in various catalysts.41
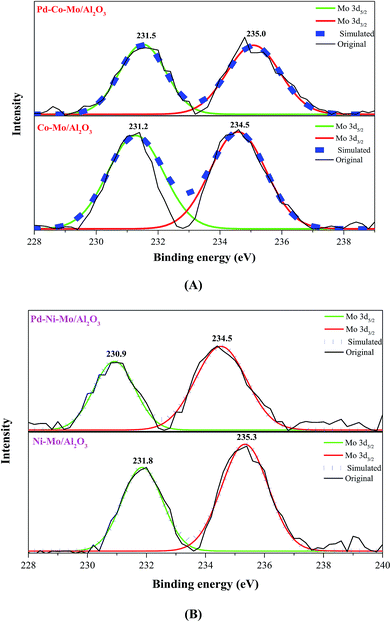 | ||
| Fig. 4 High-resolution XPS spectra of Mo 3d (A) Co–Mo/Al2O3 and Pd–Co–Mo/Al2O3 and (B) Ni–Mo/Al2O3 and Pd–Ni–Mo/Al2O3 catalysts. | ||
3.2. Catalytic HDS activity tests
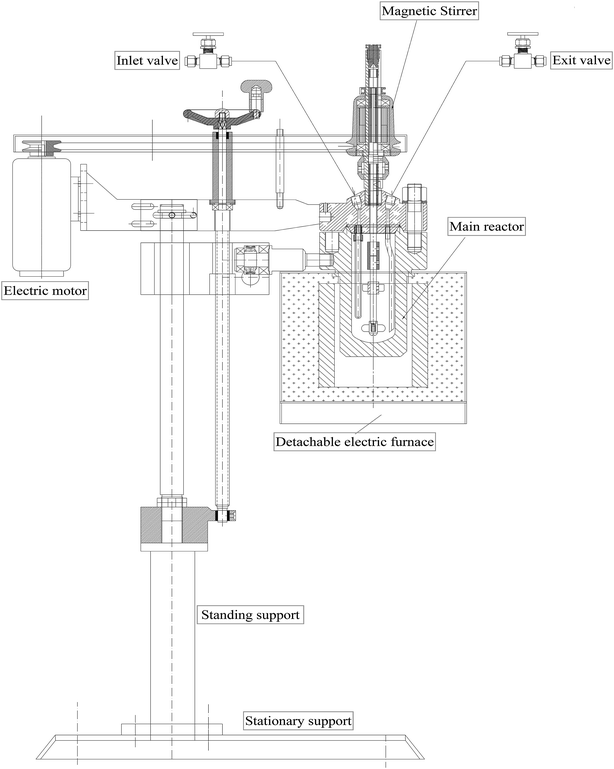
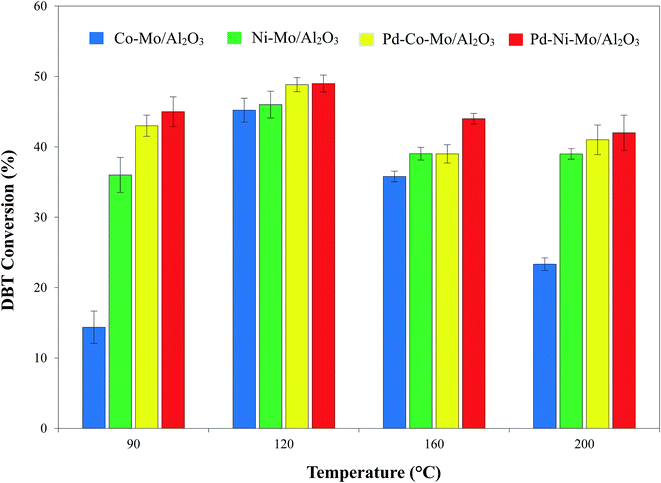
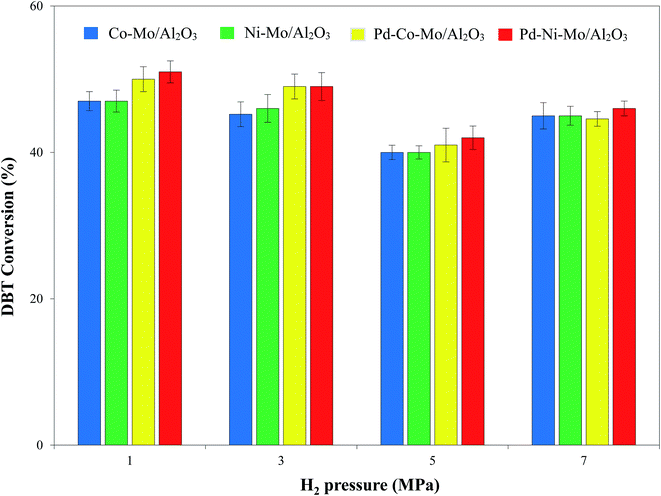
HDS catalytic activity tests of the presulfided catalysts were performed in a 200 mL batch autoclave reactor (Fig. 1) as detailed in Section 2.2.3. Different reaction parameters were independently optimized, as discussed below.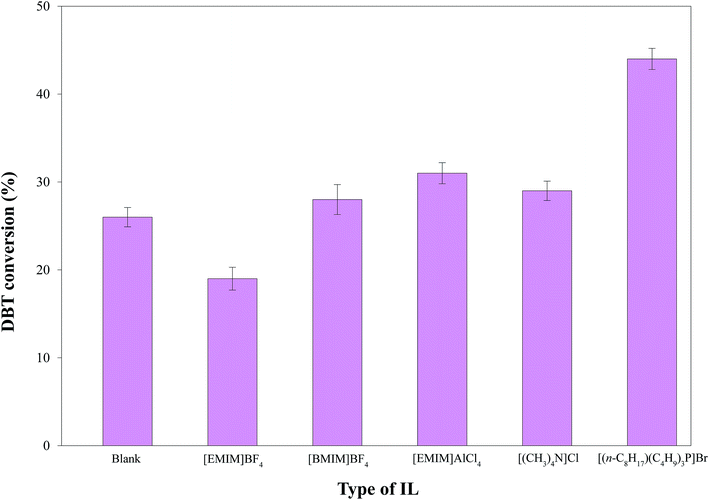 | ||
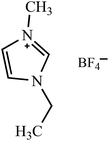
| Fig. 6 Comparison of DBT conversion by Pd–Ni–Mo/Al2O3 (0.1 g) combined with 4 g of each IL at 160 °C, 3 MPa H2 pressure, and 4 h reaction time with 30 mL of 1000 ppm DBT solution. | ||
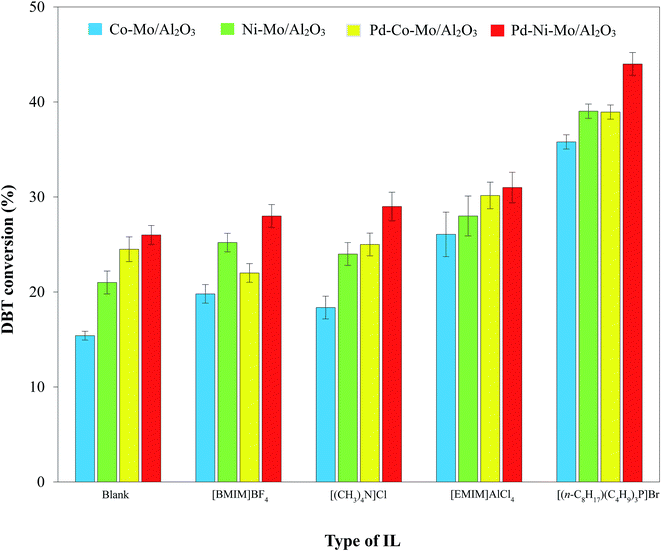 | ||
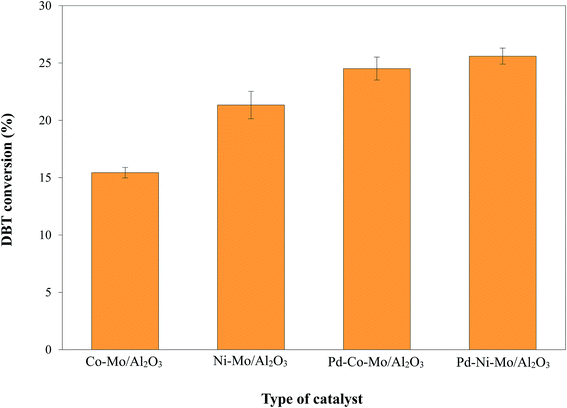
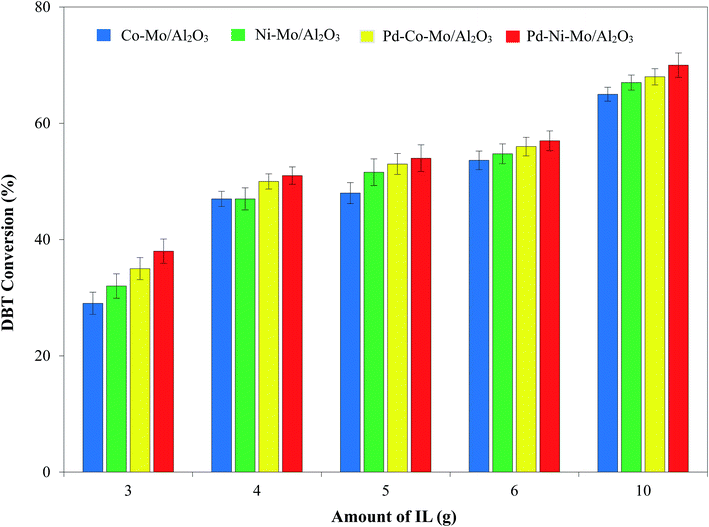
| Fig. 7 Comparison of DBT conversion by different catalysts (0.1 g) combined with 4 g of each IL at 160 °C, 3 MPa H2 pressure and 4 h reaction time using 30 mL of 1000 ppm DBT solution. | ||
The catalytic role of ILs coupled with solid catalysts was further analyzed by performing experiments in the same autoclave reactor without the addition of Pd–Ni–Mo/Al2O3 over 4 g of [(n-C8H17)(C4H9)3P]Br IL with 200 rpm stirring speed and 160 °C temperature for 4 h using 30 mL of 1000 ppm DBT solution. After the reaction, the concentration of DBT in the oil phase (separated by decantation) was analyzed by HPLC. The results in Table 3 suggest that DBT extraction by mere [(n-C8H17)(C4H9)3P]Br (13%) was enhanced by combining it with HDS (22%). From these results, one can conclude that [(n-C8H17)(C4H9)3P]Br along with extraction also played a catalytic role to a certain extent in combination with HDS. This synergistic effect was further enhanced by the introduction of the Pd–Ni–Mo/Al2O3 catalyst to the reaction medium (Fig. 6 and 7), enhancing the DBT conversion from 26% to 44% (Fig. 6).
| Type of experiment | Type of IL | H2 pressure (MPa) | DBT conversion (%) |
|---|---|---|---|
| Extraction | [(n-C8H17)(C4H9)3P]Br | — | 13 |
| Extraction with HDS | [(n-C8H17)(C4H9)3P]Br | 3 | 22 |
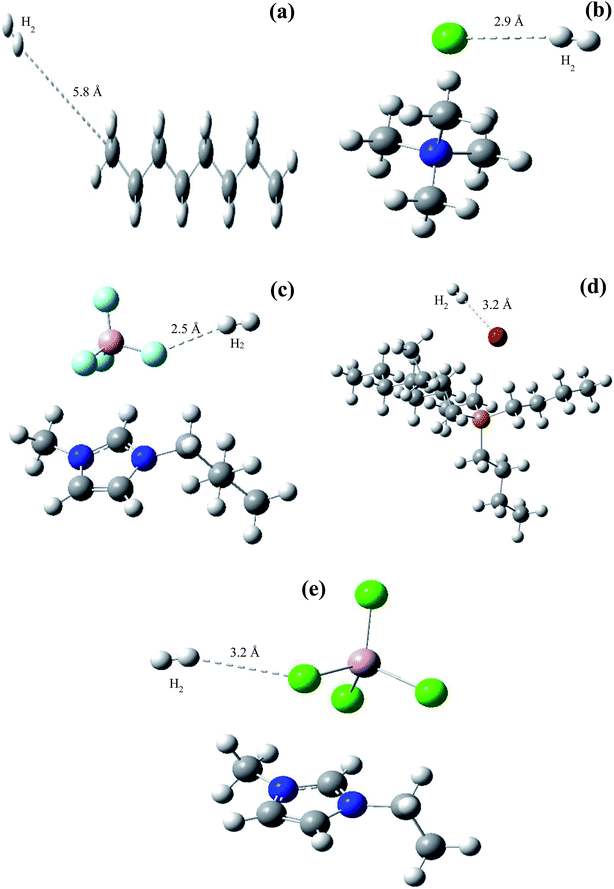
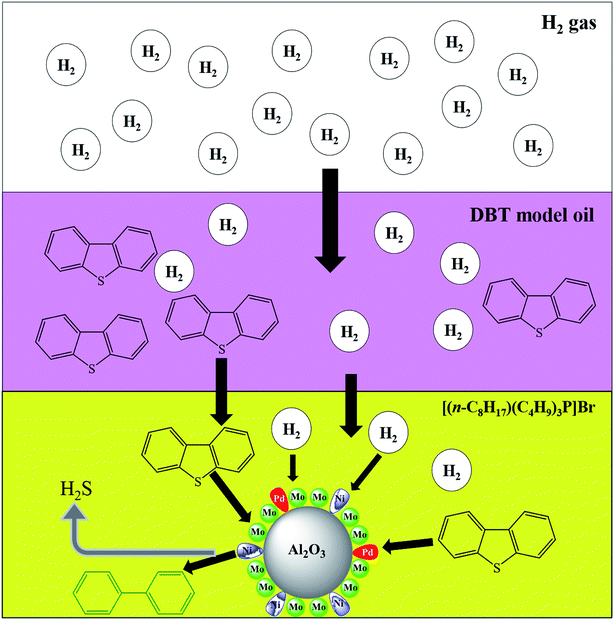
The effect of the ILs-solid catalyst coupled system on HDS was further validated via DFT simulation using Gaussian 3 software (Fig. 8) and the resulting BE are provided in Table 4. The geometries of the reacting species were optimized at the B3LYP/6-311+g(d,p) level, both with and without BSSE corrections, while the geometry parameters of each IL with H2 are shown in Table S2.† The relative distance between H2 and the terminal C atom of n-octane (Fig. 8a) was much larger (5.8 Å) than that between H2 and the anionic center of the ILs (Fig. 8b–e and Table 4), suggesting a stronger interaction between the latter pair. Furthermore, the BE between H2 and ILs in Table 4 were much smaller than those between H2 and n-octane, confirming the higher solubility of H2 in IL than in n-octane. This can facilitate easier mass transfer of H2 through the IL and hence better chances of activated H atom generation51 which can, in turn, enhance the HDS activity. Better H2 solubility in ILs is envisaged in Fig. 9. A heterogeneous catalytic process, e.g., HDS, is controlled by the adsorption of H2 gas onto the surface of the solid catalyst. As illustrated in Fig. 9, H2 gas introduced into the reactor faces and penetrates through the barrier of the oil phase (DBT solution) followed by the film between the oil phase and the solid catalyst and finally reaches and spreads over the surface of the Pd–Ni–Mo/Al2O3 catalyst. Over the catalyst surface, H2 is activated into H atoms and then performs the HDS reaction of DBT. In this scenario, the solubility of H2 in the liquid phase is the major activity-controlling factor.51 The DFT results in Fig. 8 show the much higher solubility of H2 in all of the four ILs than in the DBT model oil, which is conducive to better H2 transport through the reaction mixture in the presence of IL, allowing the H2 to reach and then be activated on the surface of the Pd–Ni–Mo/Al2O3, ultimately performing the HDS reaction. Thus, one can conclude that ILs concomitantly act as DBT extractants as well as enhancing the solubility of H2, which augmented the HDS activity of the solid catalyst and hence recorded better activity than that of the blank catalysts.
| Sample | Binding energy (uncorrected) kJ mol−1 | BSSE correction factor | Binding energy (corrected) kJ mol−1 |
|---|---|---|---|
| n-Octane | 0.029 | 0.004 | 0.033 |
| [(CH3)4N]Cl | −3.77 | 0.321 | −3.449 |
| [BMIM]BF4 | −2.64 | 0.378 | −2.262 |
| [(n-C8H17)(C4H9)3P]Br | −2.75 | 0.091 | −2.659 |
| [EMIM]AlCl4 | −1.19 | 0.366 | −0.824 |
![[thin space (1/6-em)]](https://www.rsc.org/images/entities/char_2009.gif) :
:![[thin space (1/6-em)]](https://www.rsc.org/images/entities/char_2009.gif) IL ratio of 10
IL ratio of 10![[thin space (1/6-em)]](https://www.rsc.org/images/entities/char_2009.gif) :
:![[thin space (1/6-em)]](https://www.rsc.org/images/entities/char_2009.gif) 3.3. These results suggest a 4.5-fold increase in the HDS activity versus blank Co–Mo/Al2O3 and 2.5-fold versus blank Pd–Ni–Mo/Al2O3 after coupling with [(n-C8H17)(C4H9)3P]Br. Furthermore, at 3-fold milder operating conditions than those for the classical HDS process,59,60 a DBT conversion of 70% with a low-cost (0.5 wt%) Pd-loaded Pd–Ni–Mo/Al2O3 catalyst coupled with [(n-C8H17)(C4H9)3P]Br credits this approach with great promise for industrial applications.
3.3. These results suggest a 4.5-fold increase in the HDS activity versus blank Co–Mo/Al2O3 and 2.5-fold versus blank Pd–Ni–Mo/Al2O3 after coupling with [(n-C8H17)(C4H9)3P]Br. Furthermore, at 3-fold milder operating conditions than those for the classical HDS process,59,60 a DBT conversion of 70% with a low-cost (0.5 wt%) Pd-loaded Pd–Ni–Mo/Al2O3 catalyst coupled with [(n-C8H17)(C4H9)3P]Br credits this approach with great promise for industrial applications.
4. Product analysis and proposed reaction mechanism
Qualitative analyses of the reaction products were performed via GC-MS and the chromatograms (pre- and post-HDS reaction) are presented in Fig. S8(a and b).† The DBT peak at the retention time of 14 min was recorded in both the samples.8 In the post reaction GC-MS chromatogram in Fig. S8b† (performed over Pd–Ni–Mo/Al2O3 catalyst at optimized conditions using 10 g of [(n-C8H17)(C4H9)3P]Br), a new peak for biphenyl (BP) was observed at 9.2 min. This evidenced the preferential direct desulfurization (DDS) pathway for the HDS of DBT.8,20 This is because at the low temperature of 120 °C, hydrogenation of the benzene ring is not feasible and hence C–S scission occurs preferentially via the DDS pathway. In the first step, H2 attacks the C–S bond, resulting in biphenyl-2-thiol, which is immediately hydrogenated to an unstable hydrogenated BP thiol intermediate, and which upon extraction of H2S leads to BP. No cyclohexylbenzene (CHB) was found in the product stream (Fig. S8(b)),† which could be due to insufficient catalytic active sites (having already been used up in the first hydrogenation step of DBT into BP) or engagement of IL with DBT. Another reason could be the mild operating conditions since catalytic hydrogenation of BP into CHB usually occurs at 300 °C and 6.6 MPa H2 pressure.63 The reaction mechanism presented in Scheme 1 proposes that the strongly electrophilic Pd active phase in Pd–Ni–Mo/Al2O3 readily attacks the electron-rich sulfur center of DBT via the DDS pathway, which was further augmented by the synergistic effect of the IL (as DBT extractant)64 and hence an enhanced DBT conversion (70%) was observed with the coupled application of Pd–Ni–Mo/Al2O3 with [(n-C8H17)(C4H9)3P]Br compared to that for the blank catalyst. From the GC-MS results, it was concluded that the IL merely changed the activity of the HDS process rather than altering the selectivity and chemistry of the HDS reaction.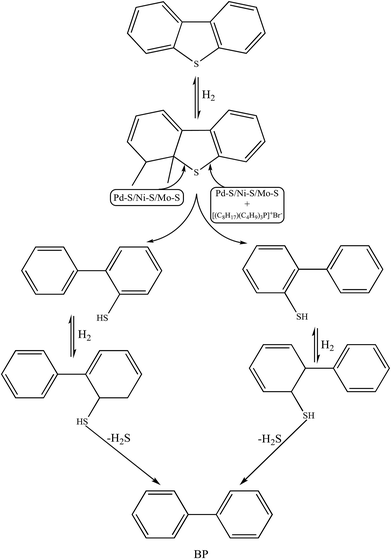 | ||
| Scheme 1 Proposed reaction mechanism for HDS reaction by blank Pd–Ni–Mo/Al2O3 and Pd–Ni–Mo/Al2O3 coupled with IL. | ||
5. Conclusions
This study reported the integrated application of selected ILs with low Pd (0.5 wt%) loaded Co–Mo/Al2O3 and Ni–Mo/Al2O3 catalysts in the HDS of DBT under mild operating conditions. The coupled application of ILs synergistically increased the HDS activity of the solid catalysts by about four-fold folds at three times milder operating conditions compared to the conventional HDS process. At genial operating conditions of 1 MPa H2 pressure, 120 °C temperature, oil![[thin space (1/6-em)]](https://www.rsc.org/images/entities/char_2009.gif) :
:![[thin space (1/6-em)]](https://www.rsc.org/images/entities/char_2009.gif) IL ratio of 10
IL ratio of 10![[thin space (1/6-em)]](https://www.rsc.org/images/entities/char_2009.gif) :
:![[thin space (1/6-em)]](https://www.rsc.org/images/entities/char_2009.gif) 3.3 and 4 h reaction time, 70% DBT conversion was achieved over Pd–Ni–Mo/Al2O3 coupled with [(n-C8H17)(C4H9)3P]Br. Textural characterization revealed that Pd incorporation decreased the surface area while increasing the pore diameter of the pristine catalysts. DFT simulations validated that enhanced HDS activity of the solid catalysts coupled with ILs was owing to the synergistic effect of extraction by IL and hydrogenation by the solid catalyst. The IL could be recycled four times with minimal loss of HDS activity. GC-MS results confirmed that the HDS reaction under the current setup followed the DDS pathway. The present approach with its cost-effectiveness (0.5 wt% Pd loading), extremely mild operating conditions with good catalytic activity, and simplified mechanization could be deemed as an alternative approach for the HDS of fuel oils on an industrial level.
3.3 and 4 h reaction time, 70% DBT conversion was achieved over Pd–Ni–Mo/Al2O3 coupled with [(n-C8H17)(C4H9)3P]Br. Textural characterization revealed that Pd incorporation decreased the surface area while increasing the pore diameter of the pristine catalysts. DFT simulations validated that enhanced HDS activity of the solid catalysts coupled with ILs was owing to the synergistic effect of extraction by IL and hydrogenation by the solid catalyst. The IL could be recycled four times with minimal loss of HDS activity. GC-MS results confirmed that the HDS reaction under the current setup followed the DDS pathway. The present approach with its cost-effectiveness (0.5 wt% Pd loading), extremely mild operating conditions with good catalytic activity, and simplified mechanization could be deemed as an alternative approach for the HDS of fuel oils on an industrial level.
Conflicts of interest
The authors declare no conflict of interest.Acknowledgements
The authors are thankful to the Natural Science Foundation of Guangxi (2017GXNSFDA198047), the Higher Education Commission of Pakistan (Project No: 3365), the Dean Project of Guangxi Key Laboratory of Petro-chemical Resource Processing and Process Intensification Technology (2017Z001 & 2015Z010) and the Postdoctoral Fund of Department of Human Resources and Social Security of Guangxi Zhuang Autonomous Region for the financial support.References
- H. Hori, K. Ogi, Y. Fujita, Y. Yasuda, E. Nagashima, Y. Matsuki and K. Nomiya, Fuel Process. Technol., 2018, 179, 175–183 CrossRef CAS.
- Y. Muhammad, A. Shoukat, A. U. Rahman, H. U. Rashid and W. Ahmad, Chin. J. Chem. Eng., 2018, 26(3), 593–600 CrossRef.
- S. Bhatia and D. K. Sharma, Biochem. Eng. J., 2010, 50, 104–109 CrossRef CAS.
- E. Kianpour, S. Azizian, M. Yarie, M. A. Zolfigol and M. Bayat, Chem. Eng. J., 2016, 295, 500–508 CrossRef CAS.
- M. J. B. Souza, A. M. Garrido Pedrosa, J. A. Cecilia, A. M. Gil-Mora and E. Rodríguez-Castellón, Catal. Commun., 2015, 69, 217–222 CrossRef CAS.
- U. T. Turaga and C. Song, Catal. Today, 2003, 86, 129–140 CrossRef CAS.
- R. Singh, D. Kunzru and S. Sivakumar, Catal. Sci. Technol., 2016, 6, 5949–5960 RSC.
- Y. Muhammad, Y. Lu, C. Shen and C. Li, Energy Convers. Manage., 2011, 52, 1364–1370 CrossRef CAS.
- W. Shi, L. Zhang, Z. Ni, S. Xia and X. Xiao, RSC Adv., 2014, 4, 58315–58324 RSC.
- H. Ziaei-Azad and N. Semagina, Appl. Catal., B, 2016, 191, 138–146 CrossRef CAS.
- Y. Muhammad and C. Li, Fuel Process. Technol., 2011, 92, 624–630 CrossRef CAS.
- O. Y. Gutiérrez and T. Klimova, J. Catal., 2011, 281, 50–62 CrossRef.
- K. Sakanishi, T. Nagamatsu, I. Mochida and D. D. Whitehurst, J. Mol. Catal. A: Chem., 2000, 155, 101–109 CrossRef CAS.
- H. Gao, S. Zeng, X. Liu, Y. Nie, X. Zhang and S. Zhang, RSC Adv., 2015, 5, 30234–30238 RSC.
- Z. Li, J. Xu, D. Li and C. Li, RSC Adv., 2015, 5, 15892–15897 RSC.
- A. Arce, M. Francisco and A. Soto, J. Chem. Thermodyn., 2010, 42, 712–718 CrossRef CAS.
- P. J. Dyson, D. J. Ellis, T. Welton and D. G. Parker, Chem. Commun., 1999, 25–26 RSC.
- F. Dai, Y. Muhammad, X. Gong, C. Li, Z. Li and S. Zhang, Fuel, 2014, 134, 74–80 CrossRef CAS.
- R. Navarro, B. Pawelec, J. L. G. Fierro, P. T. Vasudevan, J. F. Cambra, M. B. Guemez and P. L. Arias, Fuel Process. Technol., 1999, 61, 73–88 CrossRef CAS.
- R. H. Bowker, M. C. Smith, B. A. Carrillo and M. E. Bussell, Top. Catal., 2012, 55, 999–1009 CrossRef CAS.
- M. Yaseen, M. Shakirullah, I. Ahmad, A. U. Rahman, F. U. Rahman, M. Usman and R. Razzaq, J. Fuel Chem. Technol., 2012, 40, 714–720 CrossRef CAS.
- A. A. Lemonidou, L. Nalbandian and I. A. Vasalos, Catal. Today, 2000, 61, 333–341 CrossRef CAS.
- J. A. Cecilia, A. Infantes-Molina, E. Rodríguez-Castellón and A. Jiménez-López, J. Catal., 2009, 263, 4–15 CrossRef CAS.
- D. Ferdous, A. K. Dalai and J. Adjaye, Appl. Catal., A, 2004, 260, 153–162 CrossRef CAS.
- M. S. Rana, E. M. R. Capitaine, C. Leyva and J. Ancheyta, Fuel, 2007, 86, 1254–1262 CrossRef CAS.
- Y. Huang, Z. Zhou, Y. Qi, X. Li, Z. Cheng and W. Yuan, Chem. Eng. J., 2011, 172, 444–451 CrossRef CAS.
- A. M. Venezia, V. L. Parola, B. Pawelec and J. L. G. Fierro, Appl. Catal., A, 2004, 264, 43–51 CrossRef CAS.
- M. Zhu, Y. Muhammad, P. Hu, B. Wang, Y. Wu, X. Sun, Z. Tong and Z. Zhao, Appl. Catal., B, 2018, 232, 182–193 CrossRef CAS.
- S. K. Maity, E. Blanco, J. Ancheyta, F. Alonso and H. Fukuyama, Fuel, 2012, 100, 17–23 CrossRef CAS.
- M. Rezaei, S. M. Alavi, S. Sahebdelfar, P. Bai, X. Liu and Z.-F. Yan, Appl. Catal., B, 2008, 77, 346–354 CrossRef CAS.
- K. Djebaili, Z. Mekhalif, A. Boumaza and A. Djelloul, J. Spectrosc., 2015, 2015, 16 Search PubMed.
- K. Zhou, X. Sun, Y. Muhammad, P. Hu, Y. Li, Z. Tong and Z. Zhao, Appl. Catal., A, 2018, 555, 138–147 CrossRef CAS.
- F.-L. Pua, C. H. Chia, S. Zakari, T. K. Liew, M. A. Yarmo and N. M. Huang, Sains Malays., 2010, 39, 243–248 CAS.
- K.-K. Liu, W. Zhang, Y.-H. Lee, Y.-C. Lin, M.-T. Chang, C.-Y. Su, C.-S. Chang, H. Li, Y. Shi and H. Zhang, Nano Lett., 2012, 12, 1538–1544 CrossRef CAS PubMed.
- M. L. Toebes, J. H. Bitter, A. J. van Dillen and K. P. de Jong, Catal. Today, 2002, 76, 33–42 CrossRef CAS.
- S. J. Sawhill, D. C. Phillips and M. E. Bussell, J. Catal., 2003, 215, 208–219 CrossRef CAS.
- J. Iranmahboob, S. D. Gardner, H. Toghiani and D. O. Hill, J. Colloid Interface Sci., 2004, 270, 123–126 CrossRef CAS PubMed.
- A. Sarkar, A. V. Murugan and A. Manthiram, J. Phys. Chem. C, 2008, 112, 12037–12043 CrossRef CAS.
- H. W. Wang, P. Skeldon and G. E. Thompson, Surf. Coat. Technol., 1997, 91, 200–207 CrossRef CAS.
- C. W. Yi, K. Luo, T. Wei and D. W. Goodman, J. Phys. Chem. B, 2005, 109, 18535–18540 CrossRef CAS PubMed.
- K. K. Sarda, A. Bhandari, K. K. Pant and S. Jain, Fuel, 2012, 93, 86–91 CrossRef CAS.
- R. Palcheva, L. KaluŽA, A. Spojakina, K. JirÁTovÁ and G. Tyuliev, Chin. J. Catal., 2012, 33, 952–961 CrossRef CAS.
- A. Aguirre-Gutiérrez, J. A. M. de la Fuente, J. A. de los Reyes, P. del Angel and A. Vargas, J. Mol. Catal. A: Chem., 2011, 346, 12–19 CrossRef.
- Z. Ma, S. H. Overbury and S. Dai, J. Mol. Catal. A: Chem., 2007, 273, 186–197 CrossRef CAS.
- S. Zhang, Q. Zhang and Z. C. Zhang, Ind. Eng. Chem. Res., 2004, 43, 614–622 CrossRef CAS.
- H. Li, Y. Chang, W. Zhu, W. Jiang, M. Zhang, J. Xia, S. Yin and H. Li, J. Phys. Chem. B, 2015, 119, 5995–6009 CrossRef CAS PubMed.
- F.-t. Li, R.-h. Liu, W. Jin-hua, D.-s. Zhao, Z.-m. Sun and Y. Liu, Green Chem., 2009, 11, 883–888 RSC.
- W. Jiang, W. Zhu, H. Li, J. Xiong, S. Xun, Z. Zhao and Q. Wang, RSC Adv., 2013, 3, 2355–2361 RSC.
- C. Song, Catal. Today, 2003, 86, 211–263 CrossRef CAS.
- O. U. Ahmed, F. S. Mjalli, A. M. Gujarathi, T. Al-Wahaibi, Y. Al-Wahaibi and I. M. AlNashef, Fluid Phase Equilib., 2015, 401, 102–109 CrossRef CAS.
- H. Yao, G. Wang, C. Zuo, C. Li, E. Wang and S. Zhang, Green Chem., 2017, 19, 1692–1700 RSC.
- A. P. Abbott, G. Capper, D. L. Davies, R. K. Rasheed and V. Tambyrajah, Chem. Commun., 2003, 70–71, 10.1039/B210714G.
- J. Jacquemin, P. Husson, V. Majer and M. F. Costa Gomes, J. Solution Chem., 2007, 36, 967–979 CrossRef CAS.
- R. Luo, X. Zhou, W. Zhang, Z. Liang, J. Jiang and H. Ji, Green Chem., 2014, 16, 4179–4189 RSC.
- M. S. Rana, J. Ancheyta, P. Rayo and S. K. Maity, Fuel, 2007, 86, 1263–1269 CrossRef CAS.
- V. Rabarihoela-Rakotovao, S. Brunet, G. Perot and F. Diehl, Appl. Catal., A, 2006, 306, 34–44 CrossRef CAS.
- M. S. Rana, A. Al-Barood, R. Brouresli, A. W. Al-Hendi and N. Mustafa, Fuel Process. Technol., 2018, 177, 170–178 CrossRef CAS.
- Y. J. Heintz, L. Sehabiague, B. I. Morsi, K. L. Jones, D. R. Luebke and H. W. Pennline, Energy Fuels, 2009, 23, 4822–4830 CrossRef CAS.
- R. Huirache-Acuña, T. A. Zepeda, E. M. Rivera-Muñoz, R. Nava, C. V. Loricera and B. Pawelec, Fuel, 2015, 149, 149–161 CrossRef.
- S. J. Danforth, D. R. Liyanage, A. Hitihami-Mudiyanselage, B. Ilic, S. L. Brock and M. E. Bussell, Surf. Sci., 2016, 648, 126–135 CrossRef CAS.
- T. P. Thuy Pham, C.-W. Cho and Y.-S. Yun, Water Res., 2010, 44, 352–372 CrossRef PubMed.
- M. Smiglak, J. Pringle, X. Lu, L. Han, S. Zhang, H. Gao, D. MacFarlane and R. Rogers, Chem. Commun., 2014, 50, 9228–9250 RSC.
- M. Koussathana, D. Vamvouka, H. Economou and X. Verykios, Appl. Catal., 1991, 77, 283–301 CrossRef CAS.
- H. Gao, C. Guo, J. Xing, J. Zhao and H. Liu, Green Chem., 2010, 12, 1220–1224 RSC.
Footnote |
| † Electronic supplementary information (ESI) available. See DOI: 10.1039/c9ra00095j |
| This journal is © The Royal Society of Chemistry 2019 |

