 Open Access Article
Creative Commons Attribution 3.0 Unported Licence
High-temperature ferroelastic phase transition in a perovskite-like complex: [Et4N]2[PbBr3]2†
Yuan Huanga,
Jie Yanga,
Zi-jian Lib,
Kun Qian *a and
Feng Sao*c
aCollege of Pharmacy, Jiangxi University of Traditional Chinese Medicine, Nanchang, 330004, P. R. China. E-mail: qk0876@hotmail.com
bShanghai Institute of Applied Physics, Chinese Academy of Sciences, Shanghai, 201800, P. R. China. E-mail: lizijian@sinap.ac.cn
cLaboratory of Modern Preparation of TCM, Ministry of Education, Jiangxi University of Traditional Chinese Medicine, Nanchang, 330004, P. R. China. E-mail: shaofeng0729@163.com
First published on 2nd April 2019
Abstract
A new lead-bromide hybrid organic–inorganic complex [Et4N]2[PbBr3]2 (Et = ethyl) was synthesized, and its crystal structures could be described as a distorted perovskite-like one (at room temperature phase and at high temperature phase) and a step-like dielectric anomaly was obtained at around 375 K upon heating and 367 K upon cooling. It underwent a reversible structural phase transition with the Aizu notation of 6/mmmF2/m belonging to one of the 94 species of ferroelastic phase transitions, displayed switchable dielectric behaviors triggered by the motion or reorientation of the tetraethylammonium cations and the displacement of Pb2+ and Br− ions in a solid-state crystal. Ferroelastic domain walls were also observed in atomic-force microscopy. Differential scanning calorimetry, dielectric measurements and variable-temperature X-ray structure determinations indicated this complex exhibited a dielectric anomaly associated with the structural phase transition. All of these demonstrate its potential application as a temperature switchable molecular dielectric material in the ferroic-related field.
Introduction
Ferroelastic materials have drawn special attention due to their prominent role in the construction and development of multiferroic materials with promising potential applications such as mechanical switches.1–5 Ferroelasticity is a phenomenon in which a material may exhibit a spontaneous strain. In ferroics, ferroelasticity is the mechanical equivalent of ferroelectricity and ferromagnetism. When stress is applied to a ferroelastic material, a phase change will occur in the material from one phase to an equally stable phase, either of different crystal structure (e.g. cubic to tetragonal), or of different orientation (a ‘twin’ phase). This stress-induced phase change results in a spontaneous strain in the material. The shape-memory effect and superelasticity are manifestations of ferroelasticity. Nitinol (nickel titanium), a common ferroelastic alloy, can display either super elasticity or the shape-memory effect at room temperature, depending on the nickel/titanium ratio.6–34 As it is fairly a difficult experimental task to measure the ferroelastic hysteresis with any acceptable degree of accuracy, it has become conventional to call a material ‘ferroelastic’ when a phase transition belonging to one of the 94 species of ferroelastic phase transitions defined by Aizu occurs (or may be thought to occur) which may convincingly generate ferroelasticity.35 Moreover, ferroelastic domain, which can be observed as a result of the reduction in symmetry between the paraelastic and ferroelastic phases, is an important ingredient in functionalities of ferroelastic materials.36Many of these materials are oxides and some halide perovskites, such as lead zirconate titanate (PZT) and BaTiO3. In recent years, the organic–inorganic perovskite-type hybrids attract increasing attention owing to their diverse applications in data communication, rewritable optical data storage, thermal energy storage and mechanical energy transfer, etc.7,37–48 For example, an organic–inorganic perovskite piezoelectric, Me3NCH2ClMnCl3, exhibits a piezoelectric coefficient d33 of 185 pC N−1. Such a large d33 makes it a molecular material with a piezoelectric coefficient comparable with that of piezoelectric ceramics such as BaTiO3 and a high phase-transition temperature of 406 K beyond that of BaTiO3 (393 K).37 Another two-dimensional (2D) perovskite ferroelectric, (C4H9NH3)2CsPb2Br7, shows a high Curie temperature (TC = 412 K) beyond that of BaTiO3 (393 K) and notable spontaneous polarization (4.2 μC cm−2).38 In addition, an organic–inorganic perovskite-type compound [(CH3)3PCH2OH][CdBr3] exhibits a ferroelastic phase transition at 339 K. The origin of the phase transition can be attributed to the motion or reorientation of the [(CH3)3PCH2OH]+ cations and the displacement of Cd2+ and Br− ions in solid-state crystal.7 The two-dimensional multilayered perovskite ferroelectric, (C4H9NH3)2(CH3NH3)2Pb3Br10, shows prominent detecting behaviors including extremely low dark current (10−12 A), large on/off current ratio (2.5 × 10³) and highly-fast response rate (150 μs). These merits are superior to integrated detectors of other 2D perovskites, and compete with the most active CH3NH3PbI3.44
Encouraged by these perovskite-type compounds, we synthesized an organic–inorganic hybrid perovskite-like complex [Et4N]2[PbBr3]2 (1). Dielectric measurement and variable-temperature structural analyses indicated complex 1 showed a dielectric anomaly associated with the structural phase transition. Complex 1 underwent a reversible dielectric phase transition with the Aizu notation of 6/mmmF2/m belonging to one of the 94 species of ferroelastic phase transitions, displayed switchable dielectric behaviors triggered by the motion or reorientation of the tetraethylammonium cations and the displacement of Pb2+ and Br− ions in solid-state crystal. Ferroelastic domain walls were also observed in atomic-force microscopy (AFM).
Experimental
Synthesis
All starting reagents and solvents employed for synthesis were commercially available and used without further purification. Complex 1 was synthesized as needle-shaped single crystals by slow evaporation of the mixture solution of lead bromide and tetraethylammonium bromide in the molar ratio of 1![[thin space (1/6-em)]](https://www.rsc.org/images/entities/char_2009.gif) :
:![[thin space (1/6-em)]](https://www.rsc.org/images/entities/char_2009.gif) 1 in a 40% hydrobromic acid solution.
1 in a 40% hydrobromic acid solution.
IR spectrum and elemental analyses
The IR spectrum was recorded in the range of 4000–400 cm−1 on a Tensor 27 OPUS (Bruker) FT-IR spectrometer from KBr pellets. Elemental analyses (C, H, and N) were performed on a Model 240 Perkin-Elmer elemental analyzer.Thermal measurements
Thermogravimetric analysis was recorded on a DSC/DTA-TG SDT-Q600 instrument at the heating rate of 20 K min−1 under nitrogen atmosphere from 300 to 860 K in alumina crucibles. Differential scanning calorimetry (DSC) was performed by heating and cooling the polycrystalline samples on a Perkin-Elmer Diamond DSC instrument in the temperature range 330–420 K with a heating and cooling rate of 10 K min−1 under nitrogen at atmospheric pressure in aluminum crucibles.Single crystal structure determination
X-ray data for the title complex 1 was collected on a Bruker Smart APEX II diffractometer with MoKα radiation (λ = 0.71073 Å) by using an φ–ω scan mode at 296 K and with CuKα radiation (λ = 0.15406 Å) at 393 K. Data processing including empirical absorption corrections was performed using the Crystal Clear software package (Rigaku, 2005). Absorption corrections were applied using the SADABS program.49 The structures were solved by Direct Methods50 with the SHELXTL program and refined by full matrix least-squares techniques on F2 with the SHELXTL program.50–52 Non-H atoms were refined anisotropically using all reflections with I > 2σ(I). All H atoms were generated geometrically and refined using a “riding” model with Uiso = 1.2Ueq (C and N). Crystallographic data and structure refinement Details at 296 and 393 K are given in Table S1.†Dielectric measurements
The complex dielectric permittivity ε (ε = ε′ − iε′′) was measured on a Tonghui TH2828A at frequencies of 500 to 1 MHz with an applied alternating electric field of 1 V. The powder-pressed pellets and single crystal sample deposited with silver conducting glue were used in dielectric measurements.AFM determination
To observe the possible boundary microstructure of complex 1 by atomic force microscopy,53–62 well-developed crystals with acceptable size were drawn from solution and the freshly cleaved crystal wafer was fixed on the AFM sample holder. All the images were collected using a Nanoscope, IIIa MultiMode AFM instrument of Digital Instruments Incorporation, with DI square pyramidal Si3N4 tips on V-shaped cantilevers of 100 mm in length with 0.06 N m−1 spring constants. Since the samples may result in scratching images after being scanned many times, all the zoomed areas were scanned only once to collect the possible intrinsic micro-structural images.Results and discussion
IR properties
The structure of complex 1 was characterized by IR spectroscopy. The infrared spectrum of complex 1 was consistent with its formulation (Fig. S1†). Strong IR bands centred at 2986 cm−1 can be assigned to the νC–H stretching vibration of –CH3 groups. Strong IR bands centred at 1390 to 1482 cm−1 can be assigned to νC–H flexural vibration of the tetraethylammonium cations.Thermal properties
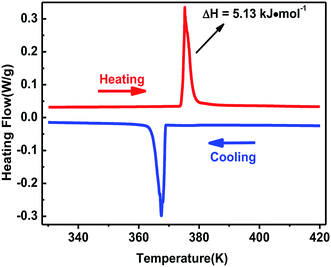
The curve of TG-DTA was tested at the temperature ranging from 300 to 860 K under nitrogen atmosphere. As shown in Fig. S2,† the weight curve shows that complex 1 began to melt till about 600 K, and the heat flow curve shows that a peak occured at 375 K which indicates a phase change may exist. The phase transition behavior of complex 1 was confirmed by differential scanning calorimetry in the temperature ranging from 330 to 420 K. A couple of heat anomalies at 375 K upon heating and 367 K upon cooling were observed in the DSC curves (Fig. 1), indicating that complex 1 underwent a reversible phase transition at around T = 375 K upon heating. For convenience, we labelled the phase above 375 K as the high-temperature phase (HTP), and the phase below 367 K as room-temperature phase (RTP).On the basis of DSC curves, the average entropy change ΔS was estimated to be approximately 13.69 J mol−1 K−1. According to the Boltzmann equation ΔS = R![[thin space (1/6-em)]](https://www.rsc.org/images/entities/char_2009.gif) ln(N), where R is the gas constant and N represents the proportion of numbers of possible orientations for the whole disordered system. The value N is calculated to be 5.19, suggesting the order-disorder phase transition feature of complex 1, which will be confirmed by the structural analysis.
ln(N), where R is the gas constant and N represents the proportion of numbers of possible orientations for the whole disordered system. The value N is calculated to be 5.19, suggesting the order-disorder phase transition feature of complex 1, which will be confirmed by the structural analysis.
Single crystal structure determination
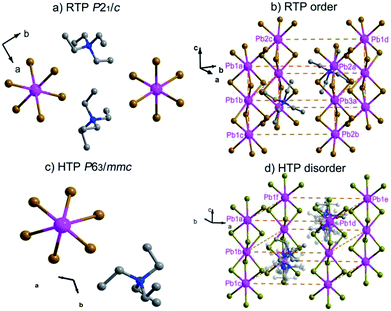
In order to reveal the details of structural phase transition, crystal structures of complex 1 were collected by variable-temperature X-ray single-crystal diffraction analysis at two different temperatures 296 K and 393 K, respectively. It reveals that complex 1 belongs to the monoclinic centrosymmetric space group P21/c at 296 K and the hexagonal centrosymmetric space group P63/mmc at 393 K (Table S1†). In both phases, each Pb atom is coordinated by six bridging Br− ions to give one-dimensional chains running along c axis (Fig. 2a, Fig. 2c). From RTP to HTP with an increasing temperature, the crystal structures in both phases can be roughly described as distorted perovskite-like ones (Fig. 2b and d). Upon heating, all the Pb–Br bond lengths and Br–Pb–Br bond angles changed within the normal ranges. Especially, the tetraethylammonium cations show changes from RTP to HTP, from order to a six-fold disorder, giving rise to the higher symmetry.In the RTP, each Pb atom, lying in the 21 screw axis, is octahedrally coordinated by six bridging Br− atoms with Pb–Br bond distances varying from 2.949(9) to 3.133(9) Å and Br–Pb–Br angles varying from 80.49(3) to 99.51(3)° (Table S2†). The distances of N and C atoms vary from 1.479(8) to 1.541(8) Å, the angles of C–N–C vary from 106.20(5) to 112.20(5)°. Whereas in the HTP, with each Pb1 atom occupying the 3m symmetry site, the Pb–Br bond distance changes to 3.030(1) Å and the Br–Pb–Br bond angles are in the range from 81.59(10) to 98.41(10)°. The C–N bond lengths vary from 1.480(2) to 1.500(2) Å and the C–N–C bond angles vary from 108.40(18) to 110.60(18)° (Table S3†). Whereas in the HTP, the cationic part is completely disordered, the tetraethylammonium cations exhibits disorder over six positions (Fig. 2d).
As shown in Fig. S3,† the stacking structure changes slightly due to movement of molecules. The Pb1a⋯Pb1c distance in the RTP increases little from 7.838 to 7.954 Å (Pb1a⋯Pb1c distance in the HTP). With the C, H, N atoms omitted for clarity in Fig. S3,† the neighbouring Pb1a⋯Pb2a distance (10.490 Å) in the RTP is obviously shorter than the corresponding Pb1a⋯Pb1d distance (10.595 Å) in the HTP, while the neighbouring Pb1a⋯Pb2c distance (10.545 Å) in the RTP is shorter than Pb1a⋯Pb1f distance (10.595 Å) in the HTP. Meanwhile, the Pb2c⋯Pb1a⋯Pb2a angle in the RTP changes from 62.37 to 60.00° (Pb1d⋯Pb1a⋯Pb1f angle in the HTP).
The cage units per cell decrease from four (in the RTP) to two (in the HTP) during the heating process. What is noteworthy is that the structure parameters change tremendously from RTP to HTP [a, b, c (Å): 10.892(3), 35.883(10), 7.838(2) vs. 10.595(6), 10.595(6), 7.954(6)]. The comparison of the two phases is clearly shown in Fig. 3. The phase transition may be ascribed to the motion or rotation of tetraethylammonium cations and the displacement of Pb2+ and Br− ions upon heating.
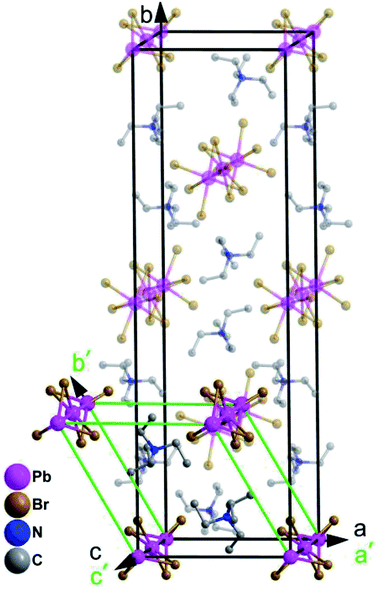 | ||
| Fig. 3 The room temperature crystal cell of complex 1 (outlined in black solid lines) and its high temperature unit cell (outlined in green solid lines). | ||
Dielectric properties of complex 1
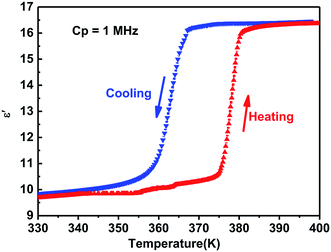
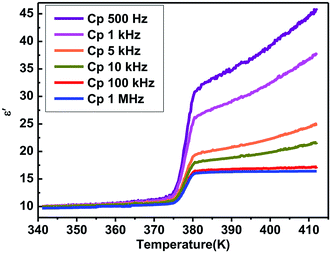
Generally, phase transitions are always accompanied by anomalies of physical properties as responses to external stimuli. Hence, the temperature-dependent dielectric permittivity measurements of complex 1 were performed on polycrystalline at different frequencies. The temperature dependence of the real part ε′ of the complex constant (ε = ε′ − iε′′, ε′′ is the imaginary part) was measured with the temperature ranging from 330 to 400 K shown in Fig. 4. For complex 1, obvious step-like dielectric anomalies at around 375 K upon the heating process and 367 K upon the cooling process are obtained. At 1 MHz, upon the heating process the ε′ kept stable with a value of about 10.0 when the temperature was ranging from 330 to 375 K, which corresponds to a low dielectric state. At 375 K, the ε′ value rapidly increases to reach a value of about 16.1 and transfers to a high dielectric state. Upon the cooling process, the ε′ kept stable with a value of about 16.1 when the temperature was ranging from 400 to 367 K, which corresponds to a high dielectric state. At 367 K, the ε′ value rapidly decreases to reach a value of about 10.0 and transfers to a low dielectric state. The value of about 16.1 in the high dielectric state that is almost 1.6 times that obtained in the low dielectric state. The dielectric anomalies are in conformity with the thermal anomalies of DSC measurement (Fig. 1).Furthermore, the dielectric constant (ε′) of the complex dielectric permittivity of the polycrystalline sample measured at 500, 1 K, 10 K, 100 K, 500 K, 1 MHz at the temperature ranging from 340 to 410 K is shown in Fig. 5. The variable-frequency dielectric response shows a frequency-dependent phenomenon. At different frequencies, the ε′ keeps a little increasing with the value of about 10.0 below 375 K, which corresponds to a low dielectric state. When the temperature increases to 375 K, a striking step-like anomaly appears, which corresponds to a high dielectric state. As the temperature increases further, ε′ value goes up a small increase. At the high dielectric state, the ε′ and ε′′ value decrease with the frequencies increase at the same temperature (Fig. 5 and S4†).
Ferroelastic domain walls observed in AFM
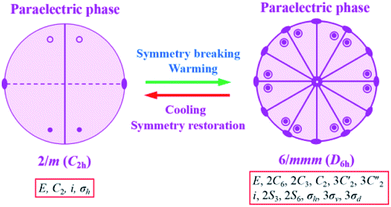
It is noted that the unit cell parameters vary greatly from HTP to LTP, and the crystal system changes from hexagonal type to monoclinic type during the cooling process and space group change from P63/mmc to P21/c. The twenty four symmetry elements (E, 2C6, 2C3, C2, 3C′2, 3C2′′, i, 2S3, 2S6, σh, 3σv, 3σd) in the HTP decrease to four (E, C2, i, σh) in the RTP. According to Aizu notation, it can be classified into the 6/mmmF2/m species, and the phase transition should be ferroelastic according to the 94 species of ferroelastic phase transitions. The possible domain number is q = 24/4, hence the number of equivalent unique ferroelastic directions is up to 6. That is, the spatial orientations of six ferroelastic domains are considered as a result of symmetry reduction. The Curie symmetry principle tells us that the space group at the ferroelastic phase should be the subspace group at the paraelastic phase, i.e. its maximal non-isomorphic subgroups containing![[1 with combining macron]](https://www.rsc.org/images/entities/char_0031_0304.gif) , 6/m, 2/m(3), 2/m(3), respectively. Furthermore, the number of spatial symmetry operations decrease from 24 to 4 during the symmetry breaking process (Fig. 6), in good agreement with macroscopic symmetry breaking.
, 6/m, 2/m(3), 2/m(3), respectively. Furthermore, the number of spatial symmetry operations decrease from 24 to 4 during the symmetry breaking process (Fig. 6), in good agreement with macroscopic symmetry breaking.
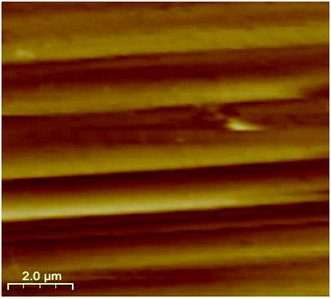
As a promising tool to observe the surface morphology down to the atomic dimensional scale, AFM has been employed to investigate the permissible domains and surface patterns correlated with the boundary structures. It is expected that the surface patterns may reflect the orientation of the domain structure. Here, a clear boundary-contrast AFM topography imaging was recorded in freshly crystal samples of complex 1. As shown in Fig. 7, AFM image of a cleavage surface pattern in complex 1 with the scanning area of 10.0 × 10.0 μm2, and one can observe the ferroelastic domain walls clearly. These ferroelastic domain walls are nearly parallel each other and distinctly reflect the orientation of the domain structure. The boundaries between two different states are well-defined, and the domains of the width of approximately 1.3 μm.
From the perspective of symmetry change, the transition fulfills the reverse group–subgroup relation. One analogous compound [(CH3)3PCH2OH][CdBr3] exhibits a ferroelastic phase transition at 339 K. Its symmetry change occurred with an Aizu notation of 6/mmmFmmm. Domain structures were observed and analysed.7 A similar behavior in (TMA)(TEA)MnBr4 suggests that ferroelastic phase exists in this crystal, and the ferroelastic domain structure consistent with Aizu species  was revealed.11,14 In another analogous compound [N(CH3)4][Cd(N3)3], its phase transition should be ferroelastic with an Aizu notation of m3mF2/m, and the number of equivalent unique ferroelastic directions is up to 12. There was no domain structure reported.21 An organic co-crystal with a perovskite-like architecture, dabco p-nitrophenol, undergoes a reversible ferroelastic phase transition with the Aizu notation of 2/mF
![[1 with combining macron]](https://www.rsc.org/images/entities/char_0031_0304.gif) at around 128 K. Clear-cut regions with different growth directions of units are presented by AFM, in which polydirectional growth might give rise to the permissible boundary or even domain walls in adjacent areas.23 The ferroelectrics NaKC4H4O6·4H2O (the crystal commonly known as Rochelle salt) exhibits two Curie points. The ferroelectric phase of this material is also ferroelastic and it exists between 255 and 297 K.63 Both the spontaneous polarization and strain rise with increasing temperature above the lower Curie point.64
at around 128 K. Clear-cut regions with different growth directions of units are presented by AFM, in which polydirectional growth might give rise to the permissible boundary or even domain walls in adjacent areas.23 The ferroelectrics NaKC4H4O6·4H2O (the crystal commonly known as Rochelle salt) exhibits two Curie points. The ferroelectric phase of this material is also ferroelastic and it exists between 255 and 297 K.63 Both the spontaneous polarization and strain rise with increasing temperature above the lower Curie point.64
Conclusions
In summary, the present work has successfully demonstrated a new lead-bromide organic–inorganic hybrid complex [Et4N]2[PbBr3]2. The crystal structure of title complex can be described as a distorted perovskite-like one and exhibits a dielectric phase transition around 375 K upon heating and 367 K upon cooling. The results indicate that the dielectric phase transition is related to the motion or reorientation of the tetraethylammonium cations and the displacement of Pb2+ and Br− ions in solid-state crystal under the stimuli of variable temperature. It reveals a reversible ferroelastic phase transition with the Aizu notation of 6/mmmF2/m. Ferroelastic domain walls were also observed in atomic-force microscopy. This compound can be regarded as an excellent temperature stimuli-responsive dielectric material with ferroelastic phase transition and affords a promising strategy to search new materials.Conflicts of interest
There are no conflicts to declare.Acknowledgements
This work was supported by the Science and Technology Programme Project for Health and Family Planning Commission of Jiangxi Province in 2018 (No. 20183008), National Natural Science Foundation of China (Grants 21761014, 81260638).Notes and references
- V. Nagarajan, A. Roytburd, A. Stanishevsky, S. Prasertchoung, T. Zhao, L. Chen, J. Melngailis, O. Auciello and R. Ramesh, Nat. Mater., 2003, 2, 43 CrossRef CAS PubMed.
- N. Balke, S. Choudhury, S. Jesse, M. Huijben, Y.-H. Chu, A. P. Baddorf, L.-Q. Chen, R. Ramesh and S. V. Kalinin, Nat. Nanotechnol., 2009, 4, 868 CrossRef CAS PubMed.
- S. H. Baek, H. W. Jang, C. M. Folkman, Y. L. Li, B. Winchester, J. X. Zhang, Q. He, Y. H. Chu, C. T. Nelson, M. S. Rzchowski, X. Q. Pan, R. Ramesh, L. Q. Chen and C. B. Eom, Nat. Mater., 2010, 9, 309 CrossRef CAS PubMed.
- E. K. H. Salje, Annu. Rev. Mater. Res., 2012, 42, 265 CrossRef CAS.
- M. C. Gallardo, J. Manchado, F. J. Romero, J. D. Cerro, E. K. H. Salje, A. Planes, E. Vives, R. Romero and M. Stipcich, Phys. Rev. B: Condens. Matter Mater. Phys., 2010, 81, 174102 CrossRef.
- Y.-T. Liu, L. Collins, R. Proksch, S. Kim, B. R. Watson, B. Doughty, T. R. Calhoun, M. Ahmadi, A. V. Ievlev, S. Jesse, S. T. Retterer, A. Belianinov, K. Xiao, J.-S. Huang, B. G. Sumpter, S. V. Kalinin, B. Hu and O. S. Ovchinnikova, Nat. Mater., 2018, 17, 1013 CrossRef CAS PubMed.
- X. Zheng, L. Zhou, P.-P. Shi, F.-J. Geng, D.-W. Fu and Q. Ye, Chem. Commun., 2017, 53, 7756 RSC.
- A. R. Lim, S. W. Kim and Y. L. Joo, J. Appl. Phys., 2017, 121, 215501 CrossRef.
- Y.-H. Tan, B. Wang, Y. Liu, C.-S. Yang, H.-R. Wen and Y.-Z. Tang, ChemistrySelect, 2017, 2, 774 CrossRef.
- Y.-Z. Tang, Z.-F. Gu, C.-S. Yang, B. Wang, Y.-H. Tan and H.-R. Wen, ChemistrySelect, 2016, 1, 6772 CrossRef CAS.
- P. Szklarz, A. Ingram, Z. Czapla, C. Górecki and M. Szafrański, Phase Transitions, 2017, 90, 610 CrossRef CAS.
- A. R. Lim, Solid State Commun., 2016, 242, 25 CrossRef CAS.
- A. R. Lim, M. S. Kim and K. Y. Lim, Solid State Sci., 2016, 58, 101 CrossRef CAS.
- M. Szafrański, Cryst. Growth Des., 2016, 16, 3771 CrossRef.
- I. M. Hermes, S. A. Bretschneider, V. W. Bergmann, D. Li, A. Klasen, J. Mars, W. Tremel, F. Laquai, H.-J. Butt, M. Mezger, R. Berger, B. J. Rodriguez and S. A. L. Weber, J. Phys. Chem. C, 2016, 120, 5724 CrossRef CAS.
- I. N. Flerov, A. V. Kartashev, M. V. Gorev, E. V. Bogdanov, S. V. Mel'nikova, M. S. Molokeev, E. I. Pogoreltsev and N. M. Laptash, J. Fluorine Chem., 2016, 183, 1 CrossRef CAS.
- A. R. Lim, AIP Adv., 2016, 6, 0353071 Search PubMed.
- J. Han, S. Nishihara, K. Inoue and M. Kurmoo, Inorg. Chem., 2015, 54, 2866 CrossRef CAS PubMed.
- Y.-Y. Tang, Z.-H. Sun, C.-M. Ji, L.-N. Li, S.-Q. Zhang, T.-L. Chen and J.-H. Luo, Cryst. Growth Des., 2015, 15, 457 CrossRef CAS.
- L.-Z. Chen, D.-D. Huang, J.-Z. Ge and Q.-J. Pan, Inorg. Chem. Commun., 2014, 45, 5 CrossRef CAS.
- Z.-Y. Du, Y.-P. Zhao, W.-X. Zhang, H.-L. Zhou, C.-T. He, W. Xue, B.-Y. Wang and X.-M. Chen, Chem. Commun., 2014, 50, 1989 RSC.
- P. Czaja, J. Therm. Anal. Calorim., 2013, 113, 91 CrossRef CAS.
- Z.-H. Sun, X.-Q. Wang, J.-H. Luo, S.-Q. Zhang, D.-Q. Yuan and M.-C. Hong, J. Mater. Chem. C, 2013, 1, 2561 RSC.
- M. A. Carpenter, E. K. H. Salje and C. J. Howard, Phys. Rev. B: Condens. Matter Mater. Phys., 2012, 85, 2244301 CrossRef.
- Y. Zhang, K. Awaga, H. Yoshikawa and R.-G. Xiong, J. Mater. Chem., 2012, 22, 9841 RSC.
- I. A. Luk'yanchuk, A. Schilling, J. M. Gregg, G. Catalan and J. F. Scott, Phys. Rev. B: Condens. Matter Mater. Phys., 2009, 79, 1441111 Search PubMed.
- Y. Tsukada, T. Honma and T. Komatsu, Appl. Phys. Lett., 2009, 94, 0599011 Search PubMed.
- A. Togo, F. Oba and I. Tanaka, Phys. Rev. B: Condens. Matter Mater. Phys., 2008, 78, 1341061 CrossRef.
- Y. Matsuo, J. Hatori, Y. Nakashima and S. Ikehata, Solid State Commun., 2004, 130, 269 CrossRef CAS.
- I. Peral, G. Madariaga, A. Pérez-Etxebarria and T. Breczewski, Acta Crystallogr., Sect. B: Struct. Sci., 2000, 56, 215 CrossRef.
- M. H. Kuok, S. G. Ng, L. S. Tan, Z. L. Rang, M. Iwata and Y. Ishibashi, Solid State Commun., 1998, 108, 159 CrossRef CAS.
- A. V. Kityk, V. P. Soprunyuk, A. Fuith, W. Schranz and H. Warhanek, Phys. Rev. B: Condens. Matter Mater. Phys., 1996, 53, 6337 CrossRef CAS.
- W. Schildkamp, G. Schäfer and J. Spilker, Z. Kristallogr., 1984, 168, 187 CrossRef CAS.
- S. Kreske and V. Devarajan, J. Phys. C: Solid State Phys., 1982, 15, 7333 CrossRef CAS.
- E. K. H. Salje, Contemp. Phys., 2000, 41, 79 CrossRef CAS.
- J. Sapriel, Phys. Rev. B: Solid State, 1975, 12, 5128 CrossRef CAS.
- Y.-M. You, W.-Q. Liao, D.-W. Zhao, H.-Y. Ye, Y. Zhang, Q.-H. Zhou, X.-H. Niu, J.-L. Wang, P.-F. Li, D.-W. Fu, Z.-M. Wang, S. Gao, K.-L. Yang, J.-M. Liu, J.-Y. Li, Y.-F. Yan and R.-G. Xiong, Science, 2017, 357, 306 CrossRef CAS PubMed.
- Z.-Y. Wu, C.-M. Ji, L.-N. Li, J.-T. Kong, Z.-H. Sun, S.-G. Zhao, S.-S. Wang, M.-C. Hong and J.-H. Luo, Angew. Chem., Int. Ed., 2018, 57, 8140 CrossRef CAS PubMed.
- E. Strelcov, Q.-F. Dong, T. Li, J. Chae, Y.-C. Shao, Y.-H. Deng, A. Gruverman, J.-S. Huang and A. Centrone, Sci. Adv., 2017, 3, 1602165 CrossRef PubMed.
- Y. Nakayama, S. Nishihara, K. Inoue, T. Suzuki and M. Kurmoo, Angew. Chem., Int. Ed., 2017, 129, 9495 CrossRef.
- Z.-H. Sun, A. Zeb, S.-J. Liu, C.-M. Ji, T. Khan, L.-N. Li, M.-C. Hong and J.-H. Luo, Angew. Chem., Int. Ed., 2016, 55, 1 CrossRef.
- W.-J. Xu, C.-T. He, C.-M. Ji, S.-L. Chen, R.-K. Huang, R.-B. Lin, W. Xue, J.-H. Luo, W.-X. Zhang and X.-M. Chen, Adv. Mater., 2016, 28, 5886 CrossRef CAS PubMed.
- L.-N. Li, Z.-H. Sun, P. Wang, W.-D. Hu, S.-S. Wang, C.-M. Ji, M.-C. Hong and J.-H. Luo, Angew. Chem., Int. Ed., 2017, 56, 12150 CrossRef CAS PubMed.
- Y. Zhang, W.-Q. Liao, D.-W. Fu, H.-Y. Ye, C.-M. Liu, Z.-N. Chen and R.-G. Xiong, Adv. Mater., 2015, 27, 3942 CrossRef CAS PubMed.
- C.-M. Ji, S.-J. Liu, S.-G. Han, K.-W. Tao, Z.-H. Sun and J.-H. Luo, Angew. Chem., Int. Ed., 2018, 57, 16764 CrossRef CAS PubMed.
- P.-F. Li, W.-Q. Liao, Y.-Y. Tang, H.-Y. Ye, Y. Zhang and R.-G. Xiong, J. Am. Chem. Soc., 2017, 139, 8752 CrossRef CAS.
- L.-N. Li, X.-Y. Shang, S.-S. Wang, N.-N. Dong, C.-M. Ji, X.-Y. Chen, S.-G. Zhao, J. Wang, Z.-H. Sun, M.-C. Hong and J.-H. Luo, J. Am. Chem. Soc., 2018, 140, 6806 CrossRef CAS.
- Z.-Y. Du, T.-T. Xu, B. Huang, Y.-J. Su, W. Xue, C.-T. He, W.-X. Zhang and X.-M. Chen, Angew. Chem., Int. Ed., 2015, 54, 914 CrossRef CAS PubMed.
- G. M. Sheldrick, Sadabs, Program for Empirical Absorption Correction of Area Detector Data, University of Göttingen, Göttingen, Germany, 1996 Search PubMed.
- G. M. Sheldrick, Shelxtl (version 6.1), Software Reference Manual, Bruker AXS Inc, Madison, Wisconsin, USA, 2000 Search PubMed.
- G. M. Sheldrick, Acta Crystallogr., 1990, A46, 467 CrossRef CAS.
- G. M. Sheldrick, Acta Crystallogr., 2008, A64, 112 CrossRef PubMed.
- A. Agronin, Y. Rosenwaks and G. Rosenman, Appl. Phys. Lett., 2004, 85, 452 CrossRef CAS.
- S. B. Amar, R. Gargi and K. S. Shiv, Mater. Lett., 1998, 35, 28 CrossRef.
- B. Piotr and T. Zbigniew, Phase Transitions, 2008, 81, 971 CrossRef.
- B. Ulrich, M. Dagmar, A. Mois, B. Dirk, P. Andrew, V. T. Gustaaf and G. Bernd, Phase Transitions, 2000, 71, 243 CrossRef.
- B. Dirk, P. Andrew and B. U. G. Bernd, J. Phys. Condens. Matter, 1997, 9, 8397 CrossRef.
- M. Cheng, M.-W. Li, G.-J. Li and Y.-C. Cao, Sci. China: Technol. Sci., 2010, 53, 1554 CrossRef CAS.
- R. Czajka, S. Mielcarek, B. Mróz, S. Kaszczyszyn and J. Albers, Vacuum, 1999, 54, 53 CrossRef CAS.
- R. Kowalczyk, M. B. Zapart and W. Zapart, Ferroelectrics, 2012, 441, 33 CrossRef CAS.
- S.-Z. Li, B. Ulli, X.-D. Ding and K. H. S. Ekhard, Appl. Phys. Lett., 2016, 108, 022901 CrossRef.
- T. N. Thomas, T. A. Land, T. Martin, W. H. Casey and J. J. D. Yoreo, J. Cryst. Growth, 2004, 260, 566 CrossRef CAS.
- F. Jona and G. Shirane, Ferroelectric Crystals, Dover Publications Inc., New York, 1993 Search PubMed.
- K. Imai, J. Phys. Soc. Jpn., 1976, 41, 2005 CrossRef CAS.
Footnote |
| † Electronic supplementary information (ESI) available: CCDC 1867019 and 1867074. For ESI and crystallographic data in CIF or other electronic format see DOI: 10.1039/c9ra00804g |
| This journal is © The Royal Society of Chemistry 2019 |

