 Open Access Article
Study on the hydrogen production ability of high-efficiency bacteria and synergistic fermentation of maize straw by a combination of strains
Hongxu Bao*abc,
Xin Zhang ab,
Hongzhi Sua,
Liangyu Lia,
Zhizhong Lva and
Xinyue Zhanga
aSchool of Environmental Science, Liaoning University, Shenyang 110036, China. E-mail: baohongxu555@163.com; Fax: +86 024 62204818; Tel: +86 024 62202248
bKey Laboratory of Pollution Ecology and Environmental Engineering, Institute of Applied Ecology, Chinese Academy of Sciences, Shenyang 110016, China
cState Key Laboratory of Urban Water Resources and Environments, Harbin Institute of Technology, Harbin 150090, China. E-mail: waj0578@hit.edu; Fax: +86 451 86282195; Tel: +86 451 86282195
First published on 19th March 2019
Abstract
Based on the principle of reciprocal symbiosis and co-metabolism of mixed culture microorganisms, a group of high-efficiency maize straw-degrading hydrogen-producing complex bacteria X9 + B2 was developed by a strain matching optimization experiment. Systematic research and optimization experiments were carried out on the mechanism of the main controlling factors affecting the hydrogen production of the complex bacteria. The results showed that the optimum conditions for the acid blasting pre-treatment of maize straw as a substrate were as follows: when the inoculation amount was 6% and the inoculum ratio was 1![[thin space (1/6-em)]](https://www.rsc.org/images/entities/char_2009.gif) :
:![[thin space (1/6-em)]](https://www.rsc.org/images/entities/char_2009.gif) 1, at which point, we needed to simultaneously inoculate, the initial pH was 6, the substrate concentration was 12 g L−1, and the culture time was 40 h. The complex bacteria adopted the variable temperature and speed regulation hydrogen production operational mode; after the initial temperature of 37 °C for 8 hours, the temperature was gradually increased to 40 °C for 3 hours. The initial shaker speed was 90 rpm for 20 hours, and the speed was gradually increased to 130 rpm. The maximum hydrogen production rate obtained by the complex bacteria under these conditions was 12.6 mmol g−1, which was 1.6 times that of the single strain X9 with a maximum hydrogen production rate of 5.7 mmol g−1. Through continuous subculturing and the 10th, 20th, 40th, 60th, 80th, 100th and 120th generation fermentation hydrogen production stability test analysis, no significant difference was observed between generations; the maximum difference was not more than 5%, indicating better functional properties and stability.
1, at which point, we needed to simultaneously inoculate, the initial pH was 6, the substrate concentration was 12 g L−1, and the culture time was 40 h. The complex bacteria adopted the variable temperature and speed regulation hydrogen production operational mode; after the initial temperature of 37 °C for 8 hours, the temperature was gradually increased to 40 °C for 3 hours. The initial shaker speed was 90 rpm for 20 hours, and the speed was gradually increased to 130 rpm. The maximum hydrogen production rate obtained by the complex bacteria under these conditions was 12.6 mmol g−1, which was 1.6 times that of the single strain X9 with a maximum hydrogen production rate of 5.7 mmol g−1. Through continuous subculturing and the 10th, 20th, 40th, 60th, 80th, 100th and 120th generation fermentation hydrogen production stability test analysis, no significant difference was observed between generations; the maximum difference was not more than 5%, indicating better functional properties and stability.
1 Introduction
Fermenting bacteria and photosynthetic bacteria are microorganisms that are mainly used in the field of hydrogen production.1 It is generally believed that the efficiency of hydrogen production by fermenting bacteria is higher than that by photosynthetic bacteria. However, there are still great differences when pure cultures or mixed cultures are adopted. The fundamental reason is that it is not clear whether the synergy between the strains is conducive to hydrogen production during mixed culture.2,3 From the microbial ecological analysis, the synergistic effect of mixed strains is essentially a reciprocal symbiotic relationship between the bacteria, and it plays an important role in biodegradation. Feedback inhibition and population function have become an indisputable fact. However, regarding the synergistic effect of the complex microflora in the process of hydrogen production, due to the large difference between the experimental conditions and the hydrogen-producing bacteria, there is still no clear and unified explanation at research and abroad.4–7At present, research on microbial hydrogen production technology is generally based on the analysis of the hydrogen production efficiency of a single type of micro-flora. Samson isolated a facultative bacterial strain and used corn stem hydrolysate as the sole carbon source for hydrogen production of 0.91 mol H2/mol glucose.8 Li produced hydrogen by the simultaneous saccharification and fermentation of steam-exploded corn straw (SECS) using Clostridium butyricum AS1.209.9 Hydrogen production studies of the complex flora of the system are often only directed toward a part of the hydrogen production process. Noike and Mizuno10 intermittently produced hydrogen by using rice husk with 1.73 mol H2/mol hexose, 2.54 mol H2/mol hexose, and rice shell with 1.29 mol H2/mol hexose. Qiu11 conducted a batch test to study the effect of temperature on the hydrogen production of xylose using a mixed culture over a wide temperature range. The results showed that several microbial community structures were formed under different temperature conditions, resulting in different metabolic pathways for xylose and hydrogen production capacity.
Combined with the compounding principle of the complex flora, the single bacteria can be combined and cultured, which is beneficial to the formation of a complete enzyme system and enhance the ability of cellulose degradation and hydrogen production.12–14 This requires a large number of compound experiments to observe and screen the combination of high cellulose degradation activity and hydrogen production capacity.15,16
Three kinds of pure strains, namely ethanol-type fermentation hydrogen-producing bacteria (B2, B19, B49), butyric acid-fermenting hydrogen-producing bacteria (C3) and butyric acid-degrading cellulose hydrogen-producing bacteria (X9, X12), were selected for the hydrogen production test. The degradation hydrogen production rate of each formulation was used to evaluate and determine the best combination of hydrogen-producing bacteria for degrading maize straw. A group of high-efficiency maize straw degrading hydrogen-producing bacteria X9 + B2 was developed by optimizing the combination of strains. The hydrogen-producing ability of X9 + B2 was much greater than that of any single strain. The maximum hydrogen production rate of the complex strain was 12.6 mmol g−1, which was 6.9 mmol g−1 higher than the maximum value of the single strain X9, which was 5.7 mmol g−1. The maximum biomass of the complex bacteria was 0.88 g L−1, which was nearly twice that of the single strain X9. The maximum degradation rate of maize straw was 86% to 80% higher than that of the single strain X9.
After continuous subculturing for 10, 20, 40, 60, 80, 100 and 120 generations, the combination of strains could maintain the high hydrogen production capacity of the synergistic degradation of maize straw fermentation and showed high functional stability and property stability. There was no significant difference in the hydrogen production rate between generations, with the maximum difference being only 5%.
2 Methods and materials
2.1 Source and cultivation of strains
Three kinds of pure strains were isolated, screened and purified from molasses wastewater to flow through the hydrogen production reactor (CSTR), namely ethanol-type fermentation hydrogen-producing bacteria (B2, B19, B49), butyric acid-fermenting hydrogen-producing bacteria (C3), and butyric acid-degrading cellulose hydrogen-producing bacteria (X9, X12).The preparation and experimental operation of the three kinds of pure strain culture media were carried out by the improved Hungate anaerobic tube technique.17–19 High purity nitrogen was the gas phase and conventional culturing was carried out at 35 °C. The liquid medium was composed of glucose 10.0 mL, peptone 4.0 mL, yeast juice 1.0 mL, MgCl2 0.15 mL, FeSO4 0.15 mL, NaCl 1.0 mL, K2HPO4 1.5 mL, beef extract 2.0 mL, L-cysteine 0.5 mL, vitamin and trace element liquids 10 mL, resazurin 0.25 mL, distilled water 1000 mL and medium sterilized at 121 °C for 20 min.20,21
2.2 The source and pre-treatment of maize straw
Maize straw was obtained from a farm in Harbin, Shuangcheng province. Before pre-treatment, the maize straw was cut into 5 cm segments, then these segments were crushed into 50 mesh powders by a micro-plant pulverizer, and then pre-treated by acidification and steam explosion.Straw powder (1.5 g) was weighed and put into a 100 mL bottle, and 1% sulphuric acid solution (v/v) was added (1![[thin space (1/6-em)]](https://www.rsc.org/images/entities/char_2009.gif) :
:![[thin space (1/6-em)]](https://www.rsc.org/images/entities/char_2009.gif) 10) and mixed. The bottle was sealed and placed in a pressure cooker at 121 °C for 10 hours. After the steam explosion was completed, the temperature of the autoclave was lowered to 90 °C and the pressure was decreased. After removal, it was cooled to room temperature. The treated maize straw was washed with water to pH = 6.5–7.0 and then dried at 80 °C to constant weight to obtain the pre-treated maize straw.22–24
10) and mixed. The bottle was sealed and placed in a pressure cooker at 121 °C for 10 hours. After the steam explosion was completed, the temperature of the autoclave was lowered to 90 °C and the pressure was decreased. After removal, it was cooled to room temperature. The treated maize straw was washed with water to pH = 6.5–7.0 and then dried at 80 °C to constant weight to obtain the pre-treated maize straw.22–24
2.3 Reactor installation
The test used a modified Hungate technique in combination with a batch culture test. The device for the intermittent culture test is shown in Fig. 1.25,26 First, all the instruments were autoclaved to ensure a sterile environment for the reaction system. Then, high-purity nitrogen (99.9%) was blown into the culture flask for 10 minutes to evacuate the oxygen therein, and the colour of the anaerobic indicator resazurin (0.02%) was used to determine whether the reaction system was in an anaerobic state. The hydrogen-producing bacteria were inoculated into a culture flask containing a culture medium, sealed with a rubber stopper, and then sterilized for use. The culture flask was shaken and cultured in a constant temperature oscillator, and the gas production, pH value, and hydrogen content were measured periodically. When reading the amount of gas produced, the balance liquid level was equal to the liquid level of the gas meter to ensure the accuracy of the measured value.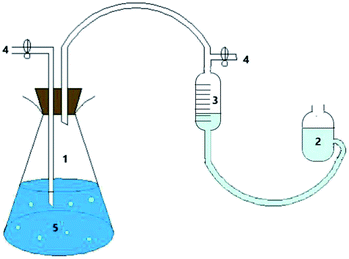 | ||
| Fig. 1 Batch culture test reactor: (1), culture bottle; (2), balance bottle; (3), gas meter; (4), sample outlet; (5), culture medium. | ||
2.4 Intermittent experiment
Three kinds of pure strains, namely ethanol-type fermenting hydrogen-producing bacteria (B2, B19, B49), butyric acid-fermenting hydrogen-producing bacteria (C3) and butyric acid-degrading cellulose hydrogen-producing bacteria (X9, X12) were used to construct a high-efficiency hydrogen-producing complex bacterial community for the simultaneous fermentation of maize straw.Through batch culture experiments, the effects of substrate concentration, pH, culture time and L-cysteine on the simultaneous and efficient hydrogen production of X9 and B2 were investigated, and the optimal conditions for hydrogen production by complex bacteria were selected.
The hydrogen production kinetics of the complex bacteria was analysed by measuring the hydrogen production rate, biomass, degradation rate and pH. After continuous subculturing and culturing of the 10th, 20th, 40th, 60th, 80th, 100th and 120th generations, the hydrogen production stability of the complex bacteria was analysed.
The hydrogen production capacity is expressed based on the hydrogen production rate (mmol g−1), and the calculation is as follows:
The degradation rate of maize straw was determined by the weight reduction method. The maize straw was accurately weighed before and after fermentation, and the quality loss was the amount of maize straw degraded by bacteria to produce hydrogen. The degradation rate of maize straw was characterized by the difference between the quality of maize straw before and after fermentation.
The volatile acids and alcohols in fermentation liquid end products were analysed by GC122 gas chromatography.
Hydrogen was determined by SCII gas chromatography.
3 Results and discussion
3.1 Optimization of hydrogen-producing complex bacteria in degraded maize straw
| Compounding scheme | Hydrogen production rate (mmol g−1) |
|---|---|
| X9 | 6.1 |
| X12 | 5.3 |
| X9 + X12 | 5.2 |
| X9 + C3 | 4.6 |
| X9 + B2 | 12.2 |
| X9 + B19 | 11.4 |
| X9 + B49 | 11.7 |
| X12 + C3 | 4.0 |
| X12 + B2 | 10.1 |
| X12 + B19 | 9.5 |
| X12 + B49 | 9.9 |
The results of the compound combination test showed that when X9 and B2 were mixed, maize straw (15 g L−1 100 mL) that was pre-treated with acidified steam explosion showed high hydrogen production ability, and the hydrogen production rate was up to 12.2 mmol g−1. This indicates that the combination of X9 and B2 was the best compounding scheme for degrading the hydrogen-producing complex of maize straw.
In this experiment, maize straw (15g L−1, 100 mL) was used as the substrate for fermenting hydrogen production, and the hydrogen production rate was taken as the index to investigate the effects of inoculation amount and proportion of X9 + B2 on its growth and hydrogen production capacity. Thus, the optimal inoculation amount and inoculation proportion of the composite bacteria were determined (Table 2).
| Order number | Strain inoculum (mL) | Hydrogen production rate (mmol g−1) | |
|---|---|---|---|
| X9 | B2 | ||
| 1 | 1 | 1 | 4.2 |
| 2 | 1 | 2 | 5.2 |
| 3 | 1 | 3 | 5.6 |
| 4 | 1 | 4 | 5.7 |
| 5 | 2 | 1 | 7.6 |
| 6 | 2 | 2 | 8.2 |
| 7 | 2 | 3 | 9.1 |
| 8 | 2 | 4 | 9.1 |
| 9 | 3 | 1 | 10.1 |
| 10 | 3 | 2 | 11.2 |
| 11 | 3 | 3 | 12.5 |
| 12 | 3 | 4 | 12.6 |
| 13 | 4 | 1 | 10.7 |
| 14 | 4 | 2 | 11.4 |
| 15 | 4 | 3 | 12.6 |
| 16 | 4 | 4 | 12.7 |
The results showed that when the inoculation amount of the complex bacteria was 6 mL (6%) and the inoculation ratio was 1![[thin space (1/6-em)]](https://www.rsc.org/images/entities/char_2009.gif) :
:![[thin space (1/6-em)]](https://www.rsc.org/images/entities/char_2009.gif) 1, the hydrogen production rate could reach 12.6 mmol g−1. Compared with the inoculation amount of 8 mL (8%) and the inoculation ratio of 1
1, the hydrogen production rate could reach 12.6 mmol g−1. Compared with the inoculation amount of 8 mL (8%) and the inoculation ratio of 1![[thin space (1/6-em)]](https://www.rsc.org/images/entities/char_2009.gif) :
:![[thin space (1/6-em)]](https://www.rsc.org/images/entities/char_2009.gif) 1, although the inoculum amount was reduced by 25%, the hydrogen production rate at this time was only decreased by 0.8%. When the inoculation amount was less than 6%, the growth of the strain was slow, the culture time was long, and the enzyme production activity and hydrogen production ability were not high. When the inoculation amount exceeded 6%, the inoculation amount did not significantly increase the hydrogen production capacity, so the enzyme activity, biomass and hydrogen production rate cannot be simply increased by increasing the inoculum amount.
1, although the inoculum amount was reduced by 25%, the hydrogen production rate at this time was only decreased by 0.8%. When the inoculation amount was less than 6%, the growth of the strain was slow, the culture time was long, and the enzyme production activity and hydrogen production ability were not high. When the inoculation amount exceeded 6%, the inoculation amount did not significantly increase the hydrogen production capacity, so the enzyme activity, biomass and hydrogen production rate cannot be simply increased by increasing the inoculum amount.
In addition, considering the cost of industrial application, when the inoculum of the strains X9 and B2 was 6 mL (6%) and the inoculation ratio was also 1![[thin space (1/6-em)]](https://www.rsc.org/images/entities/char_2009.gif) :
:![[thin space (1/6-em)]](https://www.rsc.org/images/entities/char_2009.gif) 1, the hydrogen production effect was achieved. In different compounding schemes, the hydrogen production capacity increased significantly with the increase of the inoculum of strain X9 in the complex bacteria, indicating that strain X9 was the “dominant strain”. However, the hydrogen production ability of strain B2 was not obvious with the increase in the inoculation amount in the complex bacteria group, which indicated that strain B2 was an “auxiliary strain”. At the same time, the complex bacteria mainly utilized the synergistic effect of cellulose enzymatic saccharification and enzymatic hydrolysis of the saccharification solution to produce hydrogen to achieve the high-efficiency degradation of maize straw fermentation for hydrogen production.27 In this sense, the strains X9 and B2 in the complex bacteria were “equally important”. The results also showed that when the inoculation ratio of the complex bacteria was 1
1, the hydrogen production effect was achieved. In different compounding schemes, the hydrogen production capacity increased significantly with the increase of the inoculum of strain X9 in the complex bacteria, indicating that strain X9 was the “dominant strain”. However, the hydrogen production ability of strain B2 was not obvious with the increase in the inoculation amount in the complex bacteria group, which indicated that strain B2 was an “auxiliary strain”. At the same time, the complex bacteria mainly utilized the synergistic effect of cellulose enzymatic saccharification and enzymatic hydrolysis of the saccharification solution to produce hydrogen to achieve the high-efficiency degradation of maize straw fermentation for hydrogen production.27 In this sense, the strains X9 and B2 in the complex bacteria were “equally important”. The results also showed that when the inoculation ratio of the complex bacteria was 1![[thin space (1/6-em)]](https://www.rsc.org/images/entities/char_2009.gif) :
:![[thin space (1/6-em)]](https://www.rsc.org/images/entities/char_2009.gif) 1, higher hydrogen production capacity could be obtained.
1, higher hydrogen production capacity could be obtained.
3.2 Influence of a single factor on the ability of complex bacteria
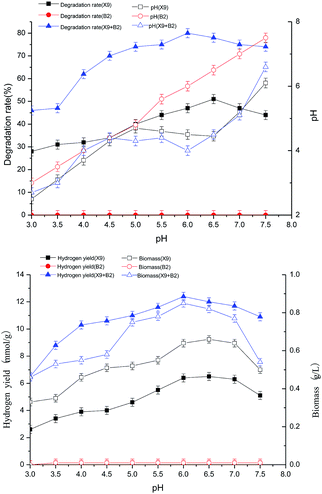
The results in Fig. 2 show that when the initial pH value was 6.5, the hydrogen production rate and biomass of strain X9 reached their respective maximum values of 5 mmol g−1 and 0.51 g L−1, respectively. For the single strain B2, the initial pH change had no effect on its hydrogen production rate and biomass. For the complex bacteria, the initial pH ranged from 3.0 to 6.0. With the initial pH increase, the hydrogen production rate and biomass of the complex strain were 90% and 27.5% higher than the maximum value of the single strain X9, respectively. It can be seen from the above figure that the initial pH range of the complex bacteria is much wider than that of the single strain X9. It also indicates that the complex bacteria played a synergistic role and had high efficiency in the processes of degrading maize straw by fermentation and hydrogen production.
The synergistic degradation of maize straw to produce hydrogen by fermentation with complex bacteria was best at the initial pH between 5.5 and 6.0. The ability of maize straw to degrade, saccharify and ferment hydrogen production was greatly improved. At an initial pH of 6.0, the degradation rate of maize straw reached a maximum of 80%, which was nearly 60% higher than the maximum value of single strain X9.
From the initial pH of the medium to the final pH effect curve of the fermentation hydrogen production reaction system, it can be seen that the complex bacteria can adapt to a wider pH range, showing the advantage of using complex bacteria in the synergistic degradation of maize straw for hydrogen production.
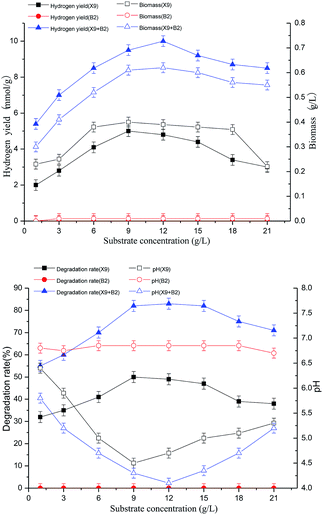
The results of the above figures show that the single strain X9 had a maximum hydrogen production rate and biomass of 5.0 mmol g−1 and 0.4 g L−1, respectively, at a substrate concentration of 9.0 g L−1. However, the change in substrate concentration of single strain B2 had no effect on its hydrogen production rate and biomass. For the complex bacteria, the substrate concentration was between 1.0 and 12.0 g L−1. With the gradually increasing substrate concentration, the hydrogen production rate of the complex bacteria and the degradation rate of the maize straw were greatly improved. When the substrate concentration was 12.0 g L−1, the complex bacteria group synergistically degraded the maize straw to produce better hydrogen, which was 100% and 59% higher than the maximum value of single strain X9. When the substrate concentration was between 12.0 and 21.0 g L−1, the hydrogen production rate and biomass showed a decreasing trend with the further increase of substrate concentration.
For the complex bacteria, as the substrate concentration increased, the degradation rate of maize straw increased. When the substrate concentration was 12 g L−1, along with the increase in the hydrogen production rate, the degradation rate of maize straw reached 83% at the maximum, which was 66% higher than the maximum value of single strain X9. This indicates that the synergistic degradation of the complex bacteria to produce hydrogen from maize straw fermentation had great advantages in both the loading rate of the fermentation substrate and the degradation rate of the substrate and the high efficiency of hydrogen production by fermentation.
The results show that the process of hydrogen production by fermenting maize straw was inhibited by the complex bacteria. When the substrate concentration was 12.0 g L−1, it was the best substrate load for the degradation of hydrogen by maize straw fermentation (Fig. 3).
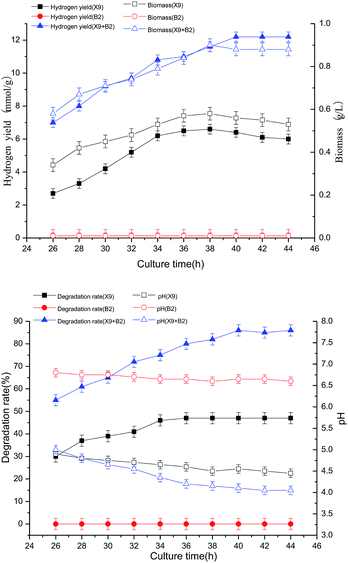
When the single strain X9 was cultured for 36 h, the hydrogen production rate and biomass reached their maximum values, which were 4.8 mmol g−1 and 0.42 g L−1, respectively. However, the change in culture time of single strain B2 had no effect on the hydrogen production rate and biomass. When the culture time reached 40 h, the hydrogen production rate and biomass reached their respective maximum values, which were 104% and 64% higher than the maximum value of the single strain X9, respectively. It can be seen from Fig. 4 that the optimal culture time of the complex bacteria was delayed by 4–6 hours as compared to the optimal culture time of the single strain X9. This indicates that the prolongation of hydrogen production by the complex bacteria improves the effectiveness of the degradation and utilization of maize straw, and is more conducive to the full play of the complex bacteria on the enzymatic saccharification and fermentative production of maize straw. It was also manifested that the complex bacteria were more effective than the single strain in utilizing the superiority of maize straw fermentation to produce hydrogen.
The best culture time for single strain X9 was 36 h, and the maximum maize straw degradation rate was 47%, then it gradually stabilized. B2 did not change the utilization of maize straw. For the complex bacteria, when the culture time was between 26 and 40 h, the degradation ability of maize straw was greatly improved by the increase of fermentation time. At 40 h of culture time, the degradation rate of maize straw reached a maximum of 86%. It was 45% higher than the maximum value of the single strain X9.
Therefore, determining a suitable culture time can not only fully exert the synergistic effect of the complex microbial community on the fermentation of maize straw to produce hydrogen, improving the utilization of maize straw and the ability to ferment hydrogen production, but can also effectively optimize the fermentation reaction time to provide operating parameters for the actual application.
3.3 Optimization of the hydrogen production capacity of complex bacteria by the response surface methodology
| Run | Substrate concentration (g L−1) | pH | Culture time (h) | Hydrogen yield (mmol g−1) | |||
|---|---|---|---|---|---|---|---|
| A | Code A | B | Code B | C | Code C | ||
| 1 | 12 | 0 | 6 | 0 | 40 | 0 | 12.6 |
| 2 | 14 | 1 | 5.5 | −1 | 40 | 0 | 12 |
| 3 | 12 | 0 | 6 | 0 | 40 | 0 | 12.6 |
| 4 | 10 | −1 | 5.5 | −1 | 40 | 0 | 12 |
| 5 | 10 | −1 | 6.5 | 1 | 40 | 0 | 12.3 |
| 6 | 14 | 1 | 6 | 0 | 42 | 1 | 12.4 |
| 7 | 10 | −1 | 6 | 0 | 42 | 1 | 12.3 |
| 8 | 12 | 0 | 5.5 | −1 | 42 | 1 | 12.1 |
| 9 | 12 | 0 | 6.5 | 1 | 42 | 1 | 12 |
| 10 | 12 | 0 | 6 | 0 | 40 | 0 | 12.6 |
| 11 | 14 | 1 | 6.5 | 1 | 40 | 0 | 11.8 |
| 12 | 12 | 0 | 6.5 | 1 | 38 | −1 | 11.7 |
| 13 | 12 | 0 | 6 | 0 | 40 | 0 | 12.6 |
| 14 | 12 | 0 | 5.5 | −1 | 38 | −1 | 12 |
| 15 | 12 | 0 | 6 | 0 | 40 | 0 | 12.6 |
| 16 | 14 | 1 | 6 | 0 | 38 | −1 | 12.3 |
| 17 | 10 | −1 | 6 | 0 | 38 | −1 | 12.2 |
| Y = −160.438 + 1.35225 × A + 22.843 × B + 4.79C − 0.1725 × AB + 4.375 × 10⁻³ × AC − 0.0175 × BC − 0.021188 × A2 − 1.799 × B2 − 0.061187 × C2 | (1) |
| Source | Sum of squares | Df | Mean square | F Value | Prob > F | |
|---|---|---|---|---|---|---|
| Model | 1.46 | 9 | 0.16 | 49.26 | <0.0001 | Significant |
| A-substrate concentration | 8.450 × 10⁻³ | 1 | 8.450 × 10⁻³ | 2.56 | 0.1538 | |
| B-pH | 0.026 | 1 | 0.026 | 8.00 | 0.0254 | |
| C-culture time | 0.088 | 1 | 0.088 | 26.69 | 0.0013 | |
| AB | 0.12 | 1 | 0.12 | 36.02 | 0.0005 | |
| AC | 1.225 × 10⁻³ | 1 | 1.225 × 10⁻³ | 0.37 | 0.5618 | |
| BC | 1.225 × 10⁻³ | 1 | 1.225 × 10⁻³ | 0.37 | 0.5618 | |
| A2 | 0.030 | 1 | 0.030 | 9.15 | 0.0192 | |
| B2 | 0.85 | 1 | 0.85 | 257.75 | <0.0001 | |
| C2 | 0.25 | 1 | 0.25 | 76.33 | <0.0001 | |
| Residual | 0.023 | 7 | 3.304 × 10⁻³ | |||
| Lack of fit | 0.019 | 3 | 6.350 × 10⁻³ | 6.23 | 0.0548 | Not significant |
| Pure error | 4080 × 10−3 | 4 | 1.020 × 10⁻³ | |||
| Cor total | 1.49 | 16 |
| Factor | Coefficient estimate | Df | Standard error | 95% CI | VIF | |
|---|---|---|---|---|---|---|
| Low | High | |||||
| Intercept | 12.61 | 1 | 0.026 | 12.55 | 12.67 | 1.00 |
| A-substrate concentration | −0.032 | 1 | 0.020 | −0.081 | 0.016 | 1.00 |
| B-pH | −0.058 | 1 | 0.020 | −0.11 | −9.443 × 10⁻³ | 1.00 |
| C-culture time | 0.11 | 1 | 0.020 | 0.057 | 0.15 | 1.00 |
| AB | −0.17 | 1 | 0.029 | −0.24 | −0.10 | 1.00 |
| AC | 0.018 | 1 | 0.029 | −0.050 | 0.085 | 1.00 |
| BC | 0.018 | 1 | 0.029 | −0.050 | 0.085 | 1.00 |
| A2 | −0.085 | 1 | 0.028 | −0.15 | −0.019 | 1.01 |
| B2 | −0.45 | 1 | 0.028 | −0.52 | −0.38 | 1.01 |
| C2 | −0.24 | 1 | 0.028 | −0.31 | −0.18 | 1.01 |
The regression coefficient of the above-mentioned quadratic regression full model equation is R2 = 0.9890. It can be seen from the variance analysis results of the regression model of Table 4 that the established model can reflect the experimental data well, and the regression equation has a good fitting degree and small experimental error. At the significance level of p < 0.05, based on the analysis of the regression equation, the initial pH and culture time of the primary hydrogen production regression model were high, the secondary items A2, B2, and C2 all showed significant results and the interaction item is only AB significant.
In the coefficient test of the regression equation, the 95% confidence interval (CI) indicates that the coefficient average is more reliable; the variance expansion coefficient (VIF) is much smaller than the general requirement of 10, indicating that the collinearity between the regression coefficients is small. The missing term of the model is p = 0.0548 > 0.05, indicating that the loss is not significant, that is, the model is stable, which can better predict the change in the hydrogen production rate of the actual complex bacteria degradation of maize straw. Therefore, this model can be used to analyze and predict the hydrogen production rate.
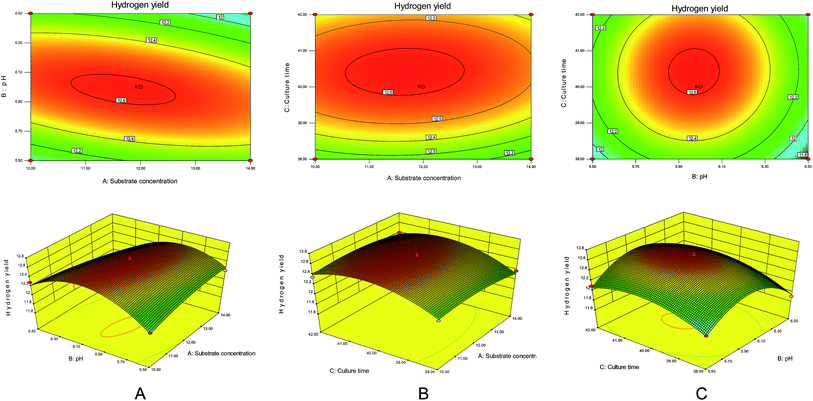
It can be seen from Fig. 5A that the substrate concentration and the initial pH had significant effects on hydrogen production by the degradation of maize straw by complex bacteria. When the substrate concentration was raised from 10 g L−1 to 12 g L−1 and the initial pH was increased from 5.5 to 6.0, the hydrogen production rate increased sharply. However, on further increasing the substrate concentration and initial pH, the hydrogen production rate decreased.
The effect of culture time on the hydrogen production of the complex bacteria to degrade maize straw can be seen from Fig. 5B. When the substrate concentration and culture time were increased from 10 g L−1 and 38 h to 12 g L−1 and 40 h, respectively, the hydrogen production rate reached the maximum value. After the substrate concentration and culture time continued to increase, the hydrogen production decreased.
It can be seen from Fig. 5C that as the initial pH and the incubation time increased to the optimum value of initial pH 6.0 and the incubation time was 40 h, the hydrogen production amount gradually increased to the highest value of 12.6 mmol g−1. The initial pH and incubation time continued to increase, and the amount of hydrogen produced showed a decreasing trend.
3.4 Synergistic hydrogen production by degradation of maize straw
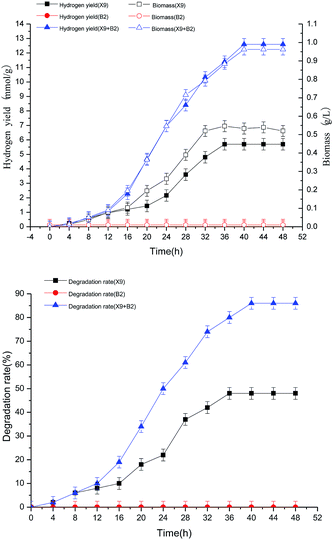
It can be seen from Fig. 6 that both single strain X9 and the complex bacteria can ferment maize straw and produce hydrogen, and the hydrogen production rate, maize straw degradation rate and biomass change all have similar trends with the fermentation hydrogen production time. However, the hydrogen production capacity of the complex bacteria was significantly higher than that of the single strain X9, and the maximum hydrogen production rate of the complex bacteria was 12.6 mmol g−1, which was 6.9 mmol g−1 higher than the maximum value of the single strain X9. At this time, the maximum biomass of the complex bacteria reached 0.88 g L−1, which was nearly twice that of the single strain X9, and the maximum 86% of the maize straw degradation rate was also increased by nearly 80%, corresponding to the maximum value of the single strain X9. These explanations showed that the synergistic hydrogen production of the complex bacteria was significantly superior to the single strain when fermenting maize straw to produce hydrogen. Because strain B2 cannot directly ferment the maize straw to produce hydrogen, there was basically no change in the indicators in the figure. The fermentation hydrogen production time (40 h) for the complex bacteria was 5 hours longer than that of the single strain X9 (35 h), which was beneficial to increase the degree of degradation of maize straw and promote hydrogen production.
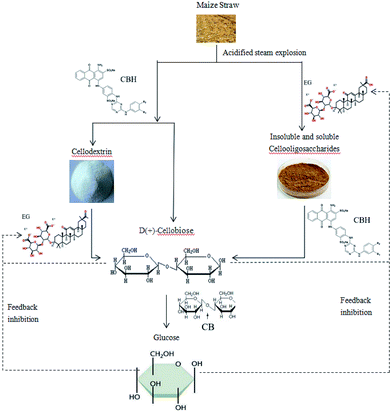
Cellulases include endoglucanases, exoglucanases, and beta-glucosidases.28 Based on existing research and related data, it is hypothesized that endoglucanase and exoglucanase act simultaneously on insoluble cellulose, which is random in sequence. After the glucanase degrades the maize straw to produce cellobiose, the cellobiose is further hydrolyzed into 2 molecules of glucose by 20-glucosidase.29–32 Hydrogen is then produced by the action of related hydrogenase, NADH-iron oxidoreductase and dehydrogenase. Current studies have shown that cellobiose, the main product of cellulase hydrolysis of cellulose, has a significant inhibitory effect on the activity of endoglucanase and exo-cellobiohydrolase. The main rate-limiting step in the hydrolysis of cellulose by cellulase is the hydrolysis of cellobiose to glucose.33,34
The synergistic metabolism of B2 in the complex bacteria utilizes some cellobiose as a nutrient substrate for hydrogen production, which reduces the content of cellobiose in the system to some extent, and alleviates the feedback inhibition of cellulolytic enzymes by cellobiose. In this way, on the one hand, the further enzymatic saccharification of cellulose is promoted; on the other hand, the ability of the fermentation period is also improved, which is advantageous for obtaining a higher hydrogen yield. In addition, enhancing β-glucosidase activity is another effective measure to increase the rate of cellulase hydrolysis and hydrogen production.
Furthermore, studies have shown that the accumulation of glucose inhibits the activity of β-glucosidase and acts as a repressor in cellulase synthesis, which in turn leads to the accumulation of cellobiose and more glucose. At the same time, it will inhibit other cellulases and cause a vicious cycle.
In addition, some studies have shown that the accumulation of glucose inhibits the activity of β-glucosidase and acts as a repressor in cellulase synthesis,35 which in turn leads to the accumulation of cellobiose and more glucose. At the same time, it will inhibit other cellulases and cause a vicious cycle. The repression of glucose by cellulase is produced by the regulation of a repressor protein interacting with a specific nucleotide motif sequence upstream of the target gene promoter. The complex bacteria that we use to synergistically degrade the fermentation of cellulose to produce hydrogen are based on this starting point. B2 in the complex bacteria can fully degrade the glucose produced by X9 enzymatic hydrolysis to produce hydrogen, which can effectively relieve the feedback inhibition of the enzyme by the glucose product and improve the hydrogen production capacity of the complex bacteria.
3.5 Analysis of the hydrogen production stability of complex bacteria
For any microorganism degrading maize straw to produce hydrogen, the ability to degrade maize straw to consistently produce hydrogen is the most basic prerequisite for its application. After long-term testing and continuous subculturing of the complex bacteria, it was found that the ability to degrade maize straw for the production of hydrogen always maintained good functional stability.In this experiment, the complex bacteria of the 10th, 20th, 40th, 60th, 80th, 100th and 120th generations of continuous subculture and cryopreservation were activated as the seed and cultured under optimal culture conditions for 48 hours. Through intermittent testing, the hydrogen production rate, biomass, maize straw degradation rate and pH were used to investigate the functional stability and stability of the complex bacteria, which provided the basis for the experimental bio-hydrogen production using maize straw.
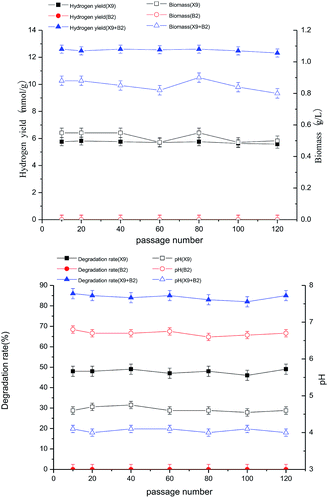
After successive subculturing and the 10th, 20th, 40th, 60th, 80th, 100th and 120th generations, the biological activities of the complex bacteria of each generation were kept at a high level, the cell proliferation was rapid, the metabolic enzyme production was strong, and the enzyme activity was high. The hydrogen production rate and biomass change trend were stable, there was no significant difference between generations, and both had high bio-capacity while maintaining high hydrogen production rates (see figure below). The maximum hydrogen production rate and biomass were basically stable at the levels of 13.26 mmol g−1 and 0.97 g L−1. This indicates that the complex bacteria of each generation maintained a high ability to degrade the fermentation of maize straw to produce hydrogen, and had good functional stability (Fig. 7).
It can be seen from Fig. 8 that the degradation rate of maize straw by different generations of complex bacteria was the same as that for hydrogen production and biomass. There was no significant difference between the generations, with the greatest difference being only 5%, and both of them maintained a high maize straw degradation rate, with the maximum maize straw degradation rate being basically stable at about 85%. This reflected the relatively stable nature of the complex bacteria, which also showed stability between different generations. The stability of the function and properties of the single strain largely determined the stability of hydrogen production and efficiency of hydrogen production.
The changes in the final pH of different generations of complex bacteria systems were basically the same; the biggest difference was less than 0.1, and it was basically stable at 4.1. The change in pH was mainly caused by the degradation of the organic acid that was produced by the fermentation process of maize straw. It could be seen that there was a close positive correlation between the pH change for the complex bacteria and the hydrogen production by degradation of maize straw. Comparison of the changes in the final pH of different generations of complex bacteria systems indicated that there was good stability.
After successive subcultures and their 10th, 20th, 40th, 60th, 80th, 100th and 120th generations, the complex bacteria constructed by X9 and B2 could still maintain a high capacity of synergistic degradation of maize straw for hydrogen production, showing high biological activity and stability. This was closely related to the separation from the same ecological environment. The complex bacteria, to some extent, enhanced the natural biological hydrogen production process in artificially reproduced laboratory conditions. Therefore, the complex microbial community, which causes stable and efficient hydrogen production by the degradation of maize straw through fermentation, provides an experimental basis and data for the future industrialization of more complex natural lignocellulose.
4 Conclusions
1. In this paper, three kinds of pure strains isolated from CSTR were used: ethanol-type fermentation hydrogen-producing bacteria (B2, B19, B49), butyric acid-type fermentation hydrogen-producing bacteria (C3) and butyric acid-degrading cellulose hydrogen-producing bacteria (X9, X12) as test bacteria materials. A group of high-efficiency, hydrogen-producing complex bacteria X9 + B2 that degraded maize straw was developed by a strain combination optimization experiment. The hydrogen production capacity was much greater than that of any single strain of fermented maize straw.2. After successfully constructing a group of high-efficiency, maize straw degrading, hydrogen-producing complex bacteria X9 + B2, the three factors of initial pH, substrate concentration and culture time of maize straw production were tested by a single factor. The suitable conditions for the degradation of maize straw by the complex bacteria were an initial pH of 6, substrate concentration of 12 g L−1, and culture time of 40 h.
3. Through the optimization of the model, the theoretical conditions for the hydrogen production of the complex bacteria to obtain maize straw were obtained. The substrate concentration was 11.73 g L−1, the initial pH was 5.98, and the culture time was 40.42 h. Based on the industrial production situation, the optimal solution was the substrate concentration of 12 g L−1, the initial pH of 6 and the incubation time of 40 h. Under these conditions, the measured hydrogen production rate was 99.8% of the predicted value. The experimental values were consistent with the model optimization simulation values, and the higher hydrogen production was obtained, which indicated that the model has a certain guiding significance.
4. A quadratic polynomial mathematical model for the hydrogen production rate of maize straw degraded by complex bacteria was established. The model showed that the effects of various factors on the hydrogen production rate were in the order of initial pH > substrate concentration > culture time.
5. Compared with single bacteria fermentation and hydrogen production, and compared with glucose as the substrate,8,9 the hydrogen production rate of the optimized composite bacteria can reach hydrogen production efficiency of 1.5–2 times greater. Moreover, the maize straw pretreated by acidification steam explosion as a substrate provides a possibility for the large-scale realization of hydrogen production from agricultural waste and has good development prospects.
Conflicts of interest
There are no conflicts to declare.Acknowledgements
This study was supported by the State Key Laboratory Fund for Urban Water Environment and Water Resources (HC201814); the State Key Program of National Natural Science of China (71731007); and the Liaoning Provincial “Innovative Talents in Colleges and Universities” Support Project (LR2016055).References
- M. A. Tao, M. Chen, C. Wang, Z. Mao and M. Jiang, Int. J. Hydrogen Energy, 2013, 38, 13062–13068 CrossRef
.
- K. Olaf, R. Jens, J. H. Mussgnug, D. G. Charles and H. Ben, Photochem. Photobiol. Sci., 2005, 4, 957–970 RSC
.
- S. Kim, J. Chung and J.-O. Kim, Biodegradation, 2013, 24, 753–764 CrossRef CAS PubMed
.
- J. Wang and Y. Yin, Int. J. Hydrogen Energy, 2017, 42, 4804–4823 CrossRef CAS
.
- P. Intanoo, P. Chaimongkol and S. Chavadej, Int. J. Hydrogen Energy, 2016, 41, 6107–6114 CrossRef CAS
.
- T. Chookaew, S. Othong and P. Prasertsan, Int. J. Hydrogen Energy, 2012, 37, 13314–13322 CrossRef CAS
.
- J. Wang and W. Wei, Int. J. Hydrogen Energy, 2008, 33, 2934–2941 CrossRef CAS
.
- S. K. Samson and T. R. Manikkandan, Iran. J. Chem. Chem. Eng., 2017, 36, 173–181 Search PubMed
.
- D. Li and H. Chen, Int. J. Hydrogen Energy, 2007, 32, 1742–1748 CrossRef CAS
.
- M. Kotani, T. Koike, K. Yamaguchi and N. Mizuno, J. Cheminf., 2006, 8, 735–741 CAS
.
- C. Qiu, Y. Ping, L. Sun, S. Wang, S. Lo and D. Zhang, J. Chem. Technol. Biotechnol., 2017, 92(8), 1990–1997 CrossRef CAS
.
- Y. F. Li, Y. T. Duan, F. J. Liu, L. Wang and Y. X. Wang, Adv. Mater. Res., 2011, 183–185, 31–34 CAS
.
- H. H. Cheng, L. M. Whang, M. C. Chung and K. C. Chan, Bioresour. Technol., 2016, 210, 49–55 CrossRef CAS PubMed
.
- A. Ghimire, E. Trably, L. Frunzo, F. Pirozzi, P. N. L. Lens, G. Esposito, E. A. Cazier and R. Escudié, Bioresour. Technol., 2017, 248, 180–186 CrossRef PubMed
.
- L. I. Qiu bo, D. F. Xing, N. Q. Ren, L. H. Zhao and Y. Y. Song, Environ. Sci., 2006, 27, 810 Search PubMed
.
- A. Adessi, M. Concato, A. Sanchini, F. Rossi and R. D. Philippis, Appl. Microbiol. Biotechnol., 2016, 100, 2917–2926 CrossRef CAS PubMed
.
- J. Slots, J. Dent. Res., 2010, 83, 274–278 Search PubMed
.
- B. Liu, Y. Jin, G. Xie, Z. Wang, H. Wen, N. Ren and D. Xing, ES Energy & Environment, 2018, 1, 56–66 Search PubMed
.
- E. Gutiérrez-Arnillas, M. Arellano, F. J. Deive, A. Rodríguez and M. Á. Sanromán, Bioresour. Technol., 2017, 239, 368 CrossRef PubMed
.
- S. Jiaxiu, A. Dong, R. Nanqi, Z. Yongming and C. Ying, Bioresour. Technol., 2011, 102, 10875–10880 CrossRef PubMed
.
- B. Saha, Int. Biodeterior. Biodegrad., 2016, 109, 29–35 CrossRef CAS
.
- B. C. Saha, N. Qureshi, G. J. Kennedy and M. A. Cotta, Int. Biodeterior. Biodegrad., 2016, 109, 29–35 CrossRef CAS
.
- E. Hong, J. Kim, S. Rhie, S. J. Ha, J. Kim and Y. Ryu, Biotechnol. Bioprocess Eng., 2016, 21, 612–619 CrossRef CAS
.
- N. Q. Ren, H. Chua, S. Y. Chan, Y. F. Tsang, Y. J. Wang and N. Sin, Bioresour. Technol., 2007, 98, 1774–1780 CrossRef CAS PubMed
.
- S. K. Khanal, W. H. Chen, L. Li and S. Sung, Water Environ. Res., 2006, 78, 110–117 CrossRef CAS PubMed
.
- C. Badal, B. L. Iten, A. M. Cotta and Y. Victor WU, J. Biobased Mater. Bioenergy, 2005, 40, 3693–3700 Search PubMed
.
- G. P. Philippidis, T. K. Smith and C. E. Wyman, Biotechnol. Bioeng., 2010, 41, 846–853 CrossRef PubMed
.
- A. Sharma, R. Tewari, S. S. Rana, R. Soni and S. K. Soni, Appl. Biochem. Biotechnol., 2016, 179, 1346–1380 CrossRef CAS PubMed
.
- S. Y. Han, K. H. Han, Y. H. Jee, Y. S. Kang, H. K. Kim, J. Y. Han, Y. S. Kim and D. R. Cha, Nephrol., Dial., Transplant., 2006, 21, 2406–2416 CrossRef CAS PubMed
.
- M. A. Rachman, Y. Furutani, Y. Nakashimada, T. Kakizono and N. Nishio, J. Ferment. Bioeng., 1997, 83, 358–363 CrossRef CAS
.
- C. M. Pan, H. C. Ma, Y. T. Fan and H. W. Hou, Int. J. Hydrogen Energy, 2011, 36, 4852–4862 CrossRef CAS
.
- A. Meinke, H. G. Damude, P. Tomme, E. Kwan, D. G. Kilburn, R. C. Miller, R. A. Warren and N. R. Gilkes, J. Biol. Chem., 1995, 270, 4383–4386 CrossRef CAS PubMed
.
- P. F. Sims, M. S. Soares-Felipe, Q. Wang, M. E. Gent, C. Tempelaars and P. Broda, Mol. Microbiol., 2010, 12, 209–216 CrossRef
.
- A. J. Day, M. S. Dupont, S. Ridley, M. Rhodes, M. J. C. Rhodes, M. R. A. Morgan and G. Williamson, FEBS Lett., 1998, 436, 71–75 CrossRef CAS PubMed
.
- A. Berlin, M. Balakshin, N. Gilkes, J. Kadla, V. Maximenko, S. Kubo and J. Saddler, J. Biotechnol., 2006, 125, 198–209 CrossRef CAS PubMed
.
| This journal is © The Royal Society of Chemistry 2019 |


