 Open Access Article
In situ polymerization and FT-IR characterization of poly-glycine on pencil graphite electrode for sensitive determination of anti-emetic drug, granisetron in injections and human plasma†
Marwa F. B. Ali‡
and
Fatma A. M. Abdel-aal‡ *
*
Department of Pharmaceutical Analytical Chemistry, Faculty of Pharmacy, Assiut University, 71526 Assiut, Egypt. E-mail: famo207@yahoo.com; fatmamoustafa@aun.edu.eg; Fax: +20-88-2080774
First published on 4th February 2019
Abstract
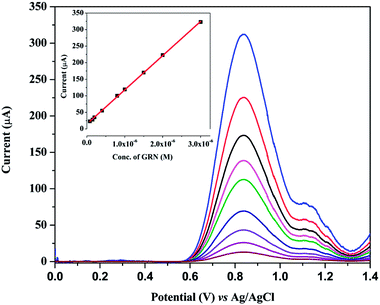
In situ polymerization is a simple and efficient technique for modification and fabrication of modified electrodes in voltammetry. An efficient and highly sensitive square wave voltammetric (SWV) method was developed for analysis of a 5-HT3 antagonist granisetron (GRN) using in situ polymerized glycine on pencil graphite electrode surface. It was found that the fabricated polymer enhanced the sensitivity by more than two times and enhanced the surface activity by more than three times. Surface area measurements showed that poly-Gly/PGE have large surface area of 44.3 mm2, when compared to that of bare PEG (12.1 mm2). Several methods as cyclic voltammetry (CV), electrochemical impedance spectroscopy (EIS) and scanning electron microscopy (SEM) techniques were used to characterize the modified surface. Further, FT-IR spectroscopic study was used to predict the way of glycine polymerization on electrode surface and the possible interaction mechanism with GRN. After optimization, the proposed method showed a linear response of GRN concentrations in the range from 0.08 to 3.00 μmol L−1 with a limit of detection (LOD) of 26.2 nmol L−1 (9.14 ng mL−1). The method was utilized for GRN determination in ampoules and in real human plasma samples.
1. Introduction
Electro-polymerization is an innovative approach to fabricate polymer film modified electrodes (PMEs), this process takes place in situ for immobilization of organic molecules to form highly sensitive conducting polymer over electrode surface. PMEs have attracted much attention due to their high stability, selectivity, sensitivity, reproducibility, good homogeneity and strong adherence to electrode surface.1–3 In the last two decades the use of poly(amino acid) for electrode modification was applied in the electroanalysis field, especially poly-glycine (poly-Gly), that have been used for determination of many pharmaceutical compounds.4–11 Although poly-Gly polymer was used for modification of carbon electrodes previously, but the utility of poly-Gly as a conducting polymer at surface of graphite electrode was not reported before. In addition, the proposed method investigated the mechanism of glycine polymerization and the structure of the formed polymer over electrode surface using FT-IR technique.Granisetron (GRN), is a 5-HT3 antagonists used in treatment of nausea and vomiting especially that caused by cancer chemotherapy.12 Serotonin (5-HT) receptors are distributed throughout the mucosal enterochromaffin cells in the gut and the central nervous system.13 Serotonin is released by the enterochromaffin cells in response to chemotherapeutic agents that may stimulate vagal afferents (via 5-HT3 receptors) to initiate the vomiting reflex. GRN suppresses vomiting and nausea by inhibiting serotonin binding to 5-HT3 receptors.
Various analytical methods were reported for quantitative determination of GRN in bulk, different pharmaceutical and biological samples, as spectrophotometric,14,15 spectrofluorimetric,16 HPTLC,17,18 and HPLC19–22 methods. Electrochemical techniques are widely used nowadays for their high sensitivity, selectivity, cost effective and high sample throughput within short analysis time. From literature survey, there is only two electroanalytical methods were reported for determination of GRN.23,24 The 1st one23 used hanging mercury drop electrode (HMDE) which suffer from several drawbacks such as toxicity of mercury, surface area of a drop of mercury is never constant, applied voltage produces changes in surface tension and hence change in drop size with limitation for analysis of more positive potential range. The 2nd one24 utilized platinum nanoparticles modified glassy carbon electrode (GCE). Although the reported sensor showed higher sensitivity,24 but the authors have not provided a justification about the number of electrons involved in the suggested oxidation mechanism of GRN. The authors suggested that the oxidation of GRN is attributed to the loss of two electrons in two steps in acidic medium (pH 2.0) while there is only one peak developed as shown in their results. In addition, the reported method24 was not applied in biological fluids and the authors didn't prove its liability for determination of GRN in human plasma.
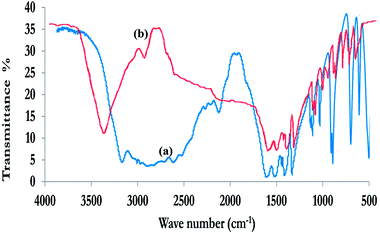
The several advantages of pencil graphite electrode (PEG) over other carbon electrodes, such as the low cost, availability, low background current, wide potential window and ease of modification, made it favorable for many workers for analysis of different compounds in pharmaceutical and biological samples.25–27 Therefore, this work aimed to fabricate poly-Gly modified graphite electrode for the 1st time for determination of GRN at nanoscale level in pharmaceutical formulations and in real human plasma. Full characterization study of the formed poly-Gly polymer was performed using scanning electron microscopy (SEM), electrochemical impedance spectroscopy (EIS), cyclic voltammetric (CV) and square wave voltammetric (SWV) techniques. Furthermore, FT-IR spectroscopic study was carried out to investigate the mechanism of glycine polymerization on graphite electrode surface and its chemical reaction with the studied drug GRN.
2. Experimental
Materials, chemicals, apparatus and all preparation procedures used during the whole study are mentioned in the ESI.† Full fabrication process of poly-Gly/PGE electrode is shown in Fig. 1.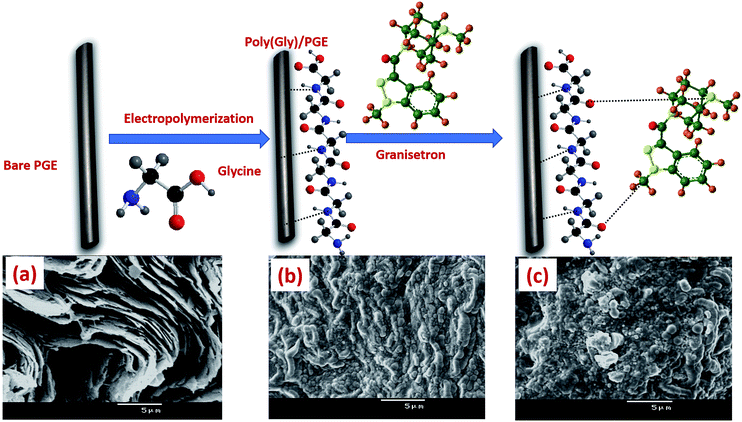 | ||
| Fig. 1 Preparation process of poly-Gly/PGE with SEM images of (a) bare PGE, (b) poly-Gly/PGE and (c) poly-Gly/PGE with an adsorbed layer of GRN. | ||
3. Results and discussion
3.1. Preliminary investigations of GRN on different carbon electrodes
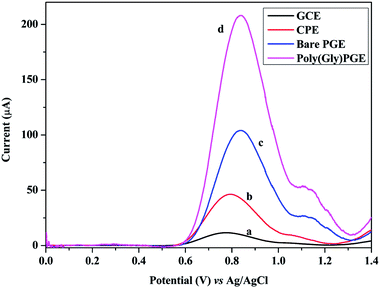
SWV technique was utilized to investigate the electrochemical behavior of GRN at various carbon electrodes such as glassy carbon electrode (GCE) and carbon paste electrode (CPE). Fig. 2 showed the SW voltammograms of 1.0 × 10⁻⁵ M GRN in 0.04 M of BR (pH 7.0) at GCE (curve a), CPE (curve b), PGE bare (curve c). GRN has a broad weak peak at GCE at 0.77 V and a slightly higher peak at CPE at 0.8 V, while a sharp and high peak was produced at PGE bare at 0.85 V. From the results shown in Fig. 2, PGE was selected for subsequent measurements.The next step was the electro-polymerization of glycine on the surface of PGE after its activation in 0.2 M phosphate buffer at pH 7.0. After modification of the PGE surface with poly-Gly polymer, the anodic current of GRN significantly increased to the double and becomes sharper when compared to that of the bare PGE electrode. These results indicated that poly-Gly polymer can enhance the rate of electron transfer for GRN oxidation and act as a promoter. The in situ formed poly-Gly layer had an excellent catalytic activity on the electrochemical oxidation of GRN on PGE electrode as shown in Fig. 2 (curve d).
3.2. Electro-polymerization parameters of glycine on PGE
Various polymerization conditions such as potential range, number of scan cycles, conc. of glycine and pH of the medium which may affect the catalytic oxidation of GRN were investigated. A solution of 1.0 × 10⁻⁵ M GRN in 0.04 M BR at pH 7.0 was used to evaluate the catalytic results throughout the experiments.Polymerization of glycine on PGE surface is achieved via CV technique. A wide potential range for polymerization of glycine was set from negative value −0.5 V to 2.0 V as reported before.28 Number of cyclic scans of the electrode in glycine solution was also optimized as it is one of the significant factors that affect the electrocatalytic activity of the formed polymer. As indicated in Fig. 3a, increasing the no. of scanning cycles increases the thickness of the deposited polymer layers and consequently an enhancement in the oxidation peak current of GRN was observed. The peak current increases by increasing the number of scans until 7 cycles, however higher number of scans more than 7 cycles showed a decrease in peak current value. This can be attributed to the amount of the modifier attached to the surface of the electrode that reached a saturation point after 7 cycles.
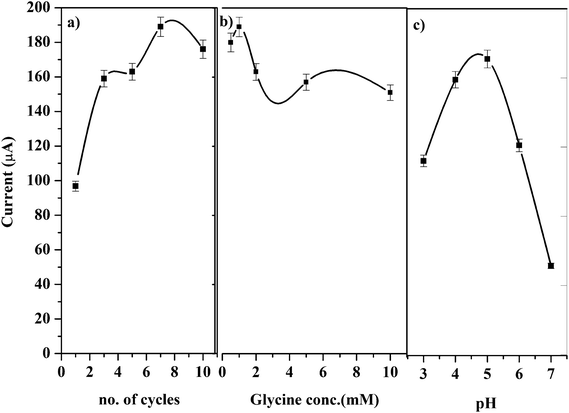 | ||
| Fig. 3 Effects of (a) scanning cycle, (b) concentration of glycine, and (c) pH of the medium on the peak current of 1.0 × 10⁻⁵ M GRN solution. | ||
The concentration of glycine monomer also affects the catalytic activity of the electrode. As shown in Fig. 3b, by increasing the concentration of glycine the oxidation current is significantly increased. However, if the concentration of glycine was higher than 1.0 mM, the resultant film blocks the surface of the electrode and the sensitivity of the poly-Gly/PGE electrode was decreased.
Different pH values of phosphate buffer were tested from pH 3.0 to 7.0 for electro-polymerization of glycine as indicated in Fig. 3c. Glycine has different forms (acidic, basic or zwitterion), hence the electrolyte pH has a great influence on the polymerization process.29
Glycine has 2 pKa values (2.2 and 9.6) and it was found that the best pH for its polymerization is the pH 5.0. This pH is near its isoelectric point and considered the optimum for formation of poly-Gly polymer at the surface of the electrode. Above pH 5.0 the peak of GRN is distorted and disappeared. Hence, phosphate buffer at pH 5.0 was chosen for polymerization of glycine on electrode surface throughout the SWV measurements.
3.3. Characterization of poly-Gly modified PGE
3.4. Electrochemical activity of the modified poly-Gly/PGE
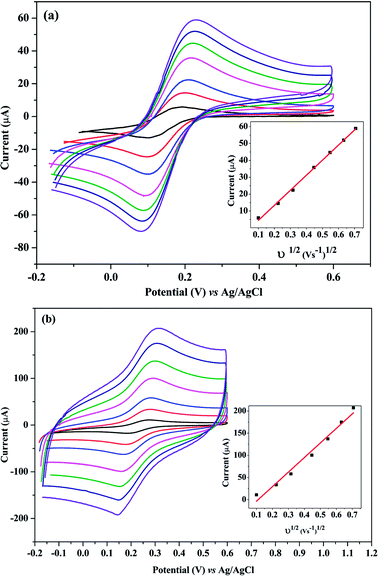
The effective electrode area was examined by the CV method using 5.0 mM K3Fe(CN)6 as a standard at various scan rates.Randles–Sevcik equation was used32 for a reversible process as following:
| IP = (2.69 × 10⁵)An3/2DR1/2C0ν1/2 |
From the slope of the plot of IP vs. ν1/2 at different scan rates (0.01 to 0.4 V s−1) as shown in Fig. 5(a and b), the surface areas of the bare and poly-Gly/PGE were calculated to be 12.1 and 44.3 mm2, respectively. These results indicated that after PGE surface modification by Gly-polymerization, the effective surface area was increased by more than three times. This improvement is reflected by the increment in peak current of 1.0 mM K3Fe(CN)6 on poly-Gly/PGE (Fig. 5b) when compared with bare PGE (Fig. 5a). This confirms the change in surface property of the modified electrode. Hence, the fabricated poly-Gly/PGE has stable and sensitive electrochemical behavior.
3.5. Electrochemical impedance spectroscopy (EIS)
EIS was examined to calculate the interfacial properties of the electrode and solution. Charge transfer resistance (Rct) is an important character of electron transfer across the electrode interface. EIS of bare PGE and poly-Gly/PGE in 1.0 mM K3[Fe(CN)6] in 0.5 M KCl were examined at the open circuit potential over the frequency range of 1 Hz to 100 kHz. The data were fitted according to the Rundles equation, and the resulting Nyquist plots are shown in Fig. 6. The Nyquist plot of bare PGE shows a semi-circular model, whereas that of poly-Gly/PGE shows linear curve. The charge transfer resistance values (Rct) were calculated by z-view software and found to be 108.3 and 18.47 for bare PGE and poly-Gly/PGE, respectively. This result indicates that the poly-Gly polymer coating on PGE surface enhanced electron transfer across the electrode–solution interface.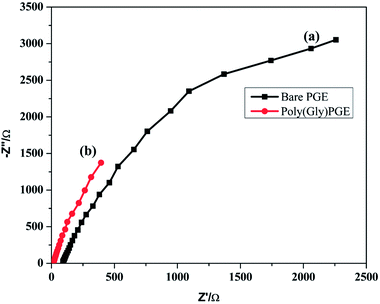 | ||
| Fig. 6 Nyquist plot of ESI of (a) bare PGE and (b) poly-Gly/PGE using 0.5 M KCl containing 1.0 mM K3[Fe(CN)6] at scan rate 0.1 V s−1. | ||
3.6. Effect of scan rate
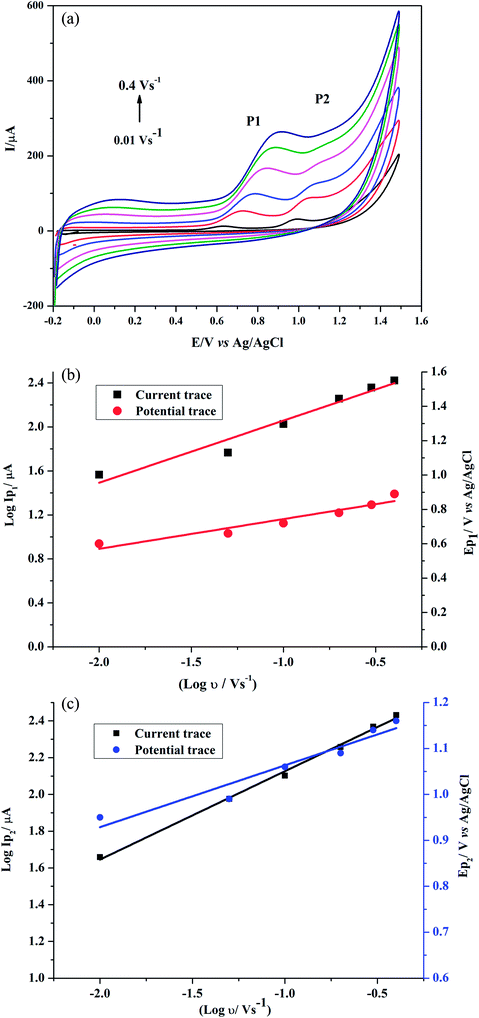
Effect of scan rate on GRN oxidation was studied at the poly-Gly/PGE by CV. The cyclic voltammograms for 1.0 × 10⁻⁵ M GRN in 0.04 M BR (pH 7.0) at the poly-Gly/PGE at various scan rates from 0.01 to 0.4 V s−1 were recorded (Fig. 7a). In order to know whether the reaction on the surface of the proposed electrode was under diffusion or adsorption control, scan rate studies were carried out. The relationship between the oxidation peak current (IP1 or IP2) and the scan rate (ν) showed a linear response. Further, the relationship between logarithm scan rate (log![[thin space (1/6-em)]](https://www.rsc.org/images/entities/char_2009.gif) ν) on the logarithm peak current (log
ν) on the logarithm peak current (log![[thin space (1/6-em)]](https://www.rsc.org/images/entities/char_2009.gif) IP) was also investigated (Fig. 7b and c), giving a straight line with a slope of 0.5653 and 0.4805 for 1st and 2nd peak, respectively, according to the following equations:
IP) was also investigated (Fig. 7b and c), giving a straight line with a slope of 0.5653 and 0.4805 for 1st and 2nd peak, respectively, according to the following equations:log![[thin space (1/6-em)]](https://www.rsc.org/images/entities/char_2009.gif) IP1(μA) = 0.5653 IP1(μA) = 0.5653![[thin space (1/6-em)]](https://www.rsc.org/images/entities/char_2009.gif) log log![[thin space (1/6-em)]](https://www.rsc.org/images/entities/char_2009.gif) ν + 2.6231 (V s−1) (r = 0.9800) ν + 2.6231 (V s−1) (r = 0.9800) |
log![[thin space (1/6-em)]](https://www.rsc.org/images/entities/char_2009.gif) IP2(μA) = 0.4805 IP2(μA) = 0.4805![[thin space (1/6-em)]](https://www.rsc.org/images/entities/char_2009.gif) log log![[thin space (1/6-em)]](https://www.rsc.org/images/entities/char_2009.gif) ν + 2.6067 (V s−1) (r = 0.9983). ν + 2.6067 (V s−1) (r = 0.9983). |
Consequentially, the oxidative stripping of GRN was found to be adsorption–diffusion controlled process.
By increasing of the scan rate, the peak potential of GRN was moved to more positive values that ensure the irreversibility of GRN oxidation process. A linear response between EP1,2 and log![[thin space (1/6-em)]](https://www.rsc.org/images/entities/char_2009.gif) ν in the range from 0.01 to 0.4 V s−1 because after this scan rate the 2nd peak disappears. Fig. 7b and c indicated both relations that represented as:
ν in the range from 0.01 to 0.4 V s−1 because after this scan rate the 2nd peak disappears. Fig. 7b and c indicated both relations that represented as:
EP1 (V) = = 0.1737![[thin space (1/6-em)]](https://www.rsc.org/images/entities/char_2009.gif) log log![[thin space (1/6-em)]](https://www.rsc.org/images/entities/char_2009.gif) ν (V s−1) + 0.9175 (r = 0.9608) ν (V s−1) + 0.9175 (r = 0.9608) |
EP2 (V) = 0.1345![[thin space (1/6-em)]](https://www.rsc.org/images/entities/char_2009.gif) log log![[thin space (1/6-em)]](https://www.rsc.org/images/entities/char_2009.gif) ν (V s−1) + 1.1977 (r = 0.9682). ν (V s−1) + 1.1977 (r = 0.9682). |
In the CV reverse scan, no cathodic peak was observed, hence the reaction would be represented according to Laviron theory for totally irreversible electrode process,33 by the following equation:
| Slope = 2.303RT/αnF | (3) |
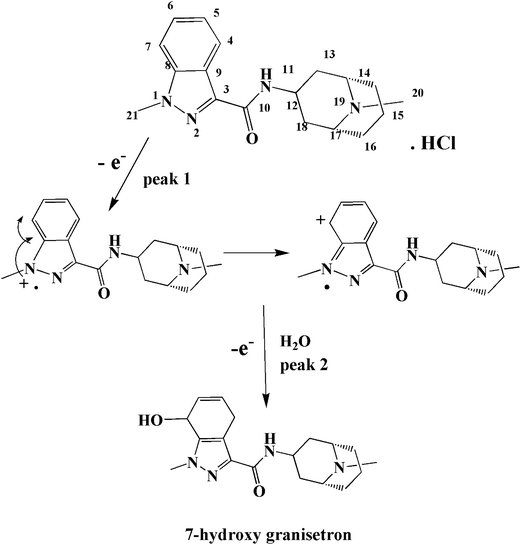
![[thin space (1/6-em)]](https://www.rsc.org/images/entities/char_2009.gif) ν plot for the 1st and 2nd peak, which were found to be 0.1737 and 0.1345, respectively. The values of αn were calculated as 0.34 and 0.44 for the 1st and 2nd peak, respectively. Assuming that (α) equals 0.5, the number of electrons transferred in the two steps of the oxidation process will be equal to 0.68 and 0.88 which is close to one electron in each step. These calculations agree with the proposed oxidation mechanism of GRN in Fig. 8.
ν plot for the 1st and 2nd peak, which were found to be 0.1737 and 0.1345, respectively. The values of αn were calculated as 0.34 and 0.44 for the 1st and 2nd peak, respectively. Assuming that (α) equals 0.5, the number of electrons transferred in the two steps of the oxidation process will be equal to 0.68 and 0.88 which is close to one electron in each step. These calculations agree with the proposed oxidation mechanism of GRN in Fig. 8.
3.7. Mechanism of the electro-oxidation of GRN using poly-Gly/PGE
GRN metabolized in vivo assuming that oxidation occurs first on the nitrogen atom of the N-methyl in the indazole ring,34 which is electroactive resulting in hydroxylation of the benzene ring with formation of 7-hydroxy granisetron. In order to investigate the oxidation behavior of GRN, Doulache M. et al.24 perform a comparative study between indole and GRN using cyclic voltammetry at bare GCE as a function of pH. It was found that the cyclic voltammogram of indole is closely related to that of GRN in phosphate buffer at pH 7.0. Also, the behavior of GRN oxidation is closely related to that of omeprazole as reported by Jorge. S. M. A. et al. in 2009.35 At the indazole moiety, the first oxidation step occurs on N1 by loss of one electron (giving the 1st oxidation peak P1) forming radicle cation that is stabilized by transfer of the positive charge to the ortho position. On addition of water, 7-hydroxygranisetron is produced as indicated in Fig. 8 (the same as in hydroxylation pathway that occurs inside the body36). The oxidation is favored on N1 more than other nitrogen atoms present in the compound due to the high availability of its electrons (charge on each nitrogen is calculated via Chem Draw program, and it was found as the following: −0.6432, +0.2732, +0.2325 and −0.1209 for N1, N2, N11 and N19, respectively). In the 2nd oxidation step peak, there is a loss of another electron leading to formation of 7-hydroxy granisetron. As indicated before in Fig. 7a, the two oxidation steps appear at slow scan rates while on increasing the scan rate the 2nd oxidation peak began to decrease till disappearance or overlapping with the 1st one. So, the 1st peak was chosen for further quantitative determination of GRN.3.8. Influence of supporting electrolyte and pH
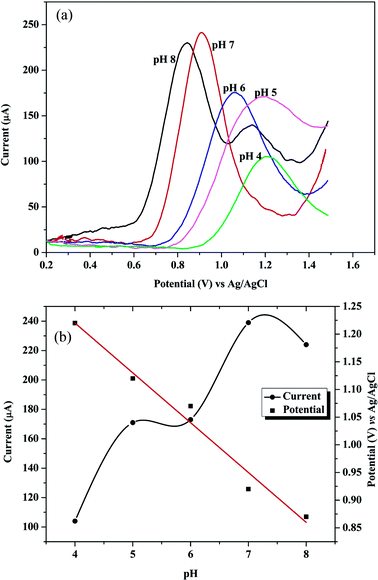
The type of supporting electrolytes and pH value of buffer solution has a great influence on the voltammetric response of GRN. The current responses of 1.0 × 10⁻⁶ M GRN were investigated in various supporting electrolytes such as BR, citrate and phosphate buffer solutions. As observed from Fig. 9, the oxidation peaks of GRN showed relatively high sensitivity and better shape in BR buffer solution. Further, the effect of pH on the oxidation peak current (IP1) of 1.0 × 10⁻⁶ M GRN was examined in 0.04 M of BR buffer at various pH ranged from 4.0 to 8.0 and it was found that it increases with increasing pH value until it reaches 7.0 and then decreases again. Hence, BR buffer at pH 7.0 has been chosen for quantitative analysis of GRN for further experiments. While the second oxidation peak P2 that only appears after pH 7.0 as a small hump as shown in Fig. 9a, wasn't used for quantitation. The plot between EP1 and pH (Fig. 9b) showed that EP decreased gradually by increasing the electrolyte pH according to the following equation:| EP = −0.09 pH + 1.58 (r = 0.9879). |
The slope of the equation was 90 mV which is away from the theoretical value (59 mV) indicating that this step is not pH dependent.
The effect of anions in different supporting electrolytes such as KNO3, KCl and KClO4 on GRN peak current was also examined. It was found that a well-defined peak of GRN was observed in BR buffer containing KNO3 salt. Different concentrations of KNO3 solutions were tested from 0.001 to 0.1 M, and it was found that the best result was obtained with 0.01 M KNO3 solution.
3.9. Influence of voltammetric parameters
Various voltammetric parameters were examined over the range of 3–25 mV for pulse height, 10–250 Hz for frequency and 3–25 mV for step height. It was observed that pulse height of 10 mV, frequency of 250 Hz and step height of 10 mV were the optimum one. These parameters greatly affect the voltammograms for higher sensitivity and excellent peak shape. The effect of accumulation potential and time on the oxidation peak current of GRN was examined also by SWV. The accumulation potential, Eacc was investigated between −0.5 V and 0.5 V. The Eacc was increased from −0.5 V to −0.2 V and then the oxidation peak current of GRN became stable then gradually decreased. Hence, Eacc of −0.2 V was selected for further analysis. Moreover, the effect of accumulation time (tacc) had a great influence on GRN peak current. The oxidation peak current of GRN at poly-Gly/PGE increased with tacc up to 120 s at the Eacc of −0.2 V, suggesting that accumulation improves method sensitivity. When tacc was further increased from 120 to 180 s, the oxidation peak current decreased revealing that the amount of GRN at poly-Gly/PGE reached a saturation state at electrode surface.3.10. Validation results
Under the optimum conditions, the proposed method was validated according to International Conference on Harmonization (ICH) guidelines.37| Parameter | Pure form | Spiked human plasma |
|---|---|---|
| a Limit of detection.b Limit of quantitation.c Standard deviation of the intercept.d Standard deviation of the slope.e Number of experiments. | ||
| Linearity range (μmol L−1) | 0.08–3.00 | 0.25–3.40 |
| LOD (nmol L−1)a | 26.2 | 47.21 |
| LOQ (nmol L−1)b | 79.4 | 143.07 |
| Intercept, a (μmol L−1) ± SDc | 14.65 ± 0.534 | 75.27 ± 1.054 |
| Slope, b (μA μmol−1 L) ± SDd | 103.41 ± 0.413 | 21.88 ± 0.104 |
| Correlation coefficient (r) | 0.9998 | 0.9997 |
| Determination coefficient (r2) | 0.9997 | 0.9994 |
| Intra-day precision (n = 9)e (% RSD) | Not more than 2.67 | Not more than 3.04 |
| Inter-day precision, 5 days, (n = 45)e (% RSD) | Not more than 3.12 | Not more than 3.45 |
3.11. Interferences study
Co-existing compounds capable of competing with GRN in the adsorption site on the electrode surface may result in a decrease or an increase in peak current. Therefore, the effects of common excipients, biologically active compounds and divalent metals were examined to evaluate the selectivity of the developed procedure. The tolerance limit for interfering species was defined as the maximum concentration of foreign substances that made a relative error less than 5% for determination of 1.0 μmol L−1 GRN under the optimum conditions. For this investigation, the results show that over 200-fold excess of hydroxypropyl methylcellulose, lactose, magnesium stearate, 100-fold of polyethylene glycol, starch, and ascorbic acid, 50-fold of uric acid, glucose, sucrose, citric acid and some metals such as Cu2+ and Zn2+ did not affect GRN response. The recovery results were ranged from 96.1 to 103.2% for 1.0 μmol L−1GRN solution, indicating that there was no matrix interference with GRN by the proposed SWV method. This indicates the selectivity of the proposed method and hence its suitability for the determination of GRN in pharmaceuticals and in complex matrices.3.12. Application of the proposed method to pharmaceutical and biological samples
The proposed electrode was successfully utilized for determination of GRN in pharmaceutical formulation; the results of analysis of GRN are recorded in Table 2. Standard addition method was used, where known quantities of pure GRN were mixed with definite amounts of the studied formulation and the mixtures were analyzed. The total amount of the drug was then measured, and the amount of the added drug was determined by the difference. Good recoveries were obtained (96.5–98.0%) with good agreement with the label claim as shown in Table 2. Further, the results were statistically compared to those obtained by a previously reported method.38 From the values of the calculated t and F at 95% confidence level, it can be revealed that there is no significant difference between the proposed method and the reported one.38| a Average of 5 determinations.b Average of 5 volunteers.c At confidence level 95%, theoretical t and F- values equal 3.182 and 2.36, respectively. | |||||||
|---|---|---|---|---|---|---|---|
| Em–Ex ampoule | Human plasma | ||||||
| Labeled claim | 3 mg | Conc. claimed after 20 min | 0.25 μmol L−1 | ||||
| Amount found | 2.96 mg | Conc. found after 20 minb | 0.24 μmol L−1 | ||||
| % Recovery ± SDa | 98.5 ± 1.05 | % Recovery ± SDa | 96.0 ± 3.35 | ||||
| Student t- and F-testc | tcalc. = 1.54 | ||||||
| Fcalc. = 1.76 | |||||||
| Standard addition method | |||||||
| Added (mg) | 0.10 | 0.15 | 0.20 | Added (μg) | 10 | 20 | 30 |
| Found (mg) | 0.098 | 0.145 | 0.193 | Found (μg) | 9.63 | 19.34 | 29.05 |
| % Recovery ± SDa | 98.0 ± 1.37 | 96.6 ± 1.15 | 96.5 ± 0.98 | % Recovery ± SDa | 96.3 ± 2.45 | 96.70 ± 2.84 | 96.8 ± 2.52 |
The applicability of the proposed electrode for detection of GRN in human plasma was attempted. GRN is a potent and highly selective 5-HT3 receptor and it is detectable in human plasma at less than 30 min following IV injection.39,40 The proposed sensor shows a linear response obtained by spiking plasma samples with GRN in the concentration range from 0.25 to 3.40 μmol L−1.
The linear relationships can be expressed according to the following equation:
| IP (μA) = 75.27CGRN (μmol L−1) + 21.88 (r = 0.9997, n = 8). |
The proposed method shows detection and quantification limits in plasma of 47.21 and 143.07 nmol L−1, respectively as shown in Table 1. Good recoveries of GRN achieved from plasma matrix, confirming the suitability of the proposed method for analysis of GRN in biological fluid. Further, real human plasma samples obtained from humans receiving GRN ampoule were collected after 20 min from IV injection, analyzed by the proposed SWV method and the results were summarized in Table 2. Concentration of GRN in real human plasma was calculated from calibration equation.
The good recoveries results of GRN obtained from plasma matrices, confirms the suitability, feasibility and cost effective of the proposed method for analysis of GRN in biological fluid when compared with previously reported electrochemical and HPLC methods.23,41–44
The developed method is characterized by its simplicity and speed and although its sensitivity is not higher than other reported polarographic and chromatographic methods,24,41–44 but it has many advantages over them. The developed method prevents the toxicity hazards of mercury used in polarographic technique and it offers many advantages over HPLC such as speed and low consumption of organic solvents. Added to that, from the economic point of view, it does not need sophisticated and expensive instrumentation and it can be easily utilized for analysis of a lot of biological samples in short time. Its sensitivity is not far from previously reported methods, but it is highly sensitive enough to detect it in plasma without the need for more complicated extraction techniques that used in other methods and highly expensive detectors (like mass detectors).
3.13. Stability, repeatability and reproducibility of poly-Gly/PGE
The SWV of 1.0 μM of GRN was recorded daily to evaluate the stability of the newly modified electrode after preservation in a closed container. The fabricated sensor showed stable results over 10 days and the peak retained was calculated to be 97.3 ± 2.03% of its initial value. This confirms the high stability of the fabricated poly-Gly/PGE.4. Conclusion
In the presented work, a highly sensitive poly-Gly/PGE was prepared and utilized for voltammetric determination of GRN. All electrochemical parameters were studied and optimized. The poly-Gly polymer coating PGE surface enhanced the electron transfer of GRN across the electrode–solution interface. The SWV method was validated according to ICH guidelines and showed higher sensitivity (LOD = 26.2 nmol L−1) with high precision value (% RSD <3.12). The modified electrode was characterized via several methods as cyclic voltammetry (CV), electrochemical impedance spectroscopy (EIS) and scanning electron microscopy (SEM) techniques. Further, FT-IR characterization of the formed poly-Gly layer was investigated and the mechanism of the formed electrode was further discussed. The proposed method was successfully applied to determine GRN in its dosage forms and in human plasma. No interference from matrix of real samples was observed and the proposed method was highly selective for analysis of GRN.Conflicts of interest
The authors declare that there is no conflict of interest.Acknowledgements
The authors gratefully acknowledge Prof. Abdel Maaboud Ismail Mohamed (Pharmaceutical Analytical Chemistry Department, Faculty of Pharmacy, Assiut University, E-mail: aimrageh@yahoo.com) for his valuable help in this research article.References
- Y. Ohnuki, T. Ohsaka, H. Matsuda and N. Oyama, J. Electroanal. Chem. Interfacial Electrochem., 1983, 158, 55–67 CAS.
- L. Yang, F. Zhao and B. Zeng, Electrochim. Acta, 2016, 210, 293–300 CrossRef CAS.
- S. A. Kumar, C. F. Tang and S. M. Chen, Talanta, 2008, 74, 860–866 CrossRef CAS PubMed.
- J. G. G. Manjunatha, J. Food Drug Anal., 2017, 1–8, DOI:10.1016/j.jfda.2017.05.002.
- B. R. L. Ferraz, F. R. F. Leite and A. R. Malagutti, J. Solid State Electrochem., 2015, 20, 2509–2516 CrossRef.
- A. M. Yu, H. L. Zhang and H. Y. Chen, Electroanalysis, 1997, 9, 788–790 CrossRef CAS.
- C. M. Kuskur, K. B. E. Kumara Swamy and H. Jayadevappa, J. Anal. Bioanal. Tech., 2015, 6, 1–6 Search PubMed.
- T. Thomas, R. J. Mascarenhas, B. E. Swamy, P. Martis, Z. Mekhalif and B. S. Sherigara, Colloids Surf., B, 2013, 110, 458–465 CrossRef CAS PubMed.
- G. Zhang, P. He, W. Fenga, S. Ding, J. Chena, L. Li, H. He, S. Zhang and F. Dong, J. Electroanal. Chem., 2016, 760, 24–31 CrossRef CAS.
- Y. Li, X. Liu and W. Wei, Electroanalysis, 2011, 23, 2832–2838 CrossRef CAS.
- V. N. Palakollu, N. Thapliyal, T. E. Chiwunze, R. Karpoormath, S. Karunanidhi and S. Cherukupalli, Mater. Sci. Eng., C, 2017, 77, 394–404 CrossRef CAS PubMed.
- R. de Wit, M. Aapro and P. Blower, Cancer Chemother. Pharmacol., 2005, 56, 231–238 CrossRef CAS PubMed.
- M. A. Kamm, Aliment. Pharmacol. Ther., 2002, 16, 343–351 CrossRef CAS PubMed.
- P. Panzade, P. Puranik, V. Mogal and M. Patnni, Asian J. Res. Chem., 2010, 3, 634–636 Search PubMed.
- I. I. Hewala, M. M. Bedair and S. M. Shousha, Drug Test. Anal., 2013, 5, 234–241 CrossRef CAS PubMed.
- S. Lakshmana Prabu, A. Joseph, A. A. Shirwaikar and R. S. Jeyaprakash, Indian Drugs, 2008, 45, 563–566 Search PubMed.
- P. S. Prabu, P. Selvamani and S. Latha, Lat. Am. J. Pharm., 2010, 29, 1455–1458 Search PubMed.
- A. V. Halerao and S. V. Shirolkar, J. Pharm. Res., 2012, 5, 3208–3212 Search PubMed.
- F. C. Chen, L. H. Wang, J. Guo, X. Y. Shi and B. X. Fang, J. Anal. Methods Chem., 2017, 2017, 6749087 Search PubMed.
- Y. Zhou, J. Jiang, P. Hu and H. Wang, Biomed. Chromatogr., 2014, 28, 1597–1600 CrossRef CAS PubMed.
- I. Hewala, H. El-Fatatry, E. Emam and M. Mabrouk, J. AOAC Int., 2001, 94, 1447–1460 CrossRef.
- I. Hewala, H. El-Fatatre, E. Emam and M. Mubrouk, Talanta, 2010, 82, 184–195 CrossRef CAS PubMed.
- R. Jain and R. Sharma, J. Pharm. Anal., 2012, 2, 443–449 CrossRef CAS PubMed.
- M. Doulache, N. K. Bakirhan, B. Uslu, B. Saidat, M. Trari and S. A. Ozkan, Sens. Actuators, B, 2017, 251, 572–582 CrossRef CAS.
- M. I. Said, A. H. Rageh and F. A. M. Abdel-aal, RSC Adv., 2018, 8, 18698–18713 RSC.
- F. A. M. Abdel-aal, A. H. Rageh, M. I. Said and G. A. Saleh, Anal. Chim. Acta, 2018, 1038, 29–40 CrossRef CAS PubMed.
- F. A. M. Abdel-aal and M. F. B. Ali, J. Electrochem. Soc., 2017, 164, H1053–H1063 CrossRef CAS.
- A. M. Yu, H. L. Zhang and H. Y. Chen, Electroanalysis, 1997, 9, 788–790 CrossRef CAS.
- G. Herlem and T. Gharbi, in Biosensors – Emerging Materials and Applications, ed. P. A.Serra, Institute FEMTO-ST/Department of Optic, UMR CNRS 6174, University of Franche-Comte, France, 2011, ch. 10, pp. 179–208 Search PubMed.
- E. R. Blout and S. G. Linsley, J. Am. Chem. Soc., 1952, 74, 1946–1951 CrossRef CAS.
- G. Fischer, X. Cao, N. Cox and M. Francis, Chem. Phys., 2005, 313, 39–49 CrossRef CAS.
- A. J. Bard and L. R. Faulkner, Electrochemical Methods, Fundamentals and Applications, Wiley, New York, 1980 Search PubMed.
- E. Laviron, J. Electroanal. Chem., 1979, 101, 19–28 CrossRef CAS.
- https://www.drugbank.ca/drugs/DB00889, (accessed 17/2/2018).
- S. M. A. Jorge, A. D. R. Pontinha and A. M. Oliveira-Bretta, Electroanalysis, 2010, 22, 625–631 CrossRef CAS.
- H. Nakamura, N. Ariyoshi, K. Okada, H. Nakasa, K. Nakazawa and M. Kitada, Curr. Drug Metab., 2005, 6, 469–480 CrossRef CAS PubMed.
- International Conference on Harmonization (ICH) Topic Q2 (R1): Validation of Analytical Procedure: Text and Methodology, Nov 2005 Search PubMed.
- S. A. Kanchana, A. Aruna, V. Niraimathi and A. J. Suresh, Int. J. Chem. Sci., 2010, 8, 1169–1173 CAS.
- A. Gurpide, B. Sadaba, S. Martin-Algarra, J. R. Azanza, J. M. Lopez-Picazo, M. A. Campanero, J. P. Cabello, I. Gil-Aldea, S. de la Cruz, V. Fernandez Gallego, C. Reyna, C. Olier Garate, M. J. Blanco-Prieto, J. Ceballos, J. Garcia-Foncillas and J. L. Perez-Gracia, Oncologist, 2007, 12, 1151–1155 CrossRef CAS PubMed.
- I. Wada, T. Takeda, M. Sato, H. Saitoh, T. Nakabayashi, K. Mino, T. Honma, M. Takada and K. Hirano, Biol. Pharm. Bull., 2001, 24, 432–435 CrossRef CAS.
- V. K. Boppana, J. Chromatogr. A, 1995, 692, 195–202 CrossRef CAS PubMed.
- F. Pinguet, F. Bressolle, P. Martel, D. Salabert and C. Astre, J. Chromatogr. B: Biomed. Sci. Appl., 1996, 675, 99–105 CrossRef CAS PubMed.
- S. Xiang, W. Wang, B. Xiang, H. Deng and S. Xie, Int. J. Mass Spectrom., 2007, 262, 174–179 CrossRef CAS.
- R. Jin-min, L. Yan-rong, J. Ye, D. Xiang-yu and H. Fu, Chin. J. Mod. Appl. Pharm., 2008, 4 Search PubMed.
Footnotes |
| † Electronic supplementary information (ESI) available. See DOI: 10.1039/c9ra00179d |
| ‡ These authors contributed equally to this work. |
| This journal is © The Royal Society of Chemistry 2019 |

