 Open Access Article
Enhanced stability and high temperature-tolerance of CO2 foam based on a long-chain viscoelastic surfactant for CO2 foam flooding
Panfeng Zhang *ab,
Shaoran Ren
 *ab,
Yu Shanab,
Liang Zhangab,
Yizhe Liuab,
Lijuan Huangab and
Shufeng Peiab
aKey Laboratory of Unconventional Oil & Gas Development, China University of Petroleum (East China), Ministry of Education, No. 66, Changjiang West Road, Huangdao District, Qingdao 266580, P. R. China. E-mail: rensr@upc.edu.cn; panfengzhang@126.com
bSchool of Petroleum Engineering, China University of Petroleum (East China), Qingdao 266580, P. R. China
First published on 15th March 2019
Abstract
CO2 switchable foams have gained increasing attention recently for their smart properties. However, their performance at high temperature and high pressure has been less documented. In this study, a long-chain viscoelastic surfactant, N1-(3-aminopropyl)-N3-octadecylpropane-1,3-diamine bicarbonate (ODPTA) has been studied as a CO2 foam agent for its application in CO2 flooding in complex and harsh reservoir conditions, and the foam performance under static and dynamic conditions was tested up to 160 °C and 10.5 MPa using a visualized foam-meter and in sand-pack flooding experiments. The viscosity of the ODPTA and conventional surfactant solutions saturated with dissolved CO2 was measured using a long coiled-tube viscometer at HTHP, and its effect on the high temperature-tolerance of CO2 foams has been analyzed. The experimental results show that CO2 foam generated using ODPTA is much more stable than the conventional surfactants (such as SDS and alkylphenol ethoxylates) and has high temperature-tolerance up to 160 °C, and has also exhibited excellent mobility control in CO2 flooding experiments. The viscosity of the ODPTA–CO2 bulk phase can be maintained as high as 12 mPa s under 160 °C and 10.5 MPa, which is much higher than that of the conventional surfactant solutions (similar to water). ODPTA's good foam performance with extremely high temperature-tolerance can be attributed to its high bulk phase viscosity in the brine water saturated with CO2.
1. Introduction
CO2 has been widely applied as one of the most effective injectants for improved oil recovery (IOR) due to its availability and full miscibility with crude oil above the minimum miscible pressure (MMP).1–3 However, during the process of CO2 injection or flooding in oil reservoirs, high mobility and low density of CO2 gas can lead to severe gas channeling and breakthrough, especially in heterogeneous reservoirs, which can decrease the utilization efficiency of CO2.4,5 Therefore, injection of CO2 foam has been proposed and can be used to block large channels and reduce gas mobility.6 In the injection and flooding process of CO2 foam, CO2 and surfactant solution are injected into the reservoir simultaneously or at a slug mode, and foams can be produced in porous media with high porosity and permeability, which will pose high flow resistance due to the Jamin effect, and reduce the mobility of gas and water and promote fluid diversion to low-permeability zones.7–9 In addition, surfactants can reduce interfacial tension between water and oil, which can significantly improve the displacement efficiency.10–12 Therefore, CO2 foam injection is effective not only for gas mobility control but also for increasing displacement efficiency.13,14However, foam is a kind of instable thermodynamic system, and especially CO2 foam is difficult to generate and less stable than N2 foams due to relatively high solubility of CO2 in water, which poses a great challenges to select CO2 foaming agents.15 Reservoirs with temperature up to 160 °C and formation water salinity over 100![[thin space (1/6-em)]](https://www.rsc.org/images/entities/char_2009.gif) 000 ppm are confronted in many oilfields over the world, so there is a practical industrial need to develop stable CO2 foams for their application at high temperature and high pressure (HTHP) conditions.16 The most commonly method for improving foam stability is addition of the so-called foam stabilizers to foam agent solutions.17,18 Foam stabilizers are generally divided into two categories according to their function principles. One is to reduce the ability of CO2 to permeate through foam films, via increasing the amount of adsorbed surfactant at the foam film by addition of some synergic agents, or via reducing the contact area of CO2–liquid phase by adding nanoparticles to the dispersion solutions.19–23 The other is to reduce the drainage velocity of foam film by endowing viscoelastic properties of the aqueous solution, such as adding polymers or mixture of anionic surfactants to form worm-like micelles.24–26
000 ppm are confronted in many oilfields over the world, so there is a practical industrial need to develop stable CO2 foams for their application at high temperature and high pressure (HTHP) conditions.16 The most commonly method for improving foam stability is addition of the so-called foam stabilizers to foam agent solutions.17,18 Foam stabilizers are generally divided into two categories according to their function principles. One is to reduce the ability of CO2 to permeate through foam films, via increasing the amount of adsorbed surfactant at the foam film by addition of some synergic agents, or via reducing the contact area of CO2–liquid phase by adding nanoparticles to the dispersion solutions.19–23 The other is to reduce the drainage velocity of foam film by endowing viscoelastic properties of the aqueous solution, such as adding polymers or mixture of anionic surfactants to form worm-like micelles.24–26
Recently, one developed a series of CO2 switchable wormlike micellar system fabricated by a long-chain amine-based compound in the presence of CO2.27 These system may show potential to stabilize CO2 foams for its viscosity of the solution was extremely enhanced through the molecules self-assembling to form three-dimensional network structures in their aqueous solution.27–29 In aqueous solution, H+ can be generated after CO2 is dissolved in water.1 The head-group of the amine compounds can combine with H+, forming a new “chemical structure”, which can cause the properties of the compounds dramatically changed, such as the better solubility in water, higher surface active and good foam performance.27 By utilizing the chemical properties of amine compounds, one can facilitate CO2 foams system for mobility control in reservoir, and which can endow the system characteristics with selectively block or smartly control to gas breakthrough.30
In this study, a viscoelastic surfactant named N1-(3-aminopropyl)-N3-octadecylpropane-1,3-diamine bicarbonate (ODPTA), will be investigated for its performance as CO2 foam agent and foam stabilizer at high temperature and high pressure conditions, in order to enhanced the CO2 foam performance system with high-temperature and salinity tolerance. The interactions of the compound with CO2, and its performance and mechanisms on stabilizing CO2 foams are analyzed via foam-meter testing and foam flooding experiments. The viscosity of the ODPTA solution saturated with CO2 is measured using a long-coiled tube viscometer, and its effect on the stability and high temperature-tolerance of CO2 foams will be studied.
2. Chemical principles
2.1. Interactions of CO2 in aqueous solution
When CO2 dissolves in water, CO2 (aq) is involved in a sequence of chemical reactions:31,32
 | (1) |
 | (2) |
 | (3) |
 | (4) |
Assuming the solution is electrically neutral, one can write the charge balance on H+, OH−, HCO3−, and CO32− as33
| [H+] = [OH−] + [HCO3−] + 2[CO32−] | (5) |
In the acidic solution, [HCO3−] ≫ [CO32−] and Ka1 [CO2(aq)] ≫ KW, are related in eqn (1)–(4), and can be written as33,34
 | (6) |
 | (7) |
The temperature dependence of the equilibrium constants can be described by the following correlations,32,35
 | (8) |
 | (9) |
In the aqueous solution, [CO2(aq)] ≫ [HCO3−] and [CO2(aq)] ≫ [CO32−], based on the assumption of infinite dilution of mixture solution, one can write:33
| [CO2(aq)] ≈ SCO2 | (10) |
The solubility of CO2 in formation water at a given temperature and pressure condition is assumed to be related with salinity, and can be calculated by the method from Duan,36,37 as shown in Table 1.
| Temperature/K | Pressure/bar | |||||
|---|---|---|---|---|---|---|
| 20 | 40 | 60 | 80 | 100 | 120 | |
| 333 | 0.2892 | 0.5259 | 0.7132 | 0.8564 | 0.9604 | 1.0428 |
| 353 | 0.2255 | 0.4193 | 0.58 | 0.7111 | 0.8156 | 0.8966 |
| 373 | 0.1865 | 0.3562 | 0.5017 | 0.6253 | 0.7294 | 0.8162 |
| 393 | 0.1601 | 0.3173 | 0.4553 | 0.5762 | 0.6817 | 0.7733 |
| 413 | 0.1386 | 0.2913 | 0.4281 | 0.5505 | 0.66 | 0.7578 |
| 433 | 0.1162 | 0.2706 | 0.4111 | 0.539 | 0.6555 | 0.7617 |
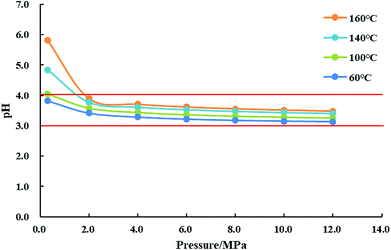
The pH value of CO2 aqueous solution at various temperature and pressure is calculated by eqn (7)–(10), and the result is shown in Fig. 1. As it can be seen, the pH value of water saturated with CO2 can be reduced to 3.0–4.0 at relatively high pressure and temperature. So the dissolution and ionization of CO2 in formation water can induce an acidic solution environment during CO2 injection, which can make the CO2 injection have more chemically active features than other gas injections, such as corrosion, geochemical reactions, and chemical interactions.
2.2. Protonation reaction and self-assembled wormlike micelles
Protonation of a molecule or ion can change its chemical properties, not just the charge and mass, its hydrophilicity and optical features can be also changed.38,39 The amine compounds can be protonated in the aqueous solution saturated with CO2 since the nitrogen atom in the amine groups is with sp3 hybridization and has one lone pair of electrons.11 The compound or surfactant, as shown in Fig. 2, octadecyl dipropylene triamine (ODPTA) has a polyamine head-group and a C18-tailed hydrocarbon chain. At room temperature and in pure water, the aqueous solution of 1.0 wt% ODPTA (the overlapping concentration C* ∼ 0.13 wt% in deionized water at 30 °C) is milky like with low-viscosity due to poor solubility of the long hydrophobic tails.27 In aqueous solution saturated with CO2, the terminal amine groups can form ammonium hydrogen carbonate, thus ODPTA behaves like an ionic surfactant and has enhanced water-solubility.30,40 As described by Zhang,27 the pKaH value of the primary, middle secondary and other secondary amine groups is 10.08, 7.41 and 4.64, respectively. Therefore, in the solutions with CO2 and pH value less than 4, the predominant ODPTA molecules can be charged, and converted to be a cationic species like C18H37–NH2+–(CH2)3–NH2+–(CH2)3–NH3+, and an anionic species C18H37–NH–(CH2)3–NH2–(CH2)3–NH2–CO2−, which co-exist with other ions of CO32−, HCO3− and H+ in water dissolved with CO2. The electrostatic binding between protonated surfactant C18H37–NH2+–(CH2)3–NH2+–(CH2)3–NH3+ and anionic surfactant C18H37–NH–(CH2)3–NH2–(CH2)3–NH2–CO2− can promote to form ion pairs and play a role as the pseudo-Gemini surfactant, which facilitates the formation of wormlike micelles through effective screening of electrostatic repulsions between ionic head-groups.41 In addition, with the solubility of ODPTA increasing in the aqueous solution saturated with CO2, more long-chain ODPAT molecules entrance into liquid phase. In order to minimize the free energy, these long-chain surfactant molecules can self-assembling at a very low concentration (∼0.0051 wt%), forming small micellar aggregates, which can gradually grow into long wormlike micelles (WLMs) with more ODPTA molecules being charged. Above C*(∼0.13 wt%), the WLMs overlap and entangle into a dynamic transient network, enhancing the viscoelasticity of the solutions. And the worm like micelles was verified and observed in the work of Zhang using a Cryo-TEM technique. The micrographs of ODPTA at 30 °C before bubbling CO2 and after bubbling CO2 is shown in Fig. 3.27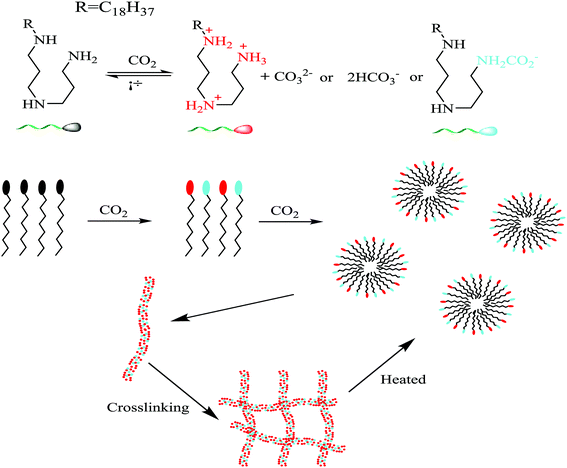 | ||
| Fig. 2 Schematic diagrams of ODPTA based protonation and self-assembling into wormlike micelles (WLMs). | ||
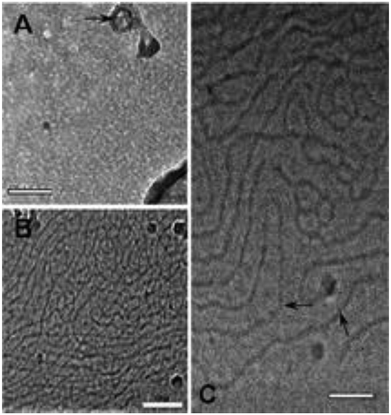 | ||
| Fig. 3 Cry-TEM micrographs of ODPTA. (A) Before bubbling CO2; (B) and (C) after bubbling CO2. The scale bar is 100 nm for (A) and (B), 50 nm for (C).27 | ||
2.3. Temperature effect on viscoelasticity and foam films
In aqueous solutions, as the length of WLMs increasing, WLMs entangle into a three-dimensional transient network, which can impart the viscoelastic properties of the solution.42 Wormlike micelles are much like polymers with an important exception that the micelles are in thermal equilibrium with their monomers.43 Hence, it can break and recombine as a “living polymers”.44–46 The longer micelles eventually entangle, the larger of the viscosity of their solution increases.47The average micellar length, ![[L with combining macron]](https://www.rsc.org/images/entities/i_char_004c_0304.gif) , is thus a thermodynamic quantity, and it responds to changes in temperature. Based on the mean-field theory of Cates and Candau,
, is thus a thermodynamic quantity, and it responds to changes in temperature. Based on the mean-field theory of Cates and Candau, ![[L with combining macron]](https://www.rsc.org/images/entities/i_char_004c_0304.gif) is associated with the chain scission energy, Esc, as following relationship:48,49
is associated with the chain scission energy, Esc, as following relationship:48,49
 | (11) |
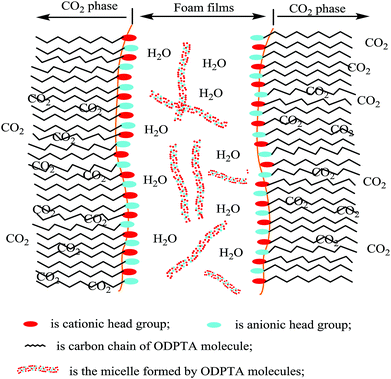
However, when the wormlike micellar solution is heated up, the micellar contour length ![[L with combining macron]](https://www.rsc.org/images/entities/i_char_004c_0304.gif) decays exponentially with temperature.49 The reason for this is that, at a higher temperature, surfactant unimers can hop more rapidly between the cylindrical body and hemispherical end-cap of the worm-like molecules. At higher temperatures, long micelles can be separated into short ones, and the worms are much shorter so that they cannot entangle with the rest (since the volume fraction of entangled worms reduces).47 Apparently, the viscosity decreases in the surfactant solution with WLMs at higher temperatures. At low temperatures, the surfactant molecules are bounded into long micelles and cannot move freely. As the temperature increases, some molecules can be released from worm-like micelles, distributed at the phase interface between gas and fluid, forming the foam films. Thereby, in the ODPTA–CO2 system, when CO2 foam is generated, wormlike micelles can exist in the foam films as shown in Fig. 4.
decays exponentially with temperature.49 The reason for this is that, at a higher temperature, surfactant unimers can hop more rapidly between the cylindrical body and hemispherical end-cap of the worm-like molecules. At higher temperatures, long micelles can be separated into short ones, and the worms are much shorter so that they cannot entangle with the rest (since the volume fraction of entangled worms reduces).47 Apparently, the viscosity decreases in the surfactant solution with WLMs at higher temperatures. At low temperatures, the surfactant molecules are bounded into long micelles and cannot move freely. As the temperature increases, some molecules can be released from worm-like micelles, distributed at the phase interface between gas and fluid, forming the foam films. Thereby, in the ODPTA–CO2 system, when CO2 foam is generated, wormlike micelles can exist in the foam films as shown in Fig. 4.
3. Experimental
3.1. Materials
In this work, the long-chain amine compound, octadecyl dipropylene triamine (ODPTA) (over 90% mass purity) formulated in the laboratory, was investigated along with other conventional surfactants, namely, branched alkylphenol ethoxylates with different numbers of polyoxyethylene (EO = 15 and EO = 21, named as NP-15 and NP-21, respectively, nonionic surfactant), NP-15-H and NP-21-H (sulfonated by NP-15 and NP-21, respectively, anionic surfactant), which were provided by Haian Petrochemical Company (Jiangsu, China), and sodium dodecyl sulfate (SDS, as anionic surfactant, purchased from Sinopharm Chemical Reagent Co., Ltd (Beijing, China)). The properties of the surfactants are described in Table 2. CO2 (99.9% mass purity) used in the experiments was supplied by Tianyuan Gas Co., Ltd. (Qingdao, China). Deionized water, NaCl and CaCl2 (pure chemical) were used to formulate formation water. The compositions of the formation water in all experiments are listed in Table 3. All the reagents were used without further treatment. The surface tension of ODPTA solution was measured at 80 °C and at the different pressure of CO2. The results is shown in Table 4, and it shows that the surface tension of the solution can be dramatically decreased by adding ODPTA in CO2, which indicates the ODPTA is a kind of surfactant in water saturated with CO2.| Surfactants | Molecular formula | Average molar mass | HLB value |
|---|---|---|---|
| a HLB: hydrophilic–lipophilic balance value. | |||
| ODPTA |  |
383 | 22 |
| NP-21-H |  |
1230 | 19 |
| NP-21 |  |
1144 | 16.5 |
| NP-15-H |  |
966 | 17 |
| NP-15 |  |
880 | 15.4 |
| SDS | C12H25–O–SO3Na | 288 | 40 |
| Ions | Na+ | Ca2+ | Cl− |
|---|---|---|---|
| Content (mg L−1) | 6772.2 | 1000 | 12![[thin space (1/6-em)]](https://www.rsc.org/images/entities/char_2009.gif) 227.8 227.8 |
| Pressure (MPa) | 0 | 0.5 | 1 | 1.5 | 2 |
|---|---|---|---|---|---|
| Surface tension (mN m−1) | 28.34 | 26.35 | 25.12 | 24.61 | 24.23 |
3.2. Methods
 | (12) |
 | (13) |
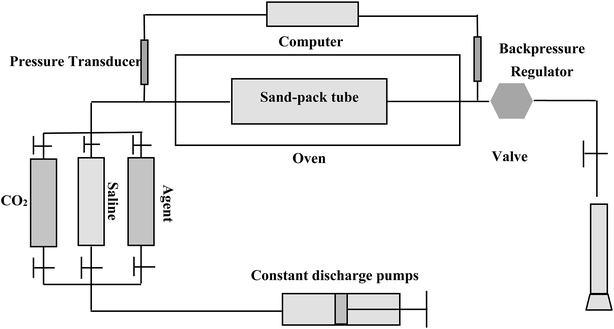 | ||
| Fig. 7 Experimental set-up for CO2 and CO2 foam flooding to assess the blocking and mobility control capability using sand-packs. | ||
(1) The sand-pack model was filled with quartz sands.
(2) The sand-pack was vacuumized, and its porosity was measured using a method of self-suction deionized water.
(3) For permeability measurement, deionized water was injected at a consistent flow rate of 1 ml min−1 at 40 °C and at the atmospheric pressure for measuring the pressure drop across the model, and the permeability was calculated based on the Darcy's law.
(4) The formation water was injected into the sand-pack model at 1 ml min−1 at a pre-set temperature and 10.5 MPa, and the pressure differences, ΔP1, was measured by a differential pressure transducer.
(5) The foam agent solution was first injected into the sand-pack by a constant discharge pump at a flow rate of 1 ml min−1 up to 0.4 PV (pore volume), and then CO2 solution was injected at 1 ml min−1, also up to 0.4 PV. The process was alternating at 4 circles until 3.2 PV fluid was flooded. This experimental process is similar to a routine WAG (water alternating gas with 1![[thin space (1/6-em)]](https://www.rsc.org/images/entities/char_2009.gif) :
:![[thin space (1/6-em)]](https://www.rsc.org/images/entities/char_2009.gif) 1 of water and gas volume ratio). The pressure difference, ΔP2, across the sand-pack during CO2 injection or agent solution injection was measured.
1 of water and gas volume ratio). The pressure difference, ΔP2, across the sand-pack during CO2 injection or agent solution injection was measured.
In the flooding experiments, the resistance factor (Z = ΔP2/ΔP1) can be calculated to characterize the foam performance and its mobility control capability. Normally for CO2 foam flooding, a resistance factor greater than 20 can be considered as significant, since the mobility of CO2 foam can be decreased to over 20 times less than that of water flooding. Obviously, the greater of the resistance factor, the better performance of the foam agent.
4. Experimental results and discussions
4.1. Foam state and rheological properties
The viscoelasticity effect of the ODPTA solution can be firstly observed by comparing to the state of the aqueous solutions of SDS and ODPTA as shown in Fig. 8. After bubbling CO2 into the solutions for 10 min at 25 °C and 0.1 MPa, the solutions of SDS and ODPTA exhibited different distribution state of CO2 foam or bubbles. The gas bubbles can be stably “suspended” in the ODPTA solution, while they quickly escaped from the solution and just formed foams on the top of the SDS solution. There is no doubt that high viscous force and elasticity of the ODPTA solution can prevent gas bubbles escaping from the solution.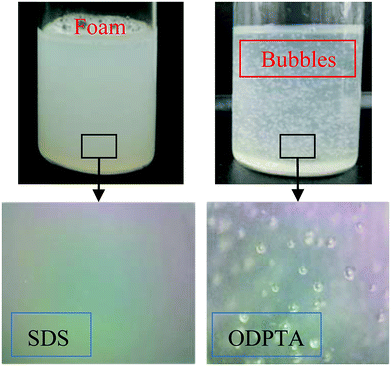 | ||
| Fig. 8 State of the CO2 foam/bubbles formed in SDS and ODPTA aqueous solutions: gas bubbles can be “suspended” in the ODPTA solution due to its high viscoelasticity. | ||
The rheological properties of the aqueous solutions of the surfactants were measured and shown in Table 5. In the previous section, it has described that, after bubbling CO2 into the ODPTA solution, ODPTA molecules can be protonated and form worm-like micelles, so that the viscosity of the solution can be increased dramatically. As shown in Table 4, the viscosity of 1.0 wt% ODPTA (1 wt% = 0.0261 mol L−1) solution can be enhanced by two orders of magnitude (from 1.12 mPa s to 323 mPa s) after bubbling CO2 at ambient conditions, while the viscosity of the SDS solution is maintained at 1.03 mPa s after bubbling CO2, similar to pure water. In addition, after bubbling CO2, the ODPTA aqueous solution shows good viscoelasticity (G′ > G′′), while the SDS solution appears little elastic features.
In particular, the SDS foams appeared on the surface of the solution can only stabilize for few minutes, while the ODPTA bubbles can exist in the solution for over two days at 25 °C and 0.1 MPa. Apparently, it can be attributed to the viscosity (and viscoelasticity) of the bulk phase. The higher viscosity of the continuous phase is, the lower the velocity of film drainage and the slower gas diffusion will occur in the liquid phase. A low gas diffusion velocity of bubbles is expected to sufficiently maintain bubble size and thus enhance the foam stability.
4.2. Viscosity of surfactant solutions at HTHP
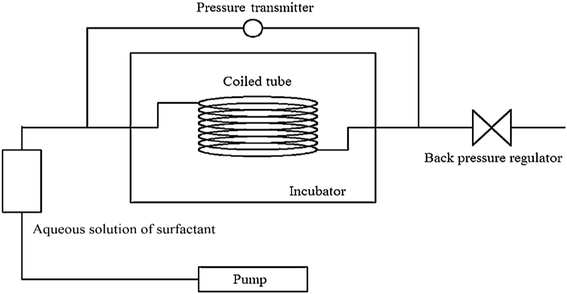
The viscosity of ODPTA–CO2 and other conventional surfactants (SDS, NP-15, NP-15-H, NP-21 and NP-21-H) solution saturated with CO2 was measured at high temperatures and at 10.5 MPa via the capillary tube viscometer described in Section 3.2.1. The viscosity of NP-15, NP-21 and NP-21-H are listed in Table 6, and the other results are shown in Fig. 9. The results showed that the viscosity of the ODPTA–CO2 solution is much higher (209 times at 60 °C, 47 times at 160 °C) than that of the conventional surfactant solutions (e.g. SDS), indicating a viscous micellar structure can be formed through self-assembling behaviors of the ODPTA molecules at HPHT in the presence of CO2 as described in Fig. 2. As it can be seen, the viscosity of the ODPTA solution is dropped from 190 mPa s at 60 °C to 12 mPa s at 160 °C, and the viscosity of the SDS solution is changed from 0.91 mPa s to 0.25 mPa s. In contrast to the SDS solution, the worm-like micelles in the ODPTA solution saturated with CO2 can significantly increase its viscosity. Moreover, long worm-like ODPTA micelles can break into short micelles at high temperature, leading to viscosity reduction with increasing temperature.| Surfactants | Viscosity/mPa s | ||||
|---|---|---|---|---|---|
| 60 °C | 80 °C | 100 °C | 130 °C | 160 °C | |
| NP-15 | 0.962 | 0.834 | 0.752 | 0.508 | 0.364 |
| NP-21 | 0.992 | 0.851 | 0.762 | 0.511 | 0.382 |
| NP-21-H | 0.951 | 0.823 | 0.724 | 0.498 | 0.359 |
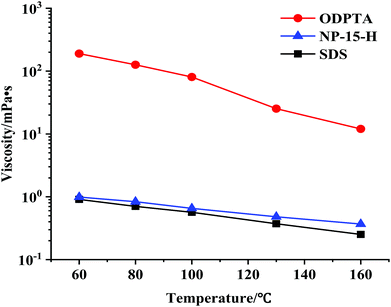 | ||
| Fig. 9 Viscosity of the ODPTA and the NP-15-H and SDS solutions saturated with CO2 and measured at different temperatures and at 10.5 MPa (all with 1.0 wt% surfactant concentration). | ||
4.3. Foam performance
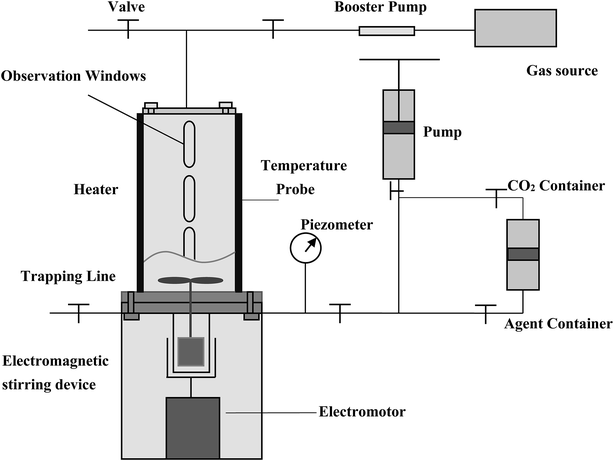
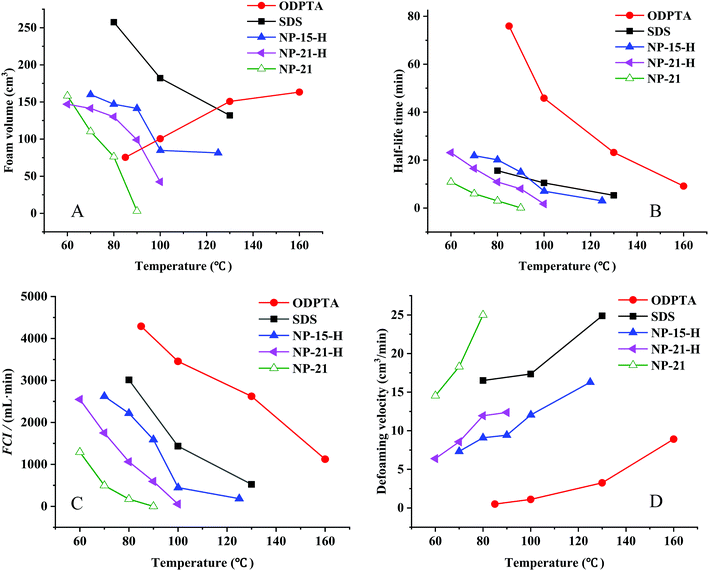
The foam performance of the ODPTA and other conventional surfactants (all with 1.0 wt% concentration) at high temperature was measured and shown in Fig. 10. The foam volume (Vmax) (in Fig. 10A) is characterised for foaming-ability, and the half-life time (T0.5) (in Fig. 10B) is for foam stability. The foam comprehensive index (FCI, in Fig. 10C) is a generalized foam performance indicator, calculated as 0.75 × Vmax × T0.5. The larger the FCI value is, the better foam performance of the surfactant is. The de-foaming velocity (in Fig. 10D) is calculated by dividing the foam volume by its half-life time.As it can be seen from Fig. 10A, the volume of the ODPTA foam increases with temperature increasing, while the foam volume of the conventional surfactants (SDS, NP-15-H and NP-21-H and NP-21) decreases at higher temperatures. In Section 2.3, it was proposed that, as temperature rises, the long chain worm-like micelles can break into short micelles, and some surfactant molecules can escape and get free from the micelle structure to form more foams. With the number of the free surfactant molecules in the solution increasing, when the external force gets from stirring to solution system, more molecules can be distributed on the gas–liquid interface that more foam film is generated and more foam is produced, so the ODPTA foam increases with the temperature increasing.
Due to its specific molecule structure and relatively high viscosity of the ODPTA solution, in comparison with other conventional surfactants, its foam stability (half-life time) is greatly enhanced at high temperature as the experimental results shown in Fig. 10B. A drainage velocity for the liquid in foam films can also be used to characterize the foam stability, which can be described by the equation below :54,55
 | (14) |
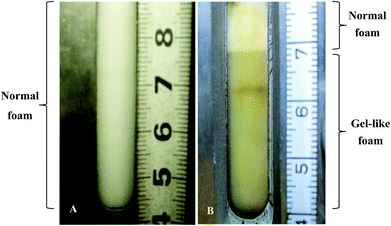
It is worth pointing out that the ODPTA foam shows different morphology in comparison with that of the other surfactants at high temperature. The foam morphology of ODPTA and SDS is displayed in Fig. 11. It is observed that the SDS foam is a uniform state (Fig. 11A), while the ODPTA foam is divided into two parts, as shown in Fig. 11B, including normal foam and “gel-like foam”. The high bulk phase viscosity of ODPTA solution make the gel-like foam generating after CO2-solution mixing by stirring at high speed, which also contribute to high foam stability.
4.4. CO2 foam flooding experiments
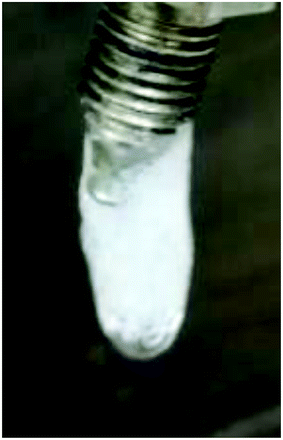
The CO2 foam performance of 1.0 wt% ODPTA at dynamic flow conditions in sand-pack flooding is shown in Fig. 12. The experiments were conducted at around 10 MPa and at different temperatures. And the permeability of the three sand packs were 143.5 mD, 169.2 mD and 185.2 mD at 80 °C, 100 °C and 160 °C, respectively. The varying and fluctuated resistance factor was in line with the 4 WAG circles injected during the flooding experiment. As the foam agent solution and CO2 were alternating injected into the sand pack, the CO2 foam was generated in core and the flow resistance was produced. Before 0.8 PV, little CO2 foam was generated, which lead to low flow resistance factor. And the larger amount of CO2 foam was generated after 1.2 PV (CO2 was injected at the second time) at 160 °C, the resistance factors increase rapidly. The results also show that the resistance factor increases significantly when the temperature rise up to 160 °C. That is high temperature can be conducive to the enhancement of the mobility control capability of the foam at experimental temperature range. Fig. 13 shows the flowing foam observed at the exit of the sand-pack, which indicates high flow resistance at 160 °C generated by the Jamin effect of the CO2 foams, not by the speculative plugging through aggregation or precipitation of surfactant molecules. Similar foam flooding experiments were conducted using the conventional surfactants (e.g. SDS), the maximum resistance factor achieved at the same experimental condition was only up to 50, much less than that obtained during the ODPTA foam flooding. And the maximum resistance factor decreased with the temperature increasing.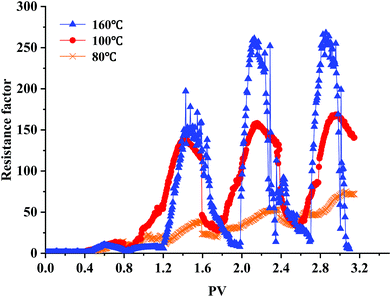 | ||
| Fig. 12 Performance of the ODPTA stabilized CO2 foam at dynamic flow conditions during sand-pack flooding: the higher of temperature, the better foaming and mobility control capability. | ||
The relationship between resistance factor and viscosity of the bulk solution can be explained by the equation of foam’ apparent viscosity and Darcy's low.
The foam's apparent viscosity can be expressed by the following equation:56
 | (15) |
![[small gamma, Greek, dot above]](https://www.rsc.org/images/entities/i_char_e0a2.gif) is the shear rate, ϕ is the volume fraction of gas phase, R is the foam size, γ is the interfacial tension, and μe is the viscosity of the bulk phase of the surfactant solution.
is the shear rate, ϕ is the volume fraction of gas phase, R is the foam size, γ is the interfacial tension, and μe is the viscosity of the bulk phase of the surfactant solution.
Based on the Darcy's law, the pressure difference across the sand-pack during the foam flooding experiments can be calculated as
 | (16) |
At a given experimental condition, the foam's resistance factor (or the pressure difference across the sand-pack) is proportional to the foam's apparent viscosity and the viscosity of the bulk phase of the surfactant solution. So high bulk phase viscosity can partially contribute to foam's high resistance factor during foam flooding, but most importantly, as discussed in Section 4.3, higher bulk phase viscosity of the ODPTA solution can be attributed to generate more stable and stronger foams with higher yield stress at higher temperatures.
5. Conclusions
A long-chain amine based surfactant, octadecyl dipropylene triamine (ODPTA), has been investigated as CO2 foam agent at high pressure and high temperature conditions. The following conclusions can be drawn from this work:(1) In water solution saturated with CO2, ODPTA compound can be protonated to become a CO2-sensitive ionic surfactant with good foamability. Consequently, the ODPTA molecules can self-assemble to form wormlike micellars, which make the ODPTA solution with a relatively high viscosity (i.e. over 100 mPa s at concentration of 0.5% wt) and good viscoelasticity, much better than that of SDS solution (similar to water). These characteristics of the ODPTA make it a special surfactant-like compound as CO2 foam agent.
(2) Experimental results of foam performance have shown that CO2 foam formed using ODPTA is much more stable than the conventional surfactants (such as SDS and alkylphenol ethoxylates) and has high temperature-tolerance up to 160 °C. It can be partially attributed to the high bulk phase viscosity of the ODPTA solution that can lead to lower drainage velocity of foam film and higher foam stability. The viscosity of the ODPTA–CO2 (1.0 wt%) bulk phase can be maintained at 12 mPa s at 160 °C, much higher than the water-like the SDS solutions, and its CO2 foam performance (foam comprehensive index) is 3 times over that of the SDS at 130 °C.
(3) The experimental results of foam flooding indicate that CO2 foam stabilized by ODPTA can have much better mobility control capability at high temperature and high pressure conditions. The data show that the resistance factor of the foam flooding can be increased from 50 to over 250 with temperature increasing form 80 °C to 160 °C.
Conflicts of interest
The authors declare no competing financial interest.Acknowledgements
Financial support from the Graduate Innovation Program of China University of Petroleum (YCX2018011), the Fundamental Research Funds for the Central Universities (No. 18CX05009A), and the Changjiang Scholars and Innovative Research Team Program (IRT1294 and 1086/14R58) are greatly acknowledged.References
- G. Cui, Y. Wang, Z. Rui, B. Chen, S. Ren and L. Zhang, Energy, 2018, 155, 281–296 CrossRef CAS.
- F. Huang, H. Huang, Y. Wang, J. Ren, L. Zhang, B. Ren, H. Butt, S. Ren and G. Chen, J. Pet. Sci. Eng., 2016, 145, 328–335 CrossRef CAS.
- B. Ren, S. Ren, L. Zhang, G. Chen and H. Zhang, Energy, 2016, 98, 108–121 CrossRef CAS.
- J. Han, M. Lee, W. Lee, Y. Lee and W. Sung, Appl. Energy, 2016, 161, 85–91 CrossRef CAS.
- G. Lv, Q. Li, S. Wang and X. Li, J. CO2 Util., 2015, 11, 31–40 CrossRef CAS.
- J. S. Solbakken, A. Skauge and M. G. Aarra, Energy Fuels, 2014, 28, 803–815 CrossRef CAS.
- Y. Zhang, Y. Wang, F. Xue, Y. Wang, B. Ren, L. Zhang and S. Ren, J. Pet. Sci. Eng., 2015, 133, 838–850 CrossRef CAS.
- R. Feng Li, W. Yan, S. Liu, G. Hirasaki and C. Miller, SPE J., 2010, 15, 928–942 CrossRef.
- G. Hirasaki, C. A. Miller and M. Puerto, SPE J., 2011, 16, 889–907 CrossRef CAS.
- K. Babu, N. Pal, A. Bera, V. K. Saxena and A. Mandal, Appl. Surf. Sci., 2015, 353, 1126–1136 CrossRef CAS.
- D. Li, B. Ren, L. Zhang, J. Ezekiel, S. Ren and Y. Feng, Chem. Eng. Res. Des., 2015, 102, 234–243 CrossRef CAS.
- L. Kapetas, S. Vincent Bonnieu, S. Danelis, W. R. Rossen, R. Farajzadeh, A. A. Eftekhari, S. R. Mohd Shafian and R. Z. Kamarul Bahrim, J. Ind. Eng. Chem., 2016, 36, 229–237 CrossRef CAS.
- T. Blaker, M. G. Aarra, A. Skauge, L. Rasmussen, H. K. Celius, H. A. Martinsen and F. Vassenden, SPE Reservoir Eval. Eng., 2002, 5, 317–323 CrossRef CAS.
- H. Yang, L. Hu, C. Chen, Y. Gao, X. Tang, X. Yin and W. Kang, RSC Adv., 2018, 8, 10478–10488 RSC.
- S. Kumar and A. Mandal, Appl. Surf. Sci., 2017, 420, 9–20 CrossRef CAS.
- M. Puerto, G. J. Hirasaki, C. A. Miller and J. R. Barnes, SPE J., 2012, 17, 11–19 CrossRef CAS.
- D. Wang, Q. Hou, Y. Luo, Y. Zhu and H. Fan, J. Dispersion Sci. Technol., 2015, 36, 268–273 CrossRef CAS.
- Q. Sun, Z. Li, J. Wang, S. Li, L. Jiang and C. Zhang, RSC Adv., 2015, 5, 67676–67689 RSC.
- Y. Wang, Y. Zhang, Y. Liu, L. Zhang, S. Ren, J. Lu, X. Wang and N. Fan, J. Pet. Sci. Eng., 2017, 154, 234–243 CrossRef CAS.
- Q. Sun, Z. LI, S. LI and B. Li, J. China Univ. Pet., Ed. Nat. Sci., 2016, 40, 101–108 Search PubMed.
- L. Zhang, J. Kang, Y. Zhang, P. F. Zhang, S. R. Ren, S. Khataniar and X. Y. Guo, J. Energy Resour. Technol., 2018, 140, 112902 CrossRef.
- Q. Zhu, H. Zhou, Y. Song, Z. Chang and W. Li, Int. J. Miner., Metall. Mater., 2017, 24, 208–215 CrossRef CAS.
- J. San, S. Wang, J. Yu, N. Liu and R. Lee, SPE J., 2017, 22, 1416–1423 CrossRef CAS.
- S. y. Chen, G. q. Jian, Q. f. Hou, S. l. Gao, Y. s. Luo, Y. y. Zhu and W. j. Li, Int. J. Oil, Gas Coal Technol., 2013, 6, 675–688 CrossRef CAS.
- Y. Chen, A. S. Elhag, A. J. Worthen, P. P. Reddy, A. M. Ou, G. J. Hirasaki, Q. P. Nguyen, S. L. Biswal and K. P. Johnston, J. Chem. Eng. Data, 2016, 61, 2761–2770 CrossRef CAS.
- W. Pu, P. Wei, L. Sun and S. Wang, RSC Adv., 2017, 7, 6251–6258 RSC.
- Y. Zhang, Y. Feng, J. Wang, S. He, Z. Guo, Z. Chu and C. A. Dreiss, Chem. Commun., 2013, 49, 4902–4904 RSC.
- W. Kang, P. Wang, H. Fan, H. Yang, C. Dai, X. Yin, Y. Zhao and S. Guo, Soft Matter, 2017, 13, 1182–1189 RSC.
- J. Wang, M. Liang, Q. Tian, Y. Feng, H. Yin and G. Lu, J. Colloid Interface Sci., 2018, 523, 65–74 CrossRef CAS PubMed.
- Y. Liu, P. G. Jessop, M. Cunningham, C. A. Eckert and C. L. Liotta, Science, 2006, 313, 958–960 CrossRef CAS PubMed.
- T. Tsuji, M. Shigeru, T.-a. Hoshina, K. Yoneda, T. Funazukuri and N. A. Morad, Fluid Phase Equilib., 2017, 441, 9–16 CrossRef CAS.
- K. J. Ziegler, J. P. Hanrahan, J. D. Glennon and J. D. Holmes, J. Supercrit. Fluids, 2003, 27, 109–117 CrossRef CAS.
- S. E. Hunter and P. E. Savage, Ind. Eng. Chem. Res., 2003, 42, 290–294 CrossRef CAS.
- E. Niemeyer and F. V. Bright, J. Phys. Chem. B, 1998, 102, 1474–1478 CrossRef CAS.
- W. Stumm and J. J. Morgan, Aquatic chemistry: chemical equilibria and rates in natural waters, John Wiley & Sons, 2012 Search PubMed.
- Z. Duan, R. Sun, C. Zhu and I.-M. Chou, Mar. Chem., 2006, 98, 131–139 CrossRef CAS.
- X. Shi and S. Mao, Chem. Geol., 2017, 463, 12–28 CrossRef CAS.
- J. Lahann, S. Mitragotri, T.-N. Tran, H. Kaido, J. Sundaram, I. S. Choi, S. Hoffer, G. A. Somorjai and R. Langer, Science, 2003, 299, 371–374 CrossRef CAS PubMed.
- A. Lendlein, H. Jiang, O. Jünger and R. Langer, Nature, 2005, 434, 879 CrossRef CAS PubMed.
- Z. Chu, C. A. Dreiss and Y. Feng, Chem. Soc. Rev., 2013, 42, 7174–7203 RSC.
- D. Li, S. Ren, P. Zhang, L. Zhang, Y. Feng and Y. Jing, Chem. Eng. Res. Des., 2017, 120, 113–120 CrossRef CAS.
- Y. Zhang, Z. Chu, C. A. Dreiss, Y. Wang, C. Fei and Y. Feng, Soft Matter, 2013, 9, 6217–6221 RSC.
- J. Yang, Curr. Opin. Colloid Interface Sci., 2002, 7, 276–281 CrossRef CAS.
- M. E. Cates and S. J. Candau, J. Phys.: Condens. Matter, 1990, 2, 6869 CrossRef CAS.
- J.-F. Lutz, J.-M. Lehn, E. Meijer and K. Matyjaszewski, Nat. Rev. Mater., 2016, 1, 16024 CrossRef CAS.
- A. Semenov, Soft Matter, 2014, 10, 9534–9561 RSC.
- S. A. Rogers, M. A. Calabrese and N. J. Wagner, Curr. Opin. Colloid Interface Sci., 2014, 19, 530–535 CrossRef CAS.
- F. Kern, R. Zana and S. J. Candau, Langmuir, 1991, 7, 1344–1351 CrossRef CAS.
- K. Vogtt, H. Jiang, G. Beaucage and M. Weaver, Langmuir, 2017, 33, 1872–1880 CrossRef CAS PubMed.
- Y. Zhang, L. Zhang, Y. Wang, M. Wang, Y. Wang and S. Ren, Chem. Eng. Res. Des., 2015, 94, 624–631 CrossRef CAS.
- J. Guo, Y. Yang, D. Zhang, W. Wu, Z. Yang and L. He, J. Pet. Sci. Eng., 2018, 160, 12–23 CrossRef CAS.
- Y. Zhang, H. Song, D. Li, L. Zhang, C. Yang, X. Li and S. Ren, J. China Univ. Pet., Ed. Nat. Sci., 2013, 37, 119–123 CAS.
- Y. Zhang, L. Zhang, B. Chen, H. Li, Y. Wang and S. Ren, J. Chem. Eng. Chin. Univ., 2014, 28, 535–541 CAS.
- D. Langevin, ChemPhysChem, 2008, 9, 510–522 CrossRef CAS PubMed.
- X. Zheng, A. Worthen, A. Qajar, I. Robert, S. L. Bryant, C. Huh, M. Prodanović and K. P. Johnston, J. Colloid Interface Sci., 2016, 461, 383–395 CrossRef PubMed.
- H. M. Princen and A. D. Kiss, J. Colloid Interface Sci., 1989, 128, 176–187 CrossRef CAS.
| This journal is © The Royal Society of Chemistry 2019 |

