 Open Access Article
Preparation, crystal structure and luminescence properties of a novel single-phase red emitting phosphor CaSr2(PO4)2:Sm3+,Li+†
Yuying Chenab,
Qingfeng Guo *ab,
Libing Liao
 *c,
Mingyue Heab,
Tianshuai Zhouc,
Lefu Mei*c,
Marcin Runowski
 d and
Bin Mae
aSchool of Gemology, China University of Geosciences, Beijing 100083, China. E-mail: qfguo@cugb.edu.cn
bJewelry and Mineral Materials Laboratory of Experimental Teaching Demonstration Center, Beijing, China
cBeijing Key Laboratory of Materials Utilization of Nonmetallic Minerals and Solid Wastes, National Laboratory of Mineral Materials. School of Materials Sciences and Technology, China University of Geosciences, Beijing 100083, China. E-mail: clayl@cugb.edu.cn; mlf@cugb.edu.cn
dAdam Mickiewicz University, Faculty of Chemistry, Department of Rare Earths, Umultowska 89b, 61-614 Poznań, Poland
eQinghai Provincial Key Laboratory of New Light Alloys, Qinghai Provincial Engineering Research Center of High Performance Light Metal Alloys and Forming, Qinghai University, Xining 810016, PR China
First published on 8th February 2019
Abstract
Single-phase CaSr2(PO4)2:Sm3+,Li+ phosphors were prepared via a high-temperature solid-state method under air. The powder X-ray diffraction patterns, scanning electron microscopy images, photoluminescence spectra, and concentration-dependent emission spectra were measured to characterize the as-prepared phosphors and luminescence decay curves. The results showed that the CaSr2(PO4)2:Sm3+,Li+ phosphors exhibited red luminescence, and the emission spectra of the phosphors consisted of four sharp peaks at around 565, 601 (the strongest one), 647 and 707 nm. The optimum doping concentration of Sm3+ ions was 0.09 (mol concentration), and the mechanism of energy transfer among Sm3+ ions was defined to be quadrupole–quadrupole (q–q) interactions using Dexter's theory. The Blasse concentration quenching method was used to determine the critical distance Rc for energy transfer among Sm3+ as 10.99 Å. The results indicate that the as-prepared phosphors have good thermal stability with an activation energy of 0.773 eV via temperature-dependent emission spectra. Therefore, CaSr2−2x(PO4)2:xSm3+,xLi+ materials can be used as red-emitting phosphors for UV-pumped white-light emitting diodes.
1. Introduction
High efficiency, long-life and non-polluting light sources are urgently needed.1,2 In contrast to traditional lighting sources, white light emitting diodes (w-LEDs) offer high energy conversion efficiency, small volume, low starting voltage, long durability and good color rendering.3–5 Phosphors are an important component of LEDs, but have a poor color rendering index when used in w-LEDs. Multi-phosphor mixing usually results in color imbalance and instability at higher temperatures, effectively limiting their applications. Therefore, new high efficiency phosphor systems are needed to improve the luminous efficiency of LEDs—especially those excited by near ultraviolet or blue chips. Lanthanides have transitions between 5d → 4f and 4f → 4f, leading to tunable multicolor luminescence in the UV-Vis-NIR range, long radiative lifetimes, and narrow absorption and emission bands; thus, lanthanides are very important in the display and lighting fields.6–8 Red or orange-red emitting phosphors can be prepared via appropriate doping of the selected materials with lanthanide ions, i.e. Eu3+ or Sm3+. Compared with Eu3+-doped materials, Sm3+-doped phosphors can be easily excited in the blue region, which is useful for excitation in the near-ultraviolet (n-UV) InGaN-based LED chip (350–420 nm).9 Moreover, the use of Sm3+ ions is much more cost-effective than very expensive Eu3+ ions.Whitlockite has a chemical formula M3(PO4)2 (M = Ca, Sr, Ba) and has been investigated as a potential host for luminescent materials.10–12 CaSr2(PO4)2 belongs to whitlockite, and it can be a suitable host, for phosphors due to its excellent luminescence properties.13 However, research into the luminescence properties and structure characteristics of Sm3+ doped CaSr2(PO4)2 is rare. Here, a novel Sm3+ doped CaSr2(PO4)2 phosphor was prepared for the first time, and its luminescence and crystal structures were investigated in detail.
Here, a series of the CaSr2−2x(PO4)2:xSm3+,xLi+ phosphors were synthesized by a high-temperature solid-state reaction method in air atmosphere, for the first time. The samples were characterized by X-ray diffraction (XRD), scanning electron microscopy (SEM), photoluminescence excitation (PLE) and emission (PL) spectra, and decay curves. The XRD pattern of the CaSr2(PO4)2 phase is similar to whitlockite mineral, which crystallizes in the space group R3c. In addition, the as-prepared phosphors have good thermal stability via temperature-dependent emission spectra. The results indicate, that the as-prepared CaSr2(PO4)2:Sm3+,Li+ phosphor can act as a UV convertible, red phosphor for w-LEDs.
2. Experimental section
2.1. Materials and synthesis
The CaSr2−2x(PO4)2:xSm3+,xLi+ (x = 0–0.3) powder samples were synthesized via high temperature solid-state method. The starting materials, CaCO3 (99.9%), SrCO3 (99.9%), Li2CO3 (99.9%), (NH4)2HPO4 (99.9%), and Sm2O3 (99.999%) were purchased from Aldrich. First, according to the stoichiometric ratios, these starting materials were mixed and thoroughly ground in an agate mortar. The pre-sintered samples were then evenly transferred to a tube furnace at 800 °C for 1 h of decomposition of the calcium carbonate and strontium carbonate in air. Finally, the as-prepared powders were calcined at 1250 °C for 5 h in air atmosphere, and the furnace was cooled down to room temperature before their removal.2.2. Characterization
A series of the obtained CaSr2−2x(PO4)2:xSm3+,xLi+ phosphors were measured by XRD analysis (XD-3, PGENERAL, China) in the 2θ range of 10° to 70°, with Cu Kα radiation (λ = 0.15406 nm) operating at 40 kV and 40 mA. The step scanning rate (2θ values ranging from 5° to 120°) used for Rietveld analysis was 1 s per step with a step size of 0.02°. The PL and PLE spectra of the phosphors were measured on a F-4600 spectrofluorometer (HITACHI, Japan) with a photomultiplier tube operating at 500 V, and a 150 W Xe lamp used as an excitation source. A 400 nm cut-off filter was used to eliminate the second-order emission. The temperature-dependent PL spectra were also measured on the same spectrofluorometer with a home-made heating controller. The CaSr2(PO4)2 were observed by SEM using a HitachiS-520 instrument. The X-ray photoelectron spectroscopy (XPS, ESCALab250, Thermo Scientific, America) with monochromatic 150 W Al Kα radiation was used to detect Sm3+. The room-temperature luminescence decay curves were recorded with a spectrofluorometer (Horiba, JobinYvon TBXPS), using a tunable pulse laser radiation as the excitation source.3. Results and discussion
3.1. Crystal structure
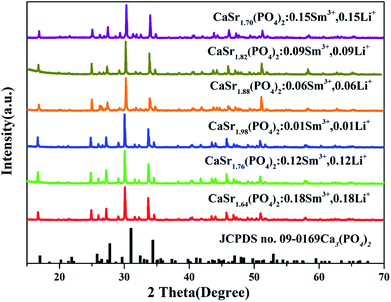
The valence charge is imbalanced when Mn+ ions were substituted by M(n+1). This is undesirable for the phosphor materials and decreases the luminescence intensity. To avoid the charge unbalance and the formation of vacancy in the sample, the Li+ ions were employed as charge compensators and added along with the Sm3+ ions. The mechanism of charge compensation is that two Sr2+ ions are replaced by one Sm3+ ion and one Li+ ion. Therefore, the crystallinity of CaSr2(PO4)2:Sm3+,Li+ improves because the doping with Li+ lowers the crystallization temperature. The XRD patterns of the synthesized CaSr2−2x(PO4)2:xSm3+,xLi+ (x = 0.01, 0.06, 0.09, 0.12, 0.15, and 0.18) are shown in Fig. 1. The XRD patterns of the synthesized CaSr2−1.5x(PO4)2:xSm3+, (x = 0.01, 0.03, 0.05, 0.07, 0.09, 0.12, 0.15 and 0.18) and CaSr2(PO4)2 are shown in Fig. 2. The introduction of Li+ did not have any significant influence on the structure of the as-prepared samples. All XRD patterns can be well fitted with the standard patterns of the Ca3(PO4)2 (JCPDS no. 09-0169) belonging to the trigonal crystal system, with a space group of R3c (161). This suggests that all samples are crystallized in the single phase. All diffraction peaks shifted to the smaller 2θ angle side (bigger d-spacing, i.e., interplanar distances), which can be ascribed to the substitution of Ca2+ by bigger Sr2+. The Sm3+ and Li+ ions have been successfully embedded into the crystal lattice-the Sm3+ and Li+ dopant ions have no obvious influence on the structure of the host CaSr2(PO4)2 at various doping amounts. In order to further detect the phase purity of the phosphors, the CaSr1.82Sm0.09Li0.09(PO4)2 was selected for refinements. Fig. S1† shows the Rietveld refinement of CaSr1.82Sm0.09Li0.09(PO4)2 by TOPAS program. Solid red lines are calculated intensities, and blue circles are the observed intensities. Short orange vertical lines show the position of Bragg reflections of the calculated pattern. Green solid lines below the profiles stand for the difference between the observed and the calculated intensities. Refinement was stable and gives low R-factors (Table S1 and Fig. S1†). All the experimental peaks were well fitted by the refinement, indicating that all those peaks are Bragg reflections from the whitlockite structure. The lattice parameters of the phosphor are determined to be a = b = 10.5918(11) Å, c = 38.835(4) Å and V = 3773.06(55) Å3, respectively. The lattice parameters of the phosphor were a little different from Ca3(PO4)2, which was caused by the isomorphic substitution. The refined atomic positions and isotropic temperature factors for all atoms are also shown in Table S2.†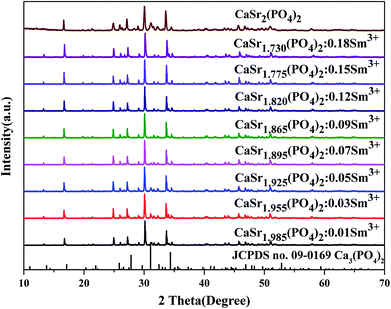 | ||
| Fig. 2 The XRD patterns of CaSr2−2x(PO4)2:xSm3+ phosphors (x = 0, 0.01, 0.03, 0.05, 0.07, 0.09, 0.12, 0.15 and 0.18) and the standard pattern of Ca3(PO4)2 (JCPDS no. 09-0169) is shown as a reference. | ||
Fig. 3 shows the crystal structure of CaSr2(PO4)2 and different coordination environment for Ca/Sr atoms. The crystal structure of the CaSr2(PO4)2 is a result of the lattice deformation of Ca3(PO4)2, via partial substitution of Ca2+ with Sr2+. In the crystal structure of the CaSr2(PO4)2, the Ca2+/Sr2+ ions are distributed between five crystallographic sites—all of these are occupied by both Ca2+ and Sr2+ ions in different ways. The Sr1/Ca1, Sr2/Ca2, Sr3/Ca3, Sr4/Ca4 and Sr5/Ca5 positions are coordinated with six, six, seven, three and six oxygen atoms, respectively.14 Of note, the Ca4 is threefold coordinated, suggesting weak bonding and the formation of crystal defects.
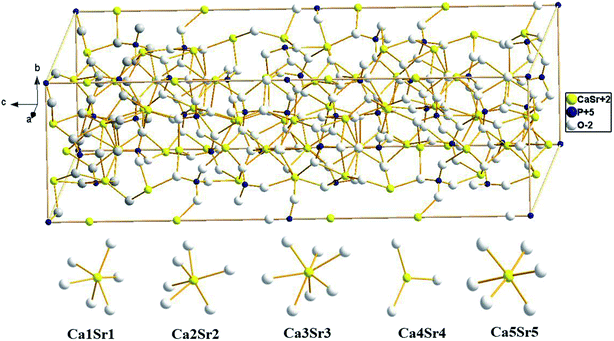 | ||
| Fig. 3 Crystal structure of the host CaSr2(PO4)2 compound, showing different coordination environment for Ca/Sr atoms. | ||
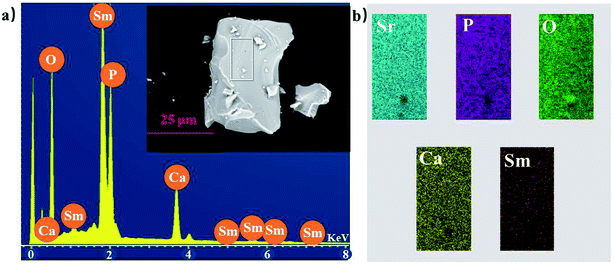
To investigate the composition and morphology of the material, the CaSr1.82(PO4)2:0.09Sm3+,0.09Li+ phosphor was selected as a representative example for measurements. Fig. 4(a) displays the elemental analysis result of the sample measured by the EDS method, within the red rectangle area; the inset shows SEM images of the CaSr1.82(PO4)2:0.09Sm3+,0.09Li+ sample with elemental mapping of CaSr1.82(PO4)2:0.09Sm3+,0.09Li+ phosphor provided in Fig. 4(b). The EDS results indicate that the synthesized phosphor is composed of Ca, Sr, P, O, and Sm, which is consistent with the composition of CaSr1.82(PO4)2:0.09Sm3+,0.09Li+ material. The SEM image reveals that the as-prepared samples are well-crystallized. The sample consists of irregular crystal sizes (≈1000–2000 nm).
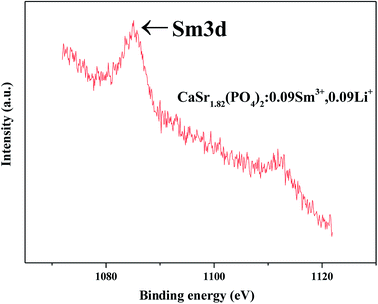
The Sm 3d core level X-ray photoelectron spectra (XPS) of CaSr1.82(PO4)2:0.09Sm3+,0.09Li+ were measured to confirm the existence of Sm3+, as shown in Fig. 5. These data indicate the existence of trivalent oxidation states of Sm on the sample's surface. Only Sm3+ can be found; no peaks of Sm2+ can be seen. The XPS results are consistent with the EDS results.
3.2. Photoluminescence properties
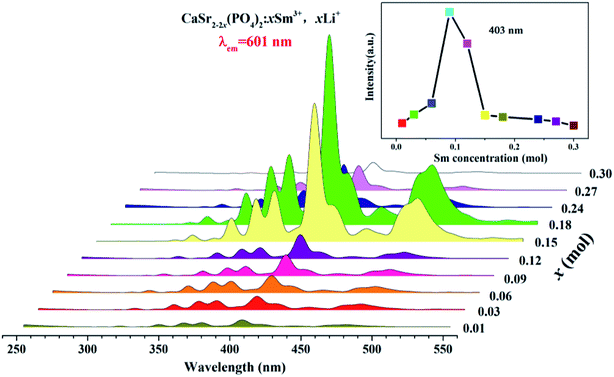
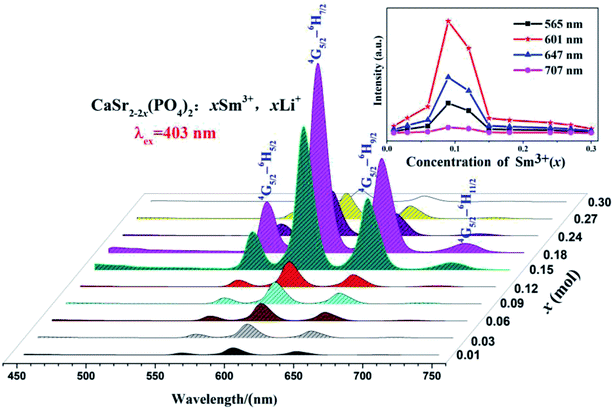
Fig. 6 shows the PLE spectra of the CaSr2−2x(PO4)2:xSm3+,xLi+ (x = 0.01–0.3) phosphors monitored at 601 nm and room temperature. All PLE spectra have strong and narrow absorption bands ranging from 250 to 550 nm in the UV and visible range. These are ascribed to the intrinsic 4f5–4f5 transitions of Sm3+ ions.15 The observed peaks around 305, 318, 333, 345, 375, 391, 403, 416, 440, 466 and 477 nm, correspond to the transitions from the ground level 6H5/2 to the excited levels 4P5/2, 4P3/2, 4G7/2, 4D7/2, 6P7/2, 2L15/2, 4F7/2, 6P5/2, 4M17/2, 4H13/2, and 4I11/2 of Sm3+, respectively.16–18 The most intense band in the PLE spectra is located at 403 nm, in the near-UV region.Fig. 7 depicts the PL spectra of the CaSr2−2x(PO4)2:xSm3+,xLi+ (x = 0.01–0.3) phosphors measured at room temperature excited at 403 nm (6H5/2 → 4F7/2); the inset shows the dependence of the emission intensity at 707, 647, 601, and 565 nm on the Sm3+ doping concentration.
All PL spectra exhibit similar profiles with four emission peaks typical of Sm3+, associated with 4G5/2 → 6HJ (J = 5/2, 7/2, 9/2, 11/2) transitions in Sm3+ ions.19,20 The inset in Fig. 7 shows the dependence of emission intensity on the Sm3+ doping concentration at 565, 601, 647, and 707 nm corresponding to the electronic transitions of 4G5/2 → 6H5/2, 4G5/2 → 6H7/2, 4G5/2 → 6H9/2, and 4G5/2 → 6H11/2, respectively.15 In addition, the 4G5/2 → 6H7/2 transition (at 601 nm) is the strongest one. There are no significant variations in the emission band positions or shape in any phosphor. The inset of Fig. 7 shows that the emission intensities at 565, 601, 647, and 707 nm increase with the concentration of Sm3+ ions. They then reach a maximum when the concentration of Sm3+ is 0.09. Finally, they decrease with further increases in Sm3+ content which corresponds to the concentration quenching effect.21 The quantum efficiency of the CaSr1.82(PO4)2:0.09Sm3+,0.09Li+ phosphor is 9.23%.
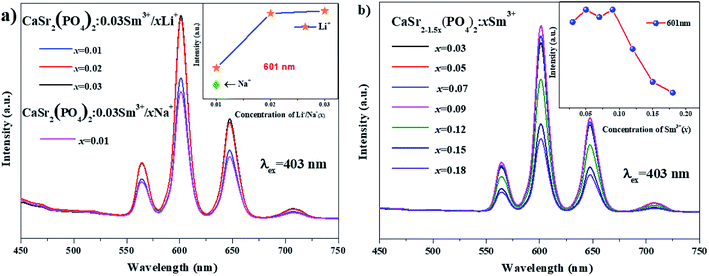
Fig. 8(a) shows the emission spectra of CaSr2(PO4)2:0.03Sm3+,xLi+ (x = 0.01, 0.02 and 0.03) phosphors and the emission spectra of CaSr2(PO4)2:0.03Sm3+,xNa+(x = 0.01) under 403 nm excitation. The emission spectra of CaSr2(PO4)2:0.03Sm3+,Li+/Na+ samples include some peaks centered at 565, 601, 647 and 707 which are similar to those mentioned in Fig. 7. The inset shows the dependence of the emission intensity at 601 nm on the Li+/Na+ doping concentration. This indicates that Li+ enhances the luminescent intensity of phosphors and is more effective than Na+. Fig. 8(b) illustrates the emission spectra of CaSr2−1.5x(PO4)2:xSm3+, (x = 0.03–0.18) phosphors, and the inset shows the dependence of the emission intensity at 601 nm on the Sm3+ doping concentration. We see that the luminescence trend of the phosphor at 601 nm is similar to that shown in Fig. 7. The luminescence increases with increasing concentration of Li+ ions. The maximum luminescence intensity is achieved at 3% Li+ doping content. The phosphors need to produce ion defects to maintain the charge balance because the replacement of Sr2+ with Sm3+ is not equal. However, too many defects produce crystal lattice distortions that reduce the luminescence intensity. The excess positive charge from Li+ ions can be compensated by ion defects according to the following formula: 2Sr2+ = Sm3+ + Li+. This enhances luminescence intensity. There is also an effect on the change in asymmetry. It is reasonable to assume that the Li+ doping changed the local environment of crystal field reducing the local environment symmetry, which in turn enhanced the emission intensity.
3.3. Energy transfer mechanism
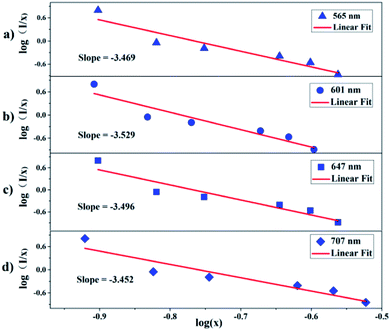
It is well-known that the decrease in the photoluminescence intensity is mainly due to the concentration quenching of Sm3+ ions, which is usually caused by the cross-relaxation energy transfer between Sm3+ ions.22 The critical distance Rc for the energy transfer between Sm3+ ions can be estimated using the following equation proposed by Blasse:23
 | (1) |
 | (2) |
3.4. Temperature-dependent luminescent properties
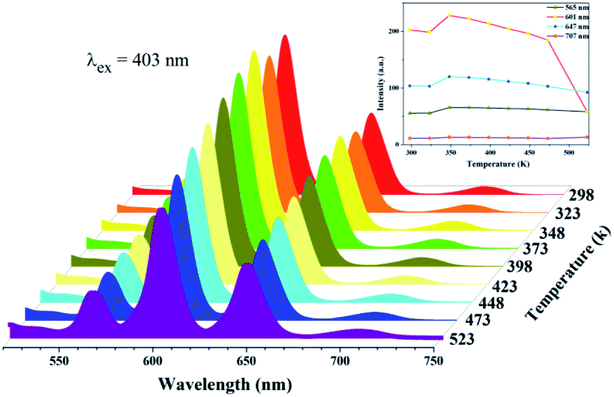
The thermal stability of the phosphor is a key issue for high-power w-LEDs because the luminescence intensity for most phosphors decreases if the operating temperature exceeds a certain value, i.e., temperature quenching.27 Fig. 10 shows the temperature-dependent emission spectra of the CaSr1.82(PO4)2:0.09Sm3+,0.09Li+ phosphor from 298 to 523 K with 403 nm excitation; the inset shows the relative emission intensities at 565, 601, 647, and 707 nm as a function of temperature. The shape of the emission bands remains nearly constant with increasing temperature (Fig. 10) suggesting that the phosphor has excellent color stability, which is crucial in LEDs or high temperature LEDs. However, with increasing temperature (from 300 to 350 K), the emission peaks centered at 565, 601, 647, and 707 nm first slightly increase. These emission intensities decrease gradually when the temperature exceeds 350 K. In contract to typical luminescence thermal quenching where the emission intensity decreases with increasing temperature, the emission characteristics of the obtained Sm3+-doped phosphors exhibit abnormal thermal quenching in the temperature range of 300–350 K (λex = 403 nm). This abnormal thermal quenching phenomenon has also been found previously in the literature.28 We assume that the energy transfer or temperature dependence of absorption coefficient might lead to this abnormal thermal quenching. When the temperature is higher than 350 K, the decrease in PL intensities is due to the temperature-dependence of the electron–phonon interactions in both the ground and excited states of the luminescence center. The emission intensity of the CaSr1.82(PO4)2:0.09Sm3+,0.09Li+ phosphor at 384 K was 76.9% of baseline at 298 K, revealing that the CaSr1.82(PO4)2:0.09Sm3+,0.09Li+ phosphors have good thermal stability. None of the samples had a temperature-induced shift in emission, which confirms the stable chromaticity coordinates of CaSr1.82(PO4)2:0.09Sm3+,0.09Li+ phosphors.3.5. Luminescence decay curves and chromaticity coordinates
Fig. 11 shows the decay curves of Sm3+ emission for CaSr2−2x(PO4)2:xSm3+,xLi+ (x = 0.01, 0.06, 0.12 and 0.18) samples excited at 403 nm and monitored at 601 nm. All decay curves can be well fitted to a bi-exponential decay equation as follows:29,30
I(t) = A1![[thin space (1/6-em)]](https://www.rsc.org/images/entities/char_2009.gif) exp(−t/τ1) + A2 exp(−t/τ1) + A2![[thin space (1/6-em)]](https://www.rsc.org/images/entities/char_2009.gif) exp(−t/τ2), exp(−t/τ2),
| (3) |
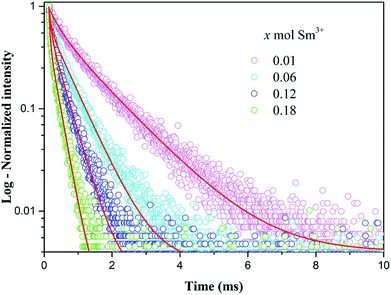 | ||
| Fig. 11 Decay curves of Sm3+ emission in CaSr2−2x(PO4)2:xSm3+,xLi+ (x = 0.01, 0.06, 0.12 and 0.18) phosphors, measured at room temperature, under excitation at 403 nm and monitored at 601 nm. | ||
| x | τ1 (ms) | A1 (%) | τ2 (ms) | A2 (%) | τaverage (ms) | R2 |
|---|---|---|---|---|---|---|
| 0.01 | 1.25 | 65.7 | 0.33 | 34.3 | 1.14 | 0.995 |
| 0.06 | 0.59 | 60.7 | 0.07 | 39.3 | 0.55 | 0.996 |
| 0.12 | 0.37 | 50.4 | 0.05 | 49.6 | 0.33 | 0.994 |
| 0.18 | 0.23 | 22.2 | 0.03 | 77.8 | 0.17 | 0.993 |
The chromaticity diagram and Commission International de I'Eclairage (CIE) coordinates are very important because they indicate the exact emission color and color purity of the sample.31 The CIE chromaticity coordinates and the digital image of the CaSr1.82(PO4)2:0.09Sm3+,0.09Li+ phosphor excited at 403 nm are presented in Fig. 12. The CIE chromaticity coordinates (x, y) of the phosphor were calculated to be (0.5668, 0.3904). They are located in the red region, which is consistent with the observed emission color of the phosphor under 403 nm excitation. Therefore, the CaSr2−2x(PO4)2:xSm3+,xLi+ material can be used as a red phosphor for w-LEDs in solid-state lighting applications.
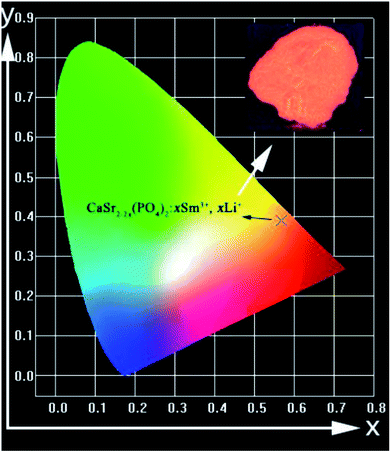 | ||
| Fig. 12 Color coordinates for CaSr1.82(PO4)2:0.09Sm3+,0.09Li+ material, in the CIE chromaticity diagram; the inset shows a digital photograph of the red-emitting phosphor excited at 403 nm. | ||
4. Conclusions
In summary, a series of CaSr2−2x(PO4)2:xSm3+,xLi+ phosphors were prepared for the first time by a conventional solid-state reaction. The phase structure, luminescence properties, thermal quenching, and emission decay curves were investigated. XRD patterns showed that the phosphor can be indexed to hexagonal apatite structure according to the results of crystal structure refinement. Under 403 nm excitation, the CaSr2−2x(PO4)2:xSm3+,xLi+ phosphors showed four emission bands centered at 565, 601, 647, and 707 nm. The excitation spectra showed narrow excitation bands from 250 to 550 nm with a maximum at 403 nm. This means that the phosphor can be effectively excited by UV chips for potential applications in w-LEDs. The optimum dopant concentration of Sm3+ ions is 0.09. Furthermore, the quenching mechanism between the Sm3+ ions was recognized as quadrupole–quadrupole (q–q) interactions. The dependence of the emission spectra on temperature indicated that the phosphor has a good thermal stability in both emission color and intensity. The CIE chromaticity coordinates of the selected CaSr2−2x(PO4)2:xSm3+,xLi+ sample were calculated to be (0.5668, 0.3904); they are located in the red-light region. These results indicated that CaSr2−2x(PO4)2:xSm3+,xLi+ phosphors have good potential for use as red-emitting luminophores for phosphor-converted w-LEDs.Conflicts of interest
There are no conflicts to declare.Acknowledgements
The present work is supported by the National Natural Science Foundation of China (Grant No. 41802040). Yuying Chen also thanks to the College Student Research Innovation Program of China University of Geosciences, Beijing.References
- Q. F. Guo, Q. D. Wang, L. W. Jiang, L. B. Liao, H. K. Liu and M. F. Mei, Phys. Chem. Chem. Phys., 2016, 118, 15545–15554 RSC.
- X. X. Ma, L. B. Liao, Q. F. Guo, H. K. Liu, T. S. Zhou and L. F. Mei, RSC Adv., 2018, 8, 27332–27341 RSC.
- Y. L. Zhu, Y. J. Liang, M. F. Zhang, M. H. Tong, G. G. Li and S. Wang, RSC Adv., 2015, 5, 98350–98360 RSC.
- H. K. Liu, L. B. Liao, Q. F. Guo, D. Yang and L. F. Mei, J. Lumin., 2017, 181, 407–410 CrossRef CAS.
- M. F. Zhang, Y. J. Liang, R. Tang, D. Y. Yu, M. H. Tong, Q. Wang, Y. L. Zhu, X. Y. Wu and G. G. Li, RSC Adv., 2014, 4, 40626–40637 RSC.
- G. G. Li, Y. Zhao, Y. Wei, Y. Tian, Z. W. Quan and J. Lin, Chem. Commun., 2016, 52, 3376–3379 RSC.
- A. Shyichuk, R. T. Moura Jr, A. N. C. Neto, M. Runowski, M. Zarad, A. Szczeszak, S. Lis and O. L. Malta, J. Phys. Chem. C, 2016, 120, 28497–28508 CrossRef CAS.
- M. Runowski, J. j. Marciniak, T. Grzyb, D. Przybylska, A. Shyichuk, B. Barszcz, A. Katrusiak, S. Lis, A. Katrusiak and S. Lis, Nanoscale, 2017, 9, 16030–16037 RSC.
- M. Runowski, S. Goderski, J. Paczesny, M. Księżopolska-Gocalska, A. Ekner-Grzyb, T. Grzyb, J. D. Rybka, M. Giersig and S. Lis, J. Phys. Chem. C, 2016, 120, 23788–23798 CrossRef CAS.
- W. J. Tang and Z. Zhang, J. Mater. Chem. C, 2015, 3, 5339–5346 RSC.
- K. Li, D. L. Geng, M. M. Shang, Y. Zhang, H. Z. Lian and J. Lin, J. Phys. Chem. C, 2014, 118, 11026–11034 CrossRef CAS.
- H. Ji, Z. Huang, Z. Xia, M. S. Molokeev, V. V. Atuchin and S. Huang, Inorg. Chem., 2014, 53, 11119–11124 CrossRef CAS PubMed.
- J. Zhang, J. M. Jia and Z. H. Hua, Mater. Des., 2015, 87, 124–129 CrossRef CAS.
- H. P. Ji, Z. H. Huang, Z. G. Xia, M. S. Molokeev, V. V. Atuchin, M. H. Fang and S. F. Huang, Inorg. Chem., 2014, 53, 5129–5135 CrossRef CAS PubMed.
- H. Ye, M. Y. He, T. S. Zhou, Q. F. Guo, J. L. Zhang, L. B. Liao, L. F. Mei, H. K. Liu and M. Runowski, J. Alloys Compd., 2018, 757, 79–86 CrossRef CAS.
- B. Ma, X. Q. Ma, T. H. Xu, K. Su and Q. X. Zhang, RSC Adv., 2018, 8, 14164–14169 RSC.
- Q. F. Guo, C. L. Zhao, L. B. Liao, S. Lis, H. K. Liu, L. F. Mei and Z. Q. Jiang, J. Am. Ceram. Soc., 2017, 100, 1–11 CrossRef.
- L. Li, X. H. Tang, Z. Q. Jiang, X. J. Zhou, S. Jiang, X. B. Luo, G. T. Xiang and K. N. Zhou, J. Alloys Compd., 2017, 701, 515–523 CrossRef CAS.
- T. S. Zhou, L. F. Mei, Y. Y. Zhang, L. B. Liao, H. K. Liu and Q. F. Guo, Opt. Laser Technol., 2019, 111, 191–195 CrossRef CAS.
- X. Y. Huang and H. Guo, Ceram. Int., 2018, 44, 10340–10344 CrossRef CAS.
- R. Yu, H. Mi Noh, B. Kee Moon, B. Chun Choi, J. Hyun Jeong, H. Sueb Lee, K. Jang and S. Soo Yi, J. Lumin., 2014, 152, 133–137 CrossRef CAS.
- Y. Zhang, B. Ding, L. Yin, J. Xin, R. Zhao, S. Zheng and X. Yan, Inorg. Chem., 2018, 57, 507–518 CrossRef CAS PubMed.
- G. Blasse, Philips Res. Rep., 1969, 24, 131–144 CAS.
- D. L. Dexter and J. H. Schulman, J. Chem. Phys., 1954, 22, 1063–1070 CrossRef CAS.
- L. G. Van Uitert, J. Electrochem. Soc., 1967, 114, 1048–1053 CrossRef CAS.
- J. Xu, Z. H. Ju, X. P. Gao, Y. Q. An, X. L. Tang and W. S. Liu, Inorg. Chem., 2013, 52, 13875–13881 CrossRef CAS PubMed.
- T. Takeda, N. Hirosaki, S. Funahshi and R. Xie, Chem. Mater., 2015, 27, 5892–5898 CrossRef CAS.
- J. J. Chen, Y. Zhao, Z. Y. Mao, D. J. Wang and L. J. Bie, J. Lumin., 2017, 186, 72–76 CrossRef CAS.
- C. H. Huang and T. M. Chen, J. Phys. Chem. C, 2011, 115, 2349–2355 CrossRef CAS.
- R. Vijayakumar, H. Guo and X. Y. Huang, Dyes Pigm., 2018, 156, 8–16 CrossRef CAS.
- J. S. Kumar, K. Pavani, A. M. Babu, N. K. Giri, S. B. Rai and L. R. Moorthy, J. Lumin., 2010, 130, 1916–1923 CrossRef CAS.
Footnote |
| † Electronic supplementary information (ESI) available. See DOI: 10.1039/c9ra00264b |
| This journal is © The Royal Society of Chemistry 2019 |

