 Open Access Article
Self-assembly of L-phenylalanine amino acid: electrostatic induced hindrance of fibril formation†
Deepak Tomara,
Shilpi Chaudharya and
Kailash Chandra Jena *ab
*ab
aDepartment of Physics, Indian Institute of Technology Ropar, Rupnagar, Punjab-140001, India. E-mail: kcjena@iitrpr.ac.in; Tel: +91-1881-242166
bCenter for Biomedical Engineering, Indian Institute of Technology Ropar, Rupnagar, Punjab-140001, India
First published on 23rd April 2019
Abstract
Nanostructure morphology originating from the self-assembly of molecules has attracted substantial attention due to its role in toxic amyloid fibril formation and immense potential in the design and fabrication of novel biomaterials. This study presents the role of intermolecular electrostatic interaction on the self-assembly process of L-phenylalanine (L-Phe) amino acid. We have employed attenuated total reflection Fourier transform infrared spectroscopy to probe the existence of different ionization states of the amino acid in various pH aqueous solutions. The self-assembly process of L-Phe in the aqueous phase is explored by using circular dichroism absorption and nuclear magnetic resonance spectroscopic tools. The observed spectral features have shown the signature of higher order structures and possible perturbation in the π–π stacking aromatic interactions for the cationic and anionic states of the amino acid. Scanning electron microscopy is used to probe the self-assembled morphology of the L-Phe amino acid dried samples prepared from the same pH aqueous solutions. We find that for the case of zwitterionic states the self-assembly nanostructures are dominated by the presence of fibrillar morphology, however interestingly for cationic and anionic states the morphology is dominated by the presence of flakes. Our finding demonstrates the potential influence of intermolecular electrostatic interaction over the aromatic π–π stacking interaction in hindering the fibril formation.
Introduction
Amino acids are the basic building units for many complex macromolecules like peptides and proteins. They play an important role in many metabolic processes like creation and growth of new tissues and synthesis of enzymes and hormones inside the human body.1 The self-assembly of amino acids, peptides and proteins is responsible for many degenerative diseases.2–5 For example phenylketonuria (PKU) is a metabolic disorder disease known to be caused by the elevation in concentration and self-assembly of L-phenylalanine (L-Phe) amino acid in the blood.2,6–8 The elevation in the concentration of L-Phe originates from the malfunction in the gene encoding phenylalanine hydroxylase enzyme which converts L-Phe to tyrosine amino acid. However, from the last decade, nanostructure morphology originating from self-assembly of amino acids and peptides has attracted substantial attention towards the design and fabrication of various precise nanoscale templates for bionanotechnological applications.9–16 Even though significant advances have been made towards the study of self-assembly of molecules, the role of intermolecular interactions in the bottom-up process is still to be explored. The self-assembly mechanism is governed by specific noncovalent intermolecular interactions that are facilitated by various interactions such as hydrophobic, aromatic π–π stacking, electrostatic, van der Waals, and hydrogen bonding.2,17–22 These interactions play a key role in the formation of various nanoscopic physical morphologies, for which it is necessary to gain better understanding about these interactions and their role during the bottom-up self-assembly process.Recently, L-Phe amino acid has shown the potential of producing toxic fibrillar aggregation with amyloid-like morphology.2 The first evidence that a single amino acid can accumulate to form fiber like aggregation with amyloid structure at pathological concentration was reported by Alder et al.2 The authors showcased the ability of a single aromatic L-Phe amino acid to form nanofibrillar assembly with toxic activities. The favorable interaction between the hydrophobic exterior of the fibril and the cell membrane can lead to cellular damage.23 The permeability of membrane is crucial for various cellular activities, recently Perkin and Viada have provided valuable insight that L-Phe has the ability to alter the permeability of the model bilayered phospholipid vesicles.24 Theoretically, it is also established that L-Phe forms amyloid-like aggregation at zwitterionic state.25 The addition of D-phenylalanine (D-Phe) an enantiomer of L-Phe in equimolar concentration has shown the prospective to arrest the formation of fibrillar morphology.26 The nanoscale morphology based on the association of small building blocks particularly peptides having aromatic groups have shown immense potential towards numerous technological applications.10,12,27–29 Due to the dominance of π–π stacking interaction, the aromatic based dipeptides have shown higher specific propensity to form aggregative structure than that of aliphatic dipeptides.30
The structure of L-Phe amino acid has a unique advantage due to the presence of two different hydrophilic groups, carboxylic acid (COOH) and amine base (NH2) for which it can be tuned to different ionization states by simply varying pH of the aqueous solution. Depending upon the condition of ionic environment, the polar groups can undergo deprotonation and protonation processes. In recent studies by sum frequency generation (SFG) vibrational spectroscopy, attenuated total reflection Fourier transform infrared (ATR-FTIR) and infrared reflection-absorption spectroscopic (IRRAS) tools, it is observed that the ionization states of amino acids vary significantly for the polar groups laying at the surface in comparison to the species in bulk.31,32 SFG is considered as an intrinsically surface specific spectroscopic tool probes molecules only from the top molecular layers up to a probing depth of ∼1 nm, whereas for the case of ATR and IRRAS the probing depth is around ∼1 μm.33–38 The length scale of probing depth plays an important role in propensity of OH− and H3O+ ions for determining the pH of surface and bulk regions. Recently, it has been established that the L-Phe shows existence of different ionization states for bulk and surface regions.31
The molecular basis for the self-assembly process is quite diverse and it plays a crucial role in the formation of various nanoscopic morphology. A well-documented understanding on the fibril formation and the existence of different ionization states of the L-Phe motivated us to do a careful study to probe the role of electrostatic interaction on the self-assembly process of the amino acid. We have selected pH 1.5 (cationic) and 12.2 (anionic) aqueous environments and three intermediate pH 4.0, 5.8, and 8 (zwitterion) conditions for our present study. We have purposely selected two extreme pH aqueous solutions to acquire absolute cationic and anionic states of the amino acid. In this paper, the roles of various ionization states and concentration effect on the self-assembly process of L-Phe amino acid have been established. The self-assembly process of the amino acid in the aqueous phase was characterized by ATR-FTIR, circular dichroism (CD) and nuclear magnetic resonance (NMR) spectroscopic tools. The self-assembled morphology of the dried L-Phe amino acid samples was probed by scanning electron microscopy (SEM).
Experimental section
The L-Phe amino acids were purchased from Sigma-Aldrich and directly used in preparing the required concentrations by dissolving it in Millipore ultra-purified deionized water (Type 1, resistivity 18.2 MΩ cm, pH = 5.8) at room temperature. The pH values of the aqueous solutions were adjusted from 1.5 to 12.2 by adding diluted HCl/NaOH and measured using a calibrated pH meter (Mettler Toledo S210-Basic).The vibrational spectra of L-Phe amino acids were recorded by performing ATR-FTIR experiments using the Bruker FTIR Tensor II spectrometer. ATRMax-II variable angle horizontal and three reflection diamond ATR accessories (PIKE Technologies) were used to perform the IR absorption experiments. For our ATR-FTIR experiments, we have followed the procedure stated in a recent Nature Protocol by Yang et al. for collecting high quality and reproducible data.39 The spectrometer was allowed to warm up for ∼4 to 6 hours and waited until temperature and humidity of both interferometer and detector to stabilize. The IR absorption spectra were recorded at a spectral resolution of 2 cm−1 and averaged over for 256 signal scans. The liquid samples were probed by using a ZnSe ATR crystal (56 mm × 10 mm × 4 mm) having 7 internal reflections or a diamond ATR crystal having three internal reflections in contact with the liquid sample. Prior to each experiment, the crystals and sample cell were rinsed 5 to 6 times with ethanol and deionized water and later allowed to dry before use.
The SEM experiment was performed to obtain the three-dimensional structures of the self-assembly process of the amino acid by using JEOL Ltd. Japan (JEOL JSM-6610LV). For SEM experiments, each time an amount of ∼50 μL of the aqueous sample solution is dropped on a small piece of carbon tape and dried at 50 °C for 15–20 minutes in oven and further samples were coated with platinum by sputter auto fine coater (JEOL JFC-1600).
The CD absorption spectra were recorded by J-1500 CD spectrometer (JASCO, Japan) equipped with a temperature controlled cell holder. The CD spectra of L-Phe were recorded for pH 1.5, 5.8, and 12.2 of the bulk aqueous solutions at two different molar concentrations of 0.1 mM and 50 mM, respectively. The samples in the aqueous solution were measured in Hellma quartz cell with optical pathlength of 1.0 mm for 0.1 mM L-Phe concentration. In order to keep the value of high tension voltage under the permissible limit, we have used a high precision Hellma quartz cell of having path length 0.1 mm for 50 mM L-Phe concentration. The samples were scanned in the spectral range from 200 to 260 nm with scanning speed of 100 nm min−1 in photometric mode at room temperature.
For 1H solution-state NMR spectroscopy, the aqueous solutions of 50 mM concentration of L-Phe were prepared at three different pH 1.5, 5.8, and 12.2 conditions. 1H NMR spectra were recorded by using JEOL JNM-ECS 400 MHz spectrometer equipped with a dual channel multinuclear auto tuning 5 mm FG/HX resonance probe at an ambient temperature of 18 °C. The integration of peaks was performed with Delta NMR processing and control software by JEOL USA, Inc. Version 4.3.6. We measured changes in the 1H chemical shift for different aqueous solutions of L-Phe and the chemical shifts are expressed in δ relative to tetramethylsilane (TMS, δ = 0 ppm).
We have carried out the thermogravimetric analysis (TGA) experiment to study the thermal stability behavior of self-assembly of L-Phe amino acids at two different pH conditions. The powder samples were prepared by drying the pH 5.8 and 12.2 aqueous solutions of 50 mM L-Phe amino acid concentration. We have used TGA/DSC 1 STARe system from Mettler-Toledo Instrument for performing the TGA study. The powder form of the samples were placed in an aluminium pan and scanned at heating rate of 10 °C per minute under nitrogen (N2) purge. The main purpose of doing this experiment is to see the thermal behavior of fibril and flake structures.
For all the ATR-FTIR spectra, the reference spectrum in our case water is subtracted from sample spectra. The subtracted data was smoothed by 13 number of smoothing points of the Savitzky–Golay algorithm and then baseline correction is performed by using concave rubber band 64 points correction method. It is necessary to treat the raw IR absorption data with the ATR correction factor. There is a change in penetration depth of evanescent wave in sample with respect to the wavelength of radiation which may alter the relative peak heights and positions of the absorption spectrum.40,41 In order to address this problem in the present work we have treated our data with the ATR correction factor and the details of this method are briefly discussed in ESI section.†
Results and discussion
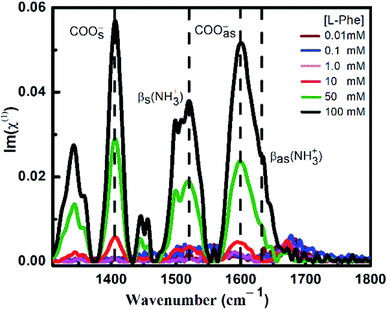
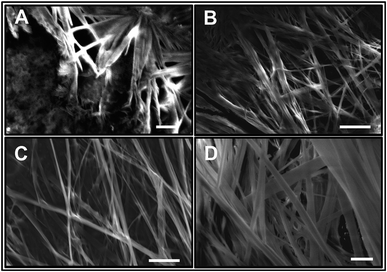
ATR-FTIR spectroscopy is an excellent and a powerful linear vibrational spectroscopic tool to probe the structural composition of moieties present in the bulk up to a probing length in the order of a few micrometer range.32,40,42–46 The details about the mathematical formulation related to ATR correction and penetration depth of evanescent wave are provided in the ESI section and in Fig. S1.† We have employed ATR-FTIR spectroscopy to identify the unique spectral signatures of the ionization states of the amino acid. Fig. 1 displays the IR absorption spectra at pH 5.8 for various bulk concentrations of L-Phe in the spectral range from 1310 to 1800 cm−1. Due to the presence of amine and carboxylic groups, the amino acid acquires zwitterionic form at pH 5.8. For which it is anticipated to observe four major vibrational characteristic features from NH3+ and COO− groups in the IR absorption spectrum.31,43 In present description, we will limit our discussion only to the vibrational features of amine and carboxylic acid functional groups. The appearance and enhancement of the IR absorption intensity of various functional groups are clearly observed with the increase in L-Phe concentration. The increase in the IR absorption intensity may be merely due to the increase in the number of contributing molecule for the IR absorption spectrum in the probing length of interest.The peak positions located at ∼1410 cm−1 and ∼1600 cm−1 are assigned to symmetric COOs− and anti-symmetric COOas− stretching vibration modes of the carboxylate groups. Further, the shoulder located at ∼1519 cm−1 and peak position at ∼1643 cm−1 are assigned to bending symmetric βs(NH3+) and anti-symmetric βas(NH3+) vibration modes of the amino groups. The presence of the above spectral features strongly supports the existence of the zwitterionic state of the amino acid at the neutral pH 5.8. The self-assemble structural characterization of L-Phe was probed by SEM. Fig. 2 shows the SEM images of three dimensional physical structure of the self-assembly behavior of L-Phe as a function of concentration. The dried samples were prepared from the same bulk solutions used for ATR-FTIR studies. It clearly reveals the formation of fibrillar morphology at a very dilute concentration of 0.1 mM to a crowded fibrillar environment at 100 mM concentration.
At zwitterion ionization state of the amino acid, monomers arrange to have hydrophilic groups at the core due to two oppositely charged hydrophilic groups and hydrophobic groups at the outer surface originated from π–π stacking interaction.2,23,47 The combination of the above intermolecular interactions is eventually responsible for the formation of stable fibrillar structure. It is established that the π–π stacking interaction plays a crucial role in the self-association of molecules and stabilization of nanostructured morphology in the self-assembly process of aromatic residue based molecules. Water also play very important role in the self-assembly process of molecules through hydrogen bonding. Solvent mediated transformation between anhydrous and monohydrate form of L-Phe in pure water and acetone–water mixtures at different temperatures has been reported.48
The sample preparation method followed for SEM experiments through heating and evaporation raises concern to capture the true nature of the nanostructured morphology of the self-assembly process. There are a few literatures where some research groups carried out the experiments using flash freeze/drying or cryo-SEM/TEM to capture the physical morphology of the self-assembly processes.49–51 Interestingly, it is found that the observed morphologies from the flash-freeze method have the similar phase transition behavior as observed from the conventional drop-casting evaporation method used for SEM experiments. In contrast, the significant changes for the case of cryo-SEM/TEM are observed in the terms of increase in the density, more ordered and more clear visualization of the self-assembled structures.49
In our present study, we have also taken images of two L-Phe samples prepared by conventional drop casting method using optical microscope (Leica DFC 295) (Fig. S2†). The two samples were dried at two different conditions, one is allowed to dry at room temperature on a microscopic cover slip and the other sample is allowed to dry at 50 °C in the oven for 15 minutes. The second sample was dried with the similar procedure followed for SEM experiments. Interestingly, it is found that both the images are carrying similar fibrillar morphology. In addition, the observed morphology from the optical microscope is quite similar to the pattern observed from the SEM images.49
We have also performed the experiments on DL-Phe by varying the concentration. The respective SEM images for the DL-Phe samples are shown in the supplementary Fig. S3.† The images clearly reveal the formation of flake morphology in contrast to the observed fibrillar structure for L-Phe. Considering the existence of the zwitterion ionization state, we have observed similar spectral features as we have already discussed for the L-Phe from the ATR-FTIR studies. Surprisingly, we did not observe any significant spectral differences for the DL-Phe in terms of peak position shifting or broadening in the spectral response as a signature of flake vs. fibril (shown in Fig. S4 and S5†) reflected in the SEM images. However, we have noticed early appearance of various characteristic vibrational peaks at lower concentrations of DL-Phe which are having higher IR absorbance values in comparison to that of L-Phe.
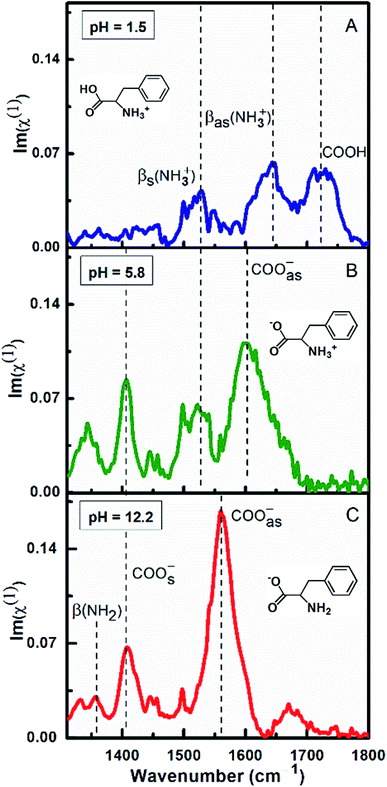
Fig. 3 demonstrates the ATR-absorption spectra of L-Phe at 100 mM concentration at three different pH values (1.5, 5.8, and 12.2) in the spectral range from 1310 to 1800 cm−1. Considering chemical suitability of the ZnSe crystal, the experiments are performed with the diamond ATR crystal for the extreme pH values (1.5 and 12.2). At pH 1.5, due to protonation of the amine group, L-Phe acquires its cationic ionization state. The molecular ionization state and the spectral response of the amino acid are shown in the Fig. 3a. Here the protonated amine vibrations with the unique spectral feature of neutral carboxylic acid (COOH) are more apparent in the spectrum. The peak observed at ∼1720 cm−1 is assigned to the presence of COOH stretching vibrational mode. The peak positions at ∼1560 cm−1 and ∼1643 cm−1 are referred to the protonation states of amine group and are assigned to the bending symmetric βs(NH3+) and anti-symmetric βas(NH3+) vibrational modes, respectively. The absence of the carboxylate stretching modes (COO−) and the appearance of the COOH and other protonated amine vibrations evidently demonstrate the existence of cationic ionization state of L-Phe. The anionic form of the amino acid predominately occurs at the higher pH value of the aqueous solution. At pH 12.2, due to the deprotonation of the carboxylic group, the vibrational features of carboxylate and neutral amine groups (NH2) are expected to be present in the spectrum (Fig. 3c). The peak positions at ∼1410 cm−1 and ∼1560 cm−1 are assigned to COOs− and COOas− stretching modes of the carboxylate groups, respectively. The peak position at ∼1355 cm−1 is assigned to neutral amine bending β(NH2) vibrational mode. There are no significant contributions observed from the bending symmetric βs(NH3+) and anti-symmetric βas(NH3+) vibration modes of the amino groups. However, Fig. 3b shows the similar vibrational features of L-Phe at pH 5.8 which we have already discussed in Fig. 1. Presence of all four characteristic vibrational frequencies infers the existence of the zwitterionic state of the amino acid. From our ATR-IR spectral analysis, it is established that the cationic and anionic state of L-Phe subsists for the pH 1.5 and 12.2 aqueous solutions.
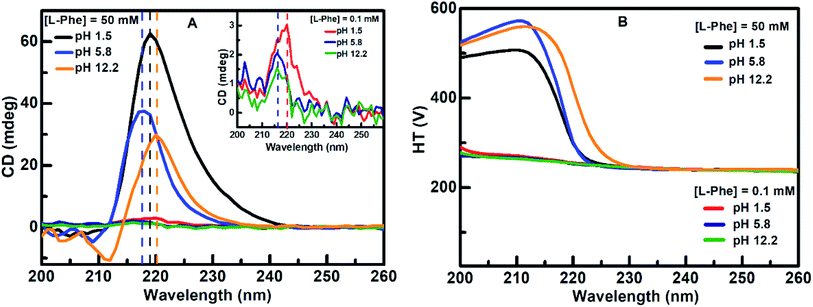
CD absorption spectroscopy is generally used to probe the structural changes in protein molecules and to evaluate various molecular self-aggregation processes in the UV-region.3,14–16,19,30,52–54 We have employed CD spectroscopy to extract better insight about the self-assembly of L-Phe in the solution phase. Fig. 4a displays the CD absorption spectra for L-Phe at three different pH aqueous solutions of two different concentrations, respectively. The observed peak positions are consistent with the previously published reports and the origin of the absorption bands are assigned due to the simple transitions from n–π* (carboxyl group) and π–π* (aromatic stacking).14,54–56 Aromatic stacking interaction plays a significant role in the self-assembly process for phenyl residue based molecules. Any perturbation to the rotational freedom of the aromatic moieties can influence the fate of the final physical shape of the self-assembly nanostructures. At dilute concentration (0.1 mM), weak CD signals were observed centered at around 220 nm (pH 1.5) and 216 nm (pH 5.8 and 12.2), respectively (inset of Fig. 4a). However, with the increase in the L-Phe concentration a significant enhancement in the CD signal is observed for the case of 50 mM (Fig. 4a). The enhancement in the ellipticity values from the observed CD spectrum of the respective L-Phe sample is an indication of the formation of higher order structure. Further, it is also observed that the CD signal is followed by a red shift in the peak position for different pH solutions for higher L-Phe concentration. The changes in the peak position and the increase in the CD signal are the possible signature of the perturbation in the interaction of the aromatic side chains of the phenyl residues.3,14–16,22,53,54
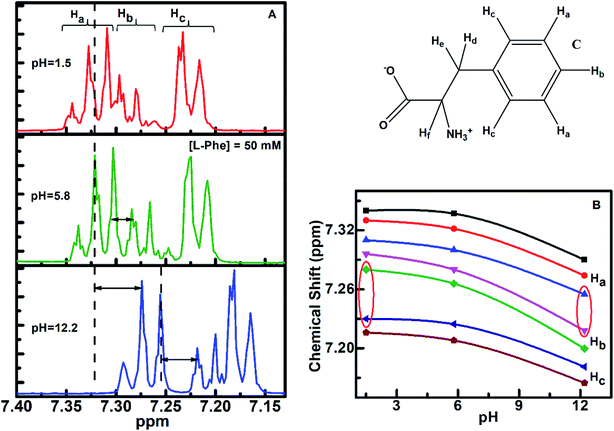
1H NMR is a sensitive spectroscopic tool for probing local environment of the interacting species and their structural changes.57–59 We have carried out 1H NMR experiment to gather more information about the self-assembly behavior of L-Phe at three different pH aqueous conditions. Based on NMR analysis of L-Phe self-assemblies by Alder et al.,2 no indication of covalent bond formation observed between L-Phe monomers. However later by Singh et al.,26 studied concentration dependent 1H NMR of L-Phe and attributed the observed upfield shift to stacking of aromatic rings of L-Phe molecules in self-assembly formation. The chemical structure of L-Phe (zwitterionic form) for NMR data analysis is given in Fig. 5c. Here, we have focused on aromatic proton activities to probe the impact of ionization states of L-Phe on π–π stacking interactions as it plays vital role in self-assembly process. The aromatic ring of L-Phe, has two Ha and two Hc equivalent protons and one Hb proton, respectively. The 1H NMR spectra of L-Phe in the aromatic region at three different pH aqueous environments are shown in Fig. 5a. In the case of pH 5.8, the appearance of aromatic peaks of two Ha equivalent protons are at around 7.29–7.34 ppm, one Hb protons at around 7.24–7.29 ppm, and two Hc equivalent protons are at around 7.19–7.24 ppm. The observed spectral features are quite similar to the reported spectrum in the literature.60 The overall downfield or higher ppm shift observed in 1H NMR peak positions for pH 1.5 and 5.8 are merely from the deshielding effect due to change in the aqueous environment. There are no significant changes observed in the energy difference between the individual peak positions of respective aromatic protons for the three different pH environments (Table S1†). This can be visualized from both the side sections of the Fig. 5b. The difference in chemical shift is quite uniform with the change in the value of pH from 1.5 to 12.2. However, there are significant changes observed in the chemical shift for the aromatic proton Hb with respect to Ha and Hc for both the extreme pH conditions (Fig. 5b, highlighted with the red conic sections). In addition to this, spin–spin fine splitting is also observed in the case of pH 12.2 and 1.5 for the aromatic proton Hc in contrast to pH 5.8. The change in the chemical shift and the observed spin–spin fine splitting for both the extreme pH solutions (pH 1.5 and 12.2), can be attributed to change in the structural arrangement or chemical environment around the aromatic residue and a restricted motion of the aromatic ring of the L-Phe.61–64
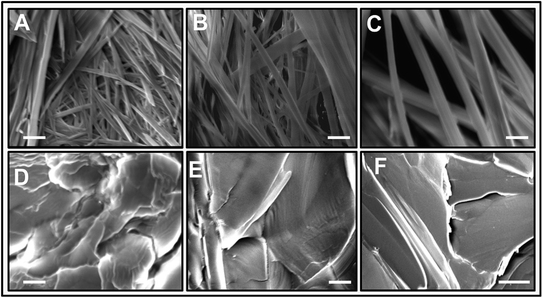
The morphology of L-Phe self-assembly process for various pH environments is assessed by performing SEM. Fig. 6 elucidates the SEM images of the self-assembled morphology of L-Phe amino acid molecules at five different pH values. Depending on pH values, the SEM experimental results demonstrate the existence of different physical morphology of the L-Phe self-assembled process. It is clearly seen from the SEM images that for the zwitterionic states (pH 4, 5.8 and 8), the self-assemble morphology is dominated by the presence of fibrils (Fig. 6a–c). However, panel d and e of Fig. 6 reveal very interesting morphological features for the self-assembly process of L-Phe amino acid. Instead of fibrillar morphology, the SEM images are dominated by the presence of flakes. At high pH 12.2, the L-Phe carries the negative charge due to deprotonation of the polar carboxylic group (COO−) whereas a positive charge due to protonation of the amine group (NH3+) at pH 1.5. From our experimental observation, it clearly indicates that the electrostatic interaction may be playing a key role towards the inhibition of the fibril formation.65 We have also taken into consideration of studying the morphology of the dried solvents. The SEM images of the three different pH dried samples of the solvents without the presence of L-Phe are shown in Fig. S6.† We did not observe any signature of fibrils or flakes formation from the SEM images of the reference dried solvents.
Considering the role of intermolecular interactions in the formation of flakes over fibrils by varying the pH, we have conducted the TGA experiments to study the thermal behavior of both the samples (pH 5.8 and 12.2) in the powder form. Interestingly, it is observed from the TGA plot (Fig. 7) that the thermal behavior of both the samples are quite distinct. The weight as a function of temperature for the L-Phe sample prepared from pH 5.8 (black line) stays quite stable up to a temperature at around 225 °C. However, subsequently the behavior of the plot changed significantly with the weight loss followed with a plateau at around 290 °C. At around 367 °C temperature the weight loss reached a value of 99% with complete weight loss at above 430 °C. The observed weight loss behavior of L-Phe sample as a function of temperature is quite similar to the results reported in the literature.48,66
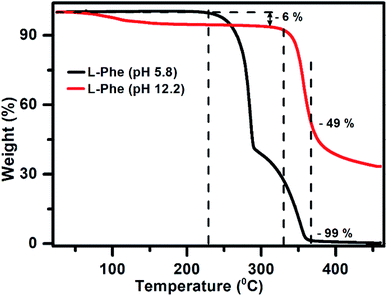 | ||
| Fig. 7 The thermogravimetric analysis plot for powder samples prepared from aqueous solutions of pH 5.8 (black) and pH 12.2 (red) at 50 mM L-Phe concentration, respectively. | ||
Interestingly, the TGA plot for the L-Phe powder sample prepared from pH 12.2 aqueous solution behaves very differently (red line). The initial small weight loss of 6% is observed above 70 °C which is generally attributed towards the evaporation of solvent water molecules trapped in the sample. Similar observations were also observed previously by other research groups in their TGA thermograph.66,67 A significant change in the weight is observed only above 330 °C for the flake sample in comparison to the value of 225 °C noticed for the sample responsible for fibril structure (pH 5.8). In addition, surprisingly the value of weight loss attains only around ∼49% at temperature 367 °C where a significant weight loss was observed for L-Phe sample prepared from pH 5.8. From the above observations, it can be concluded that the thermal stability behavior for both the samples are very different. The finding clearly demonstrates that the intermolecular forces involved in the case of flakes (pH 12.2) are different and makes the structure more stable than the fibril structure observed for pH 5.8.
The final shape of the physical morphology from self-assembly of molecules can be controlled on the basis of intermolecular interactions involved in the self-assembly process. The process is very much influenced by the parameters like nature and concentration of the molecules, pH value of the aqueous solution, preparation condition, and variation of solvents.21,52,68,69 The first nanoscale engineered tubular structure was developed by Ghadiri and coworkers with the concept of alternating D- and L- amino acids.17,70 Peptides with positive and negative moieties were designed to form self-assembled ordered fibrillar structures in the aqueous medium due to the electrostatic interaction between the oppositely charged moieties within the peptides.71–73 Wei and coworkers gave an extensive molecular dynamics simulation study on self-assembly pathway mechanism of diphenylalanine based peptide (FF) towards the formation of nanovesicles and nanotubes by varying the peptide concentration [FF].74 The balance between the peptide–peptide van der Waals and peptide–water interactions play a key role to acquire the final morphology of the self-assembly process. It provides insightful finding about the pathways of diverse nanostructures on account of tweaking various intermolecular interactions.
It is quite evident from the existing literature that the final shape of nanoscopic structural morphology originated from self-assembly process is very much influenced and controlled by the contribution of various intermolecular interactions present in the process. It is established that for the zwitterionic state of L-Phe, the amino acids are self-assembled in such a way that it provides a suitable platform to form fibrillar structure.2,23,26 This has been attributed due to the combined electrostatic attraction between two oppositely charged polar hydrophilic groups (NH3+/COO−) and hydrophobic interaction through π–π stacking between the aromatic rings.2,23 This is quite apparent from many studies where the pH induced electrostatic interaction have played a vital role in the self-assembly process of various biological macromolecules for controlling the shape of the nanostructures.21,66,75–77 The perturbation in the aromatic stacking interaction can be achieved by enhancing other interactions such as intermolecular hydrogen bonding and electrostatic interaction. As a consequence, the outcome of the self-assembly fibril morphology can be controlled to produce diverse assembled architectures.22,73 In the present study, we have tweaked the ionization state of the single amino acid to see its impact on the nanostructured morphology. In the presence of intermolecular electrostatic repulsion originated from the existing cationic/anionic state of the L-Phe amino acid at the extreme pH values (pH 1.5 and 12.2), may be deterring the molecular mechanism responsible for the formation of fibrillar morphology for the case of zwitterionic state. From our 1H NMR studies, the chemical shift and the spin–spin fine splitting for the cationic/anionic pH solutions attributed to the change in the chemical environment around the aromatic residue and a restricted motion of the aromatic ring of the L-Phe. This also supports our claim on the possibility of perturbation in the π–π aromatic stacking interaction. In order to make precise and controlled advanced nanobiomaterials for biological applications it is necessary to get deeper insight about the self-assembly pathways and structural information about the nanoscopic morphology. It needs further attention on computational and theoretical studies to elucidate molecular level mechanism on self-assembly process of simple aromatic based amino acids and peptides.
Conclusions
In this study, we have probed the self-assembly of L-Phe by varying the ionization state of the amino acid. The ATR-FTIR spectroscopy is used to probe the unique vibrational signatures of the different ionization states of the amino acid. The observed change in the chemical shift and the spin–spin fine splitting for the extreme pH solutions from 1H NMR studies attributed to the change in the structural arrangement or chemical environment around the aromatic residue and a restricted motion of the aromatic ring of the L-Phe. SEM images of the dried samples provided the physical morphology of the L-Phe self-assembled process. For the case of zwitterionic state, the self-assembly of L-Phe is dominated by the fibril morphology. However, it is found that for the case of cationic and anionic states of L-Phe, the self-assembled morphology is dominated by the presence of flakes. It is quite evident from our study that the intermolecular electrostatic interaction is playing a major role over π–π aromatic stacking interaction towards the inhibition of the fibrillar morphology. The finding of our present study demonstrates the significant role of intermolecular interaction for the self-assembly of a single amino acid. Our study can provide better insight to improve the design and fabrication of self-assembled nanostructures of aromatic amino acids and peptides for various biomedical applications.Author contributions
The manuscript was written through contributions of all authors. All authors have given approval to the final version of the manuscript.Notes
The authors declare no competing financial interests.Conflicts of interest
There are no conflicts to declare.Acknowledgements
The authors acknowledge support from Department of Physics, Indian Institute of Technology Ropar for SEED Grant and Defence Research and Development Organisation (ERIP/ER/1500487/M/01/1602) and for use SEM under Central Facility. One of the authors S. C. would like to acknowledge research grant reference number PDF/2015/000997 received from the Science and Engineering Research Board, Government of India.References
- A. B. Hughes, Amino Acids, Peptides and Proteins in Organic Chemistry, Building Blocks, Catalysis and Coupling Chemistry, John Wiley and Sons, 2011 Search PubMed.
- L. Adler-Abramovich, L. Vaks, O. Carny, D. Trudler, A. Magno, A. Caflisch, D. Frenkel and E. Gazit, Nat. Chem. Biol., 2012, 8, 701–706 CrossRef CAS PubMed.
- E. R. Silva, E. Listik, S. W. Han, W. A. Alves, B. M. Soares, M. Reza, J. Ruokolainen and I. W. Hamley, Biophys. Chem., 2018, 233, 1–12 CrossRef CAS PubMed.
- C. A. Ross and M. A. Poirier, Nat. Med., 2004, 10, S10–S17 CrossRef PubMed.
- C. M. Rufo, Y. S. Moroz, O. V. Moroz, J. Stöhr, T. A. Smith, X. Hu, W. F. DeGrado and I. V. Korendovych, Nat. Chem., 2014, 6, 303–309 CrossRef CAS PubMed.
- S. Kaufman, Proc. Natl. Acad. Sci. U. S. A., 1999, 96, 3160–3164 CrossRef CAS.
- N. Blau, F. J. van Spronsen and H. L. Levy, Lancet, Elsevier, 2010, vol. 376, pp. 1417–1427 Search PubMed.
- J. J. Mitchell, Y. J. Trakadis and C. R. Scriver, Genet. Med., 2011, 13, 697–707 CrossRef CAS PubMed.
- I. Cherny and E. Gazit, Angew. Chem., Int. Ed., 2008, 47, 4062–4069 CrossRef CAS PubMed.
- E. Gazit, Nanomedicine, 2014, 9, 2433–2436 CrossRef CAS PubMed.
- A. Lakshmanan, S. Zhang and C. A. Hauser, Trends Biotechnol., 2012, 30, 155–165 CrossRef CAS PubMed.
- S. Yuran, Y. Razvag and M. Reches, ACS Nano, 2012, 6, 9559–9566 CrossRef CAS PubMed.
- S. Marchesan, C. Easton, K. Styan, L. Waddington, F. Kushkaki, L. Goodall, K. McLean, J. Forsythe and P. Hartley, Nanoscale, 2014, 6, 5172–5180 RSC.
- C. C. Decandio, E. R. Silva, I. W. Hamley, V. Castelletto, M. S. Liberato, V. X. Oliveira Jr, C. L. Oliveira and W. A. Alves, Langmuir, 2015, 31, 4513–4523 CrossRef CAS PubMed.
- G. N. Roviello, G. Oliviero, A. Di Napoli, N. Borbone and G. Piccialli, Arabian J. Chem., 2018 DOI:10.1016/j.arabjc.2018.02.014.
- G. N. Roviello, Amino Acids, 2018, 50, 933–941 CrossRef CAS PubMed.
- M. R. Ghadiri, J. R. Granja and L. K. Buehler, Nature, 1994, 369, 301–304 CrossRef CAS PubMed.
- H. Inouye, J. E. Bond, S. P. Deverin, A. Lim, C. E. Costello and D. A. Kirschner, Biophys. J., 2002, 83, 1716–1727 CrossRef CAS PubMed.
- A. Lakshmanan, D. W. Cheong, A. Accardo, E. Di Fabrizio, C. Riekel and C. A. Hauser, Proc. Natl. Acad. Sci. U. S. A., 2013, 110, 519–524 CrossRef CAS PubMed.
- D. Pinotsi, A. K. Buell, C. M. Dobson, G. S. Kaminski Schierle and C. F. Kaminski, ChemBioChem, 2013, 14, 846–850 CrossRef CAS PubMed.
- V. Foderà, A. Zaccone, M. Lattuada and A. M. Donald, Phys. Rev. Lett., 2013, 111, 108105 CrossRef PubMed.
- S. D. Bhagat and A. Srivastava, CrystEngComm, 2016, 18, 4369–4373 RSC.
- T. D. Do, W. M. Kincannon and M. T. Bowers, J. Am. Chem. Soc., 2015, 137, 10080–10083 CrossRef CAS PubMed.
- R. Perkins and V. Vaida, J. Am. Chem. Soc., 2017, 139, 14388–14391 CrossRef CAS PubMed.
- H. W. German, S. Uyaver and U. H. E. Hansmann, J. Phys. Chem. A, 2015, 119, 1609–1615 CrossRef CAS PubMed.
- V. Singh, R. K. Rai, A. Arora, N. Sinha and A. K. Thakur, Sci. Rep., 2014, 4, 3875 CrossRef PubMed.
- M. Reches and E. Gazit, Science, 2003, 300, 625–627 CrossRef CAS PubMed.
- Q. Li, Y. Jia, L. Dai, Y. Yang and J. Li, ACS Nano, 2015, 9, 2689–2695 CrossRef CAS PubMed.
- T. P. Knowles and R. Mezzenga, Adv. Mater., 2016, 28, 6546–6561 CrossRef CAS PubMed.
- P. W. Frederix, R. V. Ulijn, N. T. Hunt and T. Tuttle, J. Phys. Chem. Lett., 2011, 2, 2380–2384 CrossRef CAS PubMed.
- E. C. Griffith and V. Vaida, J. Am. Chem. Soc., 2013, 135, 710–716 CrossRef CAS PubMed.
- S. Strazdaite, K. Meister and H. J. Bakker, J. Am. Chem. Soc., 2017, 139, 3716–3720 CrossRef CAS PubMed.
- L. Scatena, M. Brown and G. Richmond, Science, 2001, 292, 908–912 CrossRef CAS PubMed.
- Q. Du, R. Superfine, E. Freysz and Y. Shen, Phys. Rev. Lett., 1993, 70, 2313–2316 CrossRef CAS PubMed.
- X. Chen, S. C. Flores, S.-M. Lim, Y. Zhang, T. Yang, J. Kherb and P. S. Cremer, Langmuir, 2010, 26, 16447–16454 CrossRef CAS PubMed.
- K. C. Jena and D. K. Hore, J. Phys. Chem. C, 2009, 113, 15364–15372 CrossRef CAS.
- K. C. Jena, P. A. Covert and D. K. Hore, J. Phys. Chem. Lett., 2011, 2, 1056–1061 CrossRef CAS.
- S. T. van der Post, C.-S. Hsieh, M. Okuno, Y. Nagata, H. J. Bakker, M. Bonn and J. Hunger, Nat. Commun., 2015, 6, 8384 CrossRef CAS PubMed.
- H. Yang, S. Yang, J. Kong, A. Dong and S. Yu, Nat. Protoc., 2015, 10, 382–396 CrossRef CAS PubMed.
- S. Roy, P. A. Covert, T. A. Jarisz, C. Chan and D. K. Hore, Anal. Chem., 2016, 88, 4682–4691 CrossRef CAS PubMed.
- L. A. Averett, P. R. Griffiths and K. Nishikida, Anal. Chem., 2008, 80, 3045–3049 CrossRef CAS PubMed.
- S. Gopalakrishnan, P. Jungwirth, D. J. Tobias and H. C. Allen, J. Phys. Chem. B, 2005, 109, 8861–8872 CrossRef CAS PubMed.
- S. Olsztynska, M. Komorowska, L. Vrielynck and N. Dupuy, Appl. Spectrosc., 2001, 55, 901–907 CrossRef CAS.
- S. Olsztynska, N. Dupuy, L. Vrielynck and M. Komorowska, Appl. Spectrosc., 2006, 60, 1040–1053 CrossRef CAS PubMed.
- S. Olsztynska, M. Komorowska and N. Dupuy, Appl. Spectrosc., 2006, 60, 648–652 CrossRef CAS PubMed.
- S. Olsztyńska-Janus and M. Komorowska, Struct. Chem., 2012, 23, 1399–1407 CrossRef.
- M. R. Sawaya, S. Sambashivan, R. Nelson, M. I. Ivanova, S. A. Sievers, M. I. Apostol, M. J. Thompson, M. Balbirnie, J. J. Wiltzius and H. T. McFarlane, et. al., Nature, 2007, 447, 453–457 CrossRef CAS PubMed.
- J. Lu, J. Wang, Z. Li and S. Rohani, Afr. J. Pharm. Pharmacol., 2012, 6, 269–277 CrossRef CAS.
- X. Wang, Y. C. Chen and B. Li, RSC Adv., 2015, 5, 8022–8027 RSC.
- X. Liu, J. Fei, A. Wang, W. Cui, P. Zhu and J. Li, Angew. Chem., Int. Ed., 2017, 56, 2660–2663 CrossRef CAS PubMed.
- L. L. Mears, E. R. Draper, A. M. Castilla, H. Su, B. Dietrich, M. C. Nolan, G. N. Smith, J. Doutch, S. Rogers and R. Akhtar, et. al., Biomacromolecules, 2017, 18, 3531–3540 CrossRef CAS PubMed.
- G. Gottarelli, S. Lena, S. Masiero, S. Pieraccini and G. P. Spada, Chirality, 2008, 20, 471–485 CrossRef CAS PubMed.
- D. M. Rayan, S. B. Anderson, F. T. Senguen, R. E. Youngman and B. L. Nilsson, Soft Matter, 2010, 6, 475–479 RSC.
- S. Perween, B. Chandanshive, H. C. Kotamarthi and D. Khushalani, Soft Matter, 2013, 9, 10141–10145 RSC.
- G. Barth, W. Voelter, H. S. Mosher, E. Bunnenberg and C. Djerassi, J. Am. Chem. Soc., 1970, 92, 875–886 CrossRef CAS.
- M. J. Krysmann, V. Castelletto, A. Kelarakis, I. W. Hamely, R. A. Hule and D. J. Pochan, Biochemistry, 2008, 47, 4597–4605 CrossRef CAS PubMed.
- M. Pellecchia, Chem. Biol., 2005, 12, 961–971 CrossRef CAS PubMed.
- B. Lam and A. J. Simpson, Analyst, 2008, 133, 263–269 RSC.
- Y. E. Shapiro, Prog. Polym. Sci., 2011, 36, 1184–1253 CrossRef CAS.
- K. P. Nartowski, S. M. Ramalhete, P. C. Martin, J. S. Foster, M. Heinrich, M. D. Eddleston, H. R. Green, G. M. Day, Y. Z. Khimyak and G. O. Lloyd, Cryst. Growth Des., 2017, 17, 4100–4109 CrossRef CAS.
- K. Shiraki, S. Norioka, S. Li, K. Yokota and F. Sakiyama, FEBS J., 2002, 269, 4152–4158 CAS.
- W. Dong, Y. Zhou, D. Yan, H. Li and Y. Liu, Phys. Chem. Chem. Phys., 2007, 9, 1255–1262 RSC.
- C. Bonechi, S. Martini, A. Magnani and C. Rossi, Magn. Reson. Chem., 2008, 46, 625–629 CrossRef CAS PubMed.
- Y. Li, T. Zhao, C. Wang, Z. Lin, G. Huang, B. D. Sumer and J. Gao, Nature, 2016, 7, 13214 Search PubMed.
- M. Moazeni, F. Karimzadeh and A. Kermanpur, Soft Matter, 2018, 14, 4996–5007 RSC.
- P. Singh, S. K. Brar, M. Bajaj, N. Narang, V. S. Mithu, O. P. Katare, N. Wangoo and R. K. Sharma, Mater. Sci. Eng., C, 2017, 72, 590–600 CrossRef CAS PubMed.
- L. Adler-Abramovich, M. Reches, V. L. Sedman, S. Allen, S. J. Tendler and E. Gazit, Langmuir, 2006, 22, 1313–1320 CrossRef CAS PubMed.
- V. Vetri, M. D'Amico, V. Foderà, M. Leone, A. Ponzoni, G. Sberveglieri and V. Militello, Arch. Biochem. Biophys., 2011, 508, 13–24 CrossRef CAS PubMed.
- D. Banik, R. Dutta, P. Banerjee, S. Kundu and N. Sarkar, J. Phys. Chem. B, 2016, 120, 7662–7670 CrossRef CAS PubMed.
- M. R. Ghadiri, J. R. Granja, R. A. Milligan, D. E. McRee and N. Khazanovich, Nature, 1993, 366, 324–327 CrossRef CAS PubMed.
- S. Zhang, T. Holmes, C. Lockshin and A. Rich, Proc. Natl. Acad. Sci. U. S. A., 1993, 90, 3334–3338 CrossRef CAS.
- T. C. Holmes, S. de Lacalle, X. Su, G. Liu, A. Rich and S. Zhang, Proc. Natl. Acad. Sci. U. S. A., 2000, 97, 6728–6733 CrossRef CAS.
- M. Owczarz, T. Casalini, A. C. Motta, M. Morbidelli and P. Arosio, Biomacromolecules, 2015, 16, 3792–3801 CrossRef CAS PubMed.
- C. Guo, Y. Luo, R. Zhou and G. Wei, ACS Nano, 2012, 6, 3907–3918 CrossRef CAS PubMed.
- M. R. Krebs, C. E. MacPhee, A. F. Miller, I. E. Dunlop, C. M. Dobson and A. M. Donald, Proc. Natl. Acad. Sci. U. S. A., 2004, 101, 14420–14424 CrossRef CAS PubMed.
- H. Jung, A. D. Robison and P. S. Cremer, J. Am. Chem. Soc., 2009, 131, 1006–1014 CrossRef CAS PubMed.
- A. Kundu, S. Yamaguchi and T. Tahara, J. Phys. Chem. Lett., 2014, 5, 762–766 CrossRef CAS PubMed.
Footnote |
| † Electronic supplementary information (ESI) available: The ATR correction method, additional figures as penetration depth profile in water on ZnSe and diamond ATR crystal, optical microscopy image of L-Phe, SEM images of DL-Phe, ATR-FTIR spectra of DL-Phe in aqueous solution at different concentrations, comparison of vibrational features of L-Phe and DL-Phe, energy difference between the individual peak positions of 1H NMR, SEM images of dried pH solutions. See DOI: 10.1039/c9ra00268e |
| This journal is © The Royal Society of Chemistry 2019 |

