 Open Access Article
Irreversible catalytic methylcyclohexane dehydrogenation by surface protonics at low temperature†
Kent Takisea,
Ayaka Satoa,
Kota Murakamia,
Shuhei Ogo a,
Jeong Gil Seo
 ab,
Ken-ichi Imagawac,
Shigeru Kadoc and
Yasushi Sekine
 *a
*a
aWaseda University, Department of Applied Chemistry, 3-4-1, Okubo, Shinjuku, Tokyo, 169-8555 Japan. E-mail: ysekine@waseda.jp
bMyongji University, Department of Energy Science and Technology, 116 Myongji-ro, Yongin-si, Gyeonggi-do 17058, Republic of Korea
cR&D Center, Chiyoda Corporation, 3-13, Moriya-cho, Yokohama, Kanagawa 221-0022, Japan
First published on 18th February 2019
Abstract
Liquid organic hydrides are regarded as promising for use as hydrogen carriers via the methylcyclohexane (MCH)–toluene–hydrogen cycle. Because of the endothermic nature of MCH dehydrogenation, the reaction is usually conducted at temperatures higher than 623 K. In this work, low-temperature catalytic MCH dehydrogenation was demonstrated over 3 wt% Pt/CeO2 catalyst by application of electric field across a fixed-bed flow reactor. Results show that a high conversion of MCH beyond thermodynamic equilibrium was achieved even at 423 K. Kinetic analyses exhibited a positive correlation of hydrogen to the reaction rates and an “inverse” kinetic isotope effect (KIE), suggesting that accelerated proton hopping with the H atoms of MCH promotes the reaction. Operando analyses and DFT calculation proved that the reverse reaction (i.e. toluene hydrogenation) was suppressed by the facilitation of toluene desorption in the electric field. The electric field promoted MCH dehydrogenation by surface proton hopping, even at low temperatures with an irreversible pathway.
1. Introduction
Hydrogen is anticipated for use as a promising secondary energy because it is producible from various sources. However, as hydrogen is gaseous, with low volume-density, a safe and cost-effective hydrogen storage system must be devised. Over many years, various hydrogen storage systems have been proposed such as hydrogen compression, hydrogen liquefaction, and hydrogen adsorption using solid state materials and organic hydrides: cycloalkanes.1–3 The organic hydride method is the most beneficial for long-term storage and mass transportation.3–5The organic hydride method consists of two reactions; hydrogenation and dehydrogenation between aromatic and naphthene compounds. The extracted hydrogen is useful for fuel cells, hydrogen combustion, and other applications. Among several organic hydride systems, methylcyclohexane (MCH) and toluene cycle are the most feasible for mobile and stationary applications because of their wide range of liquid phase and low toxicity.6,7 Dehydrogenation of MCH is an endothermic reaction, as shown in eqn (1). It is normally conducted at reaction temperatures higher than 623 K due to its kinetic and thermodynamic limitations.5
| C7H14 → C7H8 + 3H2, ΔH0298 = 204.8 kJ mol−1 | (1) |
Various Pt-supported catalysts have been investigated extensively because of their high activity and selectivity for MCH dehydrogenation.5,8 However, Pt-supported catalysts are reported as easily deactivated with toluene fouling and coke deposition.9–15 Many studies assessing the prevention of fouling and coke have been conducted.4,6,7,16–19 Catalyst stability is important to achieve adequate cost-effectiveness of the organic hydride system. Lowering the dehydrogenation temperature is also very important, because it can reduce energy consumption, and enables use of low-grade heat.5,20–22 Nevertheless, the dehydrogenation reaction is limited strongly by the thermodynamic equilibrium, especially at low temperatures. To exceed this equilibrium limitation, several attempts have been examined using catalytic membrane reactors,23–29 liquid-film-type catalyst30–34 and wet–dry multiple phase condition.35,36 Imposition of an electric field also promotes endothermic catalytic reactions at low temperatures.37–44 Manabe and co-workers reported that methane steam reforming proceeded, exceeding equilibrium limitations in an electric field at 423 K because of an irreversible reaction mechanism.37 Hopping proton over electric-field-imposed Pd/CeO2 plays an important role,37,45 and hydrogen can be obtained even at low temperatures by proton hopping.36,37,45 This is the first report that electric field application enables catalytic MCH dehydrogenation at low temperature (423 K) with high conversion; exceeding the equilibrium limitation by a surface proton hopping.
2. Experimental
2.1. Catalyst preparation
Pt/CeO2 catalyst was prepared using a wet-impregnation method. Catalyst support CeO2 (JRC-CEO-1) was impregnated with a solution of Pt(NH3)4(NO3)2 (Sigma-Aldrich Corp.). CeO2 support was soaked in 25 mL of water for 2 h. Then, Pt precursor was added with 15 mL of water and was stirred for 2 h using an evaporator. The loading amount of Pt was adjusted to 3 wt%. The solution was dried up. Then the resultant powder was calcined at 773 K for 2 h. The obtained catalyst was sieved to 355–500 μm.2.2. Catalytic activity tests
Catalytic activity tests were conducted with a fix-bed flow type reactor in which 200 mg of Pt/CeO2 catalyst was charged. Two stainless steel electrodes were inserted contiguously on the upper-side and bottom-side of the catalyst-bed to impose an electric field (see ESI Fig. S1†). The same setup was used also for the reaction without the electric field. For reaction in the electric field, 3.0 mA of constant current was applied between two electrodes. The reaction temperatures were set respectively to 423 and 523 K for reactions with and without the electric field. The reaction gas composition was C7H14![[thin space (1/6-em)]](https://www.rsc.org/images/entities/char_2009.gif) :
:![[thin space (1/6-em)]](https://www.rsc.org/images/entities/char_2009.gif) Ar = 6.4
Ar = 6.4![[thin space (1/6-em)]](https://www.rsc.org/images/entities/char_2009.gif) :
:![[thin space (1/6-em)]](https://www.rsc.org/images/entities/char_2009.gif) 30 and the total gas flow rate was 36.4 mL min−1, 0.1 MPa. We confirmed that the reaction condition is in a kinetic region at lower temperatures, and confirmed that diffusion is not a rate-determining factor (Fig. S2†). The reaction was conducted for 480 min to confirm the catalytic stability for MCH dehydrogenation. The product gas of the reaction was measured using GC-FID (GC-8A; Shimadzu Corp.) and GC-TCD (GC-8A; Shimadzu Corp.). Hydrogen yield was defined with the MCH feed rate (μmol min−1) and the H2 formation rate (μmol min−1). The resultant liquid during the reaction was analyzed using GC-FID (GC-4000; GL Science Inc.).
30 and the total gas flow rate was 36.4 mL min−1, 0.1 MPa. We confirmed that the reaction condition is in a kinetic region at lower temperatures, and confirmed that diffusion is not a rate-determining factor (Fig. S2†). The reaction was conducted for 480 min to confirm the catalytic stability for MCH dehydrogenation. The product gas of the reaction was measured using GC-FID (GC-8A; Shimadzu Corp.) and GC-TCD (GC-8A; Shimadzu Corp.). Hydrogen yield was defined with the MCH feed rate (μmol min−1) and the H2 formation rate (μmol min−1). The resultant liquid during the reaction was analyzed using GC-FID (GC-4000; GL Science Inc.).| Hydrogen yield (%) = rH2/(C7H14 feed rate × 3) × 100 | (2) |
Arrhenius plots were obtained over Pt/CeO2 catalyst to evaluate the apparent activation energy of MCH dehydrogenation with and without the electric field in a kinetic condition. Reaction rates were evaluated in kinetic control. In fact, the reaction rates were defined from the formation rate of H2 in the same manner as that used for activity tests. For a reaction with the electric field, the catalyst temperature was increased with Joule heating from the imposed electricity. Therefore, a thermocouple was inserted to the catalyst bed. It monitored the actual temperature of the catalyst.
After reaction for 480 min, the coke deposited on the catalyst was found from temperature-programmed oxidation (TPO) measurements obtained using a gas chromatograph to estimate CO or CO2 formation by coke oxidation. The temperature was increased from 298 K to 1173 K at 10 K min−1 in the gas composition of O2![[thin space (1/6-em)]](https://www.rsc.org/images/entities/char_2009.gif) :
:![[thin space (1/6-em)]](https://www.rsc.org/images/entities/char_2009.gif) He = 10
He = 10![[thin space (1/6-em)]](https://www.rsc.org/images/entities/char_2009.gif) :
:![[thin space (1/6-em)]](https://www.rsc.org/images/entities/char_2009.gif) 90 (mL min−1). The produced gas components and coke formation amount met a conceivable mass balance, i.e. almost 100%.
90 (mL min−1). The produced gas components and coke formation amount met a conceivable mass balance, i.e. almost 100%.
2.3. Partial pressure dependence and isotope effect
To elucidate the reaction mechanism, the dependence of partial pressure and reaction rate was evaluated for MCH, toluene, and hydrogen in each reaction condition because MCH conversion showed almost equal levels for these two cases: (1) at 423 K with the electric field and (2) at 523 K without the electric field. The feed gas composition was modified as C7H14![[thin space (1/6-em)]](https://www.rsc.org/images/entities/char_2009.gif) :
:![[thin space (1/6-em)]](https://www.rsc.org/images/entities/char_2009.gif) Ar = (3.2, 6.4, 9.6, 11.3)
Ar = (3.2, 6.4, 9.6, 11.3)![[thin space (1/6-em)]](https://www.rsc.org/images/entities/char_2009.gif) :
:![[thin space (1/6-em)]](https://www.rsc.org/images/entities/char_2009.gif) (53.2, 50.0, 46.8, 45.1), C7H14
(53.2, 50.0, 46.8, 45.1), C7H14![[thin space (1/6-em)]](https://www.rsc.org/images/entities/char_2009.gif) :
:![[thin space (1/6-em)]](https://www.rsc.org/images/entities/char_2009.gif) C7H8
C7H8![[thin space (1/6-em)]](https://www.rsc.org/images/entities/char_2009.gif) :
:![[thin space (1/6-em)]](https://www.rsc.org/images/entities/char_2009.gif) Ar = 6.4
Ar = 6.4![[thin space (1/6-em)]](https://www.rsc.org/images/entities/char_2009.gif) :
:![[thin space (1/6-em)]](https://www.rsc.org/images/entities/char_2009.gif) (1.0, 2.0, 3.0, 4.0)
(1.0, 2.0, 3.0, 4.0)![[thin space (1/6-em)]](https://www.rsc.org/images/entities/char_2009.gif) :
:![[thin space (1/6-em)]](https://www.rsc.org/images/entities/char_2009.gif) (49.0, 48.0, 47.0, 46.0) and C7H14
(49.0, 48.0, 47.0, 46.0) and C7H14![[thin space (1/6-em)]](https://www.rsc.org/images/entities/char_2009.gif) :
:![[thin space (1/6-em)]](https://www.rsc.org/images/entities/char_2009.gif) H2
H2![[thin space (1/6-em)]](https://www.rsc.org/images/entities/char_2009.gif) :
:![[thin space (1/6-em)]](https://www.rsc.org/images/entities/char_2009.gif) Ar = 6.4
Ar = 6.4![[thin space (1/6-em)]](https://www.rsc.org/images/entities/char_2009.gif) :
:![[thin space (1/6-em)]](https://www.rsc.org/images/entities/char_2009.gif) (4.0, 7.0, 9.0, 12.0)
(4.0, 7.0, 9.0, 12.0)![[thin space (1/6-em)]](https://www.rsc.org/images/entities/char_2009.gif) :
:![[thin space (1/6-em)]](https://www.rsc.org/images/entities/char_2009.gif) (46.0, 43.0, 41.0, 38.0). The total gas flow rate was 56.4 mL min−1, 0.1 MPa. Reaction rates were calculated from the formation rate of H2 analyzed using GC-TCD (GC-8A; Shimadzu Corp.).
(46.0, 43.0, 41.0, 38.0). The total gas flow rate was 56.4 mL min−1, 0.1 MPa. Reaction rates were calculated from the formation rate of H2 analyzed using GC-TCD (GC-8A; Shimadzu Corp.).
To elucidate the isotope effects of MCH dehydrogenation reaction, isotopes of MCH and H2 were used. The feed gas composition was modified as C7H14 (or C7D14)![[thin space (1/6-em)]](https://www.rsc.org/images/entities/char_2009.gif) :
:![[thin space (1/6-em)]](https://www.rsc.org/images/entities/char_2009.gif) H2 (or D2)
H2 (or D2)![[thin space (1/6-em)]](https://www.rsc.org/images/entities/char_2009.gif) :
:![[thin space (1/6-em)]](https://www.rsc.org/images/entities/char_2009.gif) Ar = 6.4
Ar = 6.4![[thin space (1/6-em)]](https://www.rsc.org/images/entities/char_2009.gif) :
:![[thin space (1/6-em)]](https://www.rsc.org/images/entities/char_2009.gif) 4.0
4.0![[thin space (1/6-em)]](https://www.rsc.org/images/entities/char_2009.gif) :
:![[thin space (1/6-em)]](https://www.rsc.org/images/entities/char_2009.gif) 46.0. The total gas flow rate was 56.4 mL min−1. Reaction rates were calculated from the formation rate of H2, HD, and D2.
46.0. The total gas flow rate was 56.4 mL min−1. Reaction rates were calculated from the formation rate of H2, HD, and D2.
2.4. Operando DRIFTS measurements
To observe the surface state of Pt/CeO2 catalyst in the electric field, DRIFTS measurements were conducted using a Fourier transform infrared spectrometer (FT/IR-6100; Jasco Corp.). Additionally, measurement apparatus was assembled for application of the electric field to the samples as described in an earlier report of the relevant literature.45 In this experiment, sieved catalyst was used. Two Pt electrodes were set on the catalyst. First, to confirm the state of the adsorbed species on Pt/CeO2 catalyst during the reaction, operando DRIFTS measurements were conducted. This operando measurement was conducted with the electric field at 423 K and without electric fields at 423 and 523 K. For measurements with the electric field, the constant current was imposed after the MCH introduction. Second, to observe the time course behavior of the absorbed species of MCH, intermediates, and toluene, DRIFTS measurements were taken with the electric field at 423 K and without the electric field at 523 K. For these measurements, MCH was supplied for 5 min into the measurement vessel to adsorb MCH on the catalyst. Subsequently, the gas flow was switched to Ar during measurement. Constant current was imposed immediately after the gas switching to Ar. Subsequently, IR spectra were observed for 60 min in each condition.2.5. Hydrogenation of toluene
Regarding the investigation of toluene hydrogenation activity on Pt/CeO2 catalyst, the reaction was conducted with and without the electric field. The feed gas composition was C7H8![[thin space (1/6-em)]](https://www.rsc.org/images/entities/char_2009.gif) :
:![[thin space (1/6-em)]](https://www.rsc.org/images/entities/char_2009.gif) H2
H2![[thin space (1/6-em)]](https://www.rsc.org/images/entities/char_2009.gif) :
:![[thin space (1/6-em)]](https://www.rsc.org/images/entities/char_2009.gif) Ar = 6.4
Ar = 6.4![[thin space (1/6-em)]](https://www.rsc.org/images/entities/char_2009.gif) :
:![[thin space (1/6-em)]](https://www.rsc.org/images/entities/char_2009.gif) 19.2
19.2![[thin space (1/6-em)]](https://www.rsc.org/images/entities/char_2009.gif) :
:![[thin space (1/6-em)]](https://www.rsc.org/images/entities/char_2009.gif) 10.8 (molar ratio). The total gas flow was 36.4 mL min−1, 0.1 MPa. The product liquid during the reaction was measured using GC-FID (GC-4000; GL Science Inc.).
10.8 (molar ratio). The total gas flow was 36.4 mL min−1, 0.1 MPa. The product liquid during the reaction was measured using GC-FID (GC-4000; GL Science Inc.).
2.6. Characterization
Dispersion and metal surface area of Pt metal was estimated using CO pulse measurements (BELCAT II; MicrotracBEL Corp.). Pre-treatment was conducted at 623 K in He gas to vaporize the adsorbed water. In addition, the state of supported Pt was confirmed with STEM images and EDX mapping results from scanning transmission electron microscopy (STEM; HF-2210; Hitachi Ltd.). The specific surface area of the catalyst was investigated based on N2 adsorption using the BET method (Gemini VII; Micromeritics Instrument Corp.). Pre-treatment was conducted at 473 K in a N2 atmosphere for 2 h.2.7. First-principles calculation
Theoretical analysis for vibrational spectral analysis was conducted using DFT calculations. All calculations were conducted using the Vienna ab initio simulation package (VASP) ver. 5.4.1. Procedure is described in ESI.†3. Results and discussion
3.1. Catalytic activity and the proton hopping role in the electric field
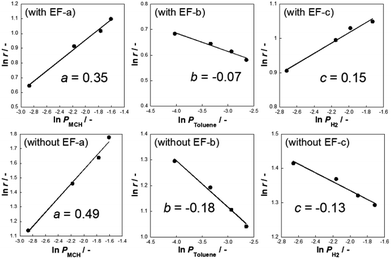
We conducted MCH dehydrogenation over 3 wt% Pt/CeO2 at temperatures of 423–573 K to confirm the electric field effects at low temperature range. 3 wt% Pt/CeO2 catalyst is an excellent catalyst for this purpose in an electric field, as confirmed from our pre-screening test (60 catalysts with various metals and supports are tested, not shown). Catalytic activities in terms of H2 yield and the CH4 production rate at each temperature are presented in Table 1. All the tests are conducted in a kinetic region (i.e. lower conversion condition). The actual temperature of catalyst was increased by Joule heating of the imposed electricity. Although the increase of temperature was 19 K at most (423 K), the catalytic activity was strongly promoted from 0.8% to 21.6% in the electric field. The conversion in the electric field can be increased to higher value by changing the contact time as shown in Fig. S2.† Consequently, the Joule heat effects on the catalytic activity are negligible. The catalyst activity was affected considerably by the applied electric field in the lower temperature range. Notably, the catalytic activity (21.6%) at 423 K with the electric field, which exceeds the equilibrium limitation (=5.5%) at this temperature. In terms of the methane (by-product) production rate, the catalyst in the electric field showed a lower methane production rate than the catalyst without an electric field at a similar catalytic activity level. In other words, applying an electric field to the catalyst facilitated dehydrogenation and suppressed MCH decomposition. To confirm this facilitative effect for dehydrogenation, Arrhenius plots are presented for kinetic region for both cases, i.e. with and without the electric field (Fig. 1). The apparent activation energy was 55.6 kJ mol−1 without the electric field, whereas it was 28.6 kJ mol−1 with the electric field. These results suggest that the MCH dehydrogenation was strongly promoted with electric field imposition. This phenomenon shows that the reaction mechanism on the catalysis in the electric field is completely different from that on the heated catalyst. To elucidate the reaction mechanism, the dependence of partial pressure and reaction rate for MCH, toluene, and hydrogen was evaluated over Pt/CeO2 catalyst with the electric field at 423 K and without the electric field at 523 K, as presented in Fig. 2. Here, the reaction rate of MCH dehydrogenation is defined as described in eqn (3) with each partial pressure.| rDehydrogenation = k[MCH]a[toluene]b[H2]c | (3) |
![[thin space (1/6-em)]](https://www.rsc.org/images/entities/char_2009.gif) :
:![[thin space (1/6-em)]](https://www.rsc.org/images/entities/char_2009.gif) Ar = 6.4
Ar = 6.4![[thin space (1/6-em)]](https://www.rsc.org/images/entities/char_2009.gif) :
:![[thin space (1/6-em)]](https://www.rsc.org/images/entities/char_2009.gif) 30 (total flow rate 36.4 mL min−1), EF: 3 mA currenta
30 (total flow rate 36.4 mL min−1), EF: 3 mA currenta
| Reaction temperature/K | With EF | Without EF | ||||
|---|---|---|---|---|---|---|
| Ttc/K | H2 yield/% | CH4 production/10−2 μmol min−1 | Ttc/K | H2 yield/% | CH4 production/10−2 μmol min−1 | |
| a Ttc: catalyst bed temperature measured using a thermocouple. | ||||||
| 423 | 442 | 21.6 | 1.1 | 422 | 0.8 | n.d |
| 473 | 479 | 30.2 | 2.4 | 468 | 5.6 | n.d |
| 523 | 522 | 51.8 | 4.1 | 523 | 21.5 | 1.6 |
| 573 | 572 | 88.3 | 14.0 | 566 | 52.5 | 5.2 |
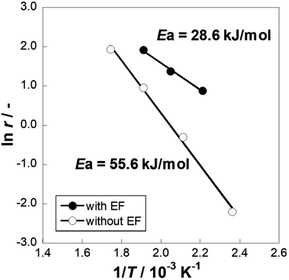 | ||
Fig. 1 Arrhenius plots for 3 wt% Pt/CeO2 catalyst with and without the electric field (EF): gas supply, MCH![[thin space (1/6-em)]](https://www.rsc.org/images/entities/char_2009.gif) : :![[thin space (1/6-em)]](https://www.rsc.org/images/entities/char_2009.gif) Ar = 6.4 Ar = 6.4![[thin space (1/6-em)]](https://www.rsc.org/images/entities/char_2009.gif) : :![[thin space (1/6-em)]](https://www.rsc.org/images/entities/char_2009.gif) 30 (total flow rate 36.4 mL min−1); EF: current 3 mA. 30 (total flow rate 36.4 mL min−1); EF: current 3 mA. | ||
Generally, toluene and hydrogen partial pressures negatively affect the reaction rates of MCH dehydrogenation because toluene adsorption competitively inhibits adsorption of MCH to the reaction site. As Fig. 2 shows, the partial pressures of toluene and hydrogen are negatively correlated with the reaction rates without the electric field (i.e. heated catalyst).5 Although toluene partial pressures are also negatively correlated with the reaction rate in the electric field, the order of correlation slope increased from −0.18 (without the electric field) to −0.07 (with the electric field). Moreover, the partial pressure of hydrogen was positively correlated with dehydrogenation reaction in the electric field, which is an extraordinary phenomenon considering the nature of hydrogenation reactions (i.e. normally reversible). We found in earlier studies that proton hopping on the catalyst enables low-temperature catalysis in many cases. In such cases, hydrogen partial pressure dependence shows positive values.37–39 Therefore, H species are considered to promote dehydrogenation of MCH on the Pt/CeO2 in an electric field.
To confirm the role of H species in the electric field, isotope effects were investigated supplying isotope MCHD (i.e. C7D14) and D2 to the catalyst with and without the electric field (Table 2). Isotope effects were defined as kD/kH, where k is the rate constant of dehydrogenation calculated from the hydrogen formation rate in a kinetic region. Without the electric field, the kD/kH value was lower than 1.0 when MCHD was supplied: 0.67 and 0.69 for MCHD/H2 and MCHD/D2 cases, respectively. Furthermore, reaction rates were unaffected by the exchange of H2 and D2. In most cases, chemical bonds including heavier isotopes require higher dissociation energy because of the stability of zero-point energy (ZPE), which leads to a lower kinetic value of the reaction (kD/kH < 1). Thereby, kinetic isotope effect (KIE) was observed during the reaction without the electric field. However, kD/kH values with the electric field were increased; kD/kH were 1.20, 1.22, and 1.42 for MCHD/H2, MCHH/D2, and MCHD/D2, respectively. These “inverse” KIE were observed when a C–H–H configuration is formed with proton collision because the three-atom transition state has greater discrepancy of ZPE between isotopes than the physisorption state.45–51 From kinetic isotope analyses, MCH dehydrogenation is promoted by proton collision in the electric field.
![[thin space (1/6-em)]](https://www.rsc.org/images/entities/char_2009.gif) :
:![[thin space (1/6-em)]](https://www.rsc.org/images/entities/char_2009.gif) H2(or D2)
H2(or D2)![[thin space (1/6-em)]](https://www.rsc.org/images/entities/char_2009.gif) :
:![[thin space (1/6-em)]](https://www.rsc.org/images/entities/char_2009.gif) Ar = 6.4
Ar = 6.4![[thin space (1/6-em)]](https://www.rsc.org/images/entities/char_2009.gif) :
:![[thin space (1/6-em)]](https://www.rsc.org/images/entities/char_2009.gif) 4
4![[thin space (1/6-em)]](https://www.rsc.org/images/entities/char_2009.gif) :
:![[thin space (1/6-em)]](https://www.rsc.org/images/entities/char_2009.gif) 46 (total flow rate 56.4 mL min−1); EF: 3 mA currenta
46 (total flow rate 56.4 mL min−1); EF: 3 mA currenta
| Condition | Ttc/K | H2 production rate/μmol min−1 | H2 yield/% | kD/kH/— | |
|---|---|---|---|---|---|
| a Ttc: catalyst bed temperature measured using a thermocouple. | |||||
| With EF (423 K) | MCHH/H2 | 445 | 148 | 18.8 | — |
| MCHH/D2 | 441 | 178 | 22.6 | 1.20 | |
| MCHD/H2 | 445 | 180 | 22.9 | 1.22 | |
| MCHD/D2 | 442 | 209 | 26.6 | 1.42 | |
| Without EF (523 K) | MCHH/H2 | 519 | 247 | 31.5 | — |
| MCHH/D2 | 519 | 255 | 32.5 | 1.03 | |
| MCHD/H2 | 518 | 165 | 21.0 | 0.67 | |
| MCHD/D2 | 520 | 170 | 21.7 | 0.69 | |
3.2. Observation of adsorbed species and reaction mechanism on Pt/CeO2 in the electric field
Operando IR measurements were conducted over Pt/CeO2 catalyst to confirm the role of accelerated protons in MCH dehydrogenation. Fig. 3 portrays the operando IR spectrum during MCH gas supply with the electric field at 423 K, without the electric field at 423 K, and also without the electric field at 523 K. Without the electric field, two peaks for C–H stretching vibrations were observed, respectively, at 2925 and 2938 cm−1, assigned to –CH3 and –CH2- of physisorbed MCH (Fig. S3†).52,53 In addition, doublet peaks of C–H stretching were confirmed around 2860 cm−1.52,53 Regarding peaks with the electric field, there were four peaks in the C–H stretching region: 2910, 2925, 2938, and 2953 cm−1. The peak intensity of the formed toluene was negligible compared to that of MCH (Fig. S4†). Thereby, peculiar peaks for the spectra in the electric field were detected at 2910 and 2953 cm−1.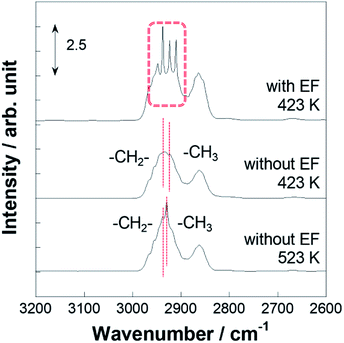 | ||
| Fig. 3 Operando DRIFTS spectra for 3 wt% Pt/CeO2 with the electric field at 423 K and without the electric field at 423 and 523 K. | ||
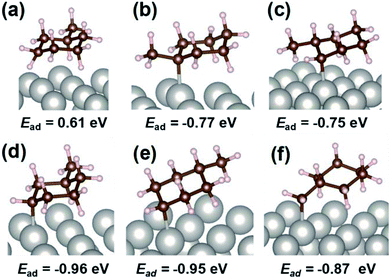
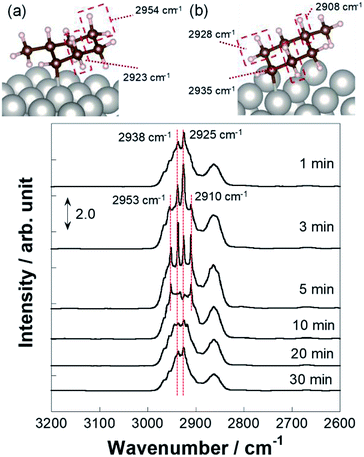
For the specification of such peculiar peaks in the electric field, DFT calculations were done. This first-principles calculation considered the physisorption state of MCH (C7H14) and chemisorption states of C7H13 species. According to kinetic analyses, MCH dehydrogenation was promoted by proton collision in the electric field. In this case, C7H13 species could be formed after the first proton collision to MCH with production of H2. The most stable structures and adsorption energies were calculated for MCH physisorption and C7H13 chemisorption states (Fig. 4). Consequently, chemisorption on the γ-position or δ-position was more stable, but all chemisorption states were able to be formed in view of the calculated adsorption energies. For that reason, theoretical C–H stretching vibrations were calculated to assign those peaks. As results of the calculations (Fig. S5†), peaks at 2910 and 2953 cm−1 can be attributed respectively to C7H13 chemisorption with the β-position and δ-position. These C7H13 species were regarded as reaction intermediates after proton collision. Therefore, the latter dehydrogenation steps might be the rate-determining steps from the fact of this intermediate observation.
More detailed investigations for operando IR measurements were conducted to identify such C7H13 species as reaction intermediates. Fig. 5 portrays the time-course spectra of operando IR peaks after the electric field was applied and the MCH supply was turned off simultaneously. After 3–5 min with application of the electric field, peaks for the chemisorption were observed in addition to that of physisorption. Subsequently, at 10 min, peak intensity for physisorption of MCH decreased faster than that of C7H13 chemisorption, which suggests that the second or third dehydrogenation was slower than the first dehydrogenation in the electric field. Then, the chemisorption peaks disappeared gradually within 30 min. These physisorption peaks represented physisorbed MCH on inactive sites. Fig. 6 depicts the time-course spectra of operando IR without the electric field after the MCH supply was stopped. Contrary to the case with the electric field, MCH physisorption peaks were observed during IR measurement. Thereby, it can be surmised that the first dehydrogenation of MCH (cyclohexane to cyclohexene) was a reaction barrier or rate-determining step without the electric field.54,55 Whereas the peak intensity for MCH physisorption decreased, that of toluene increased as measurements proceeded. These peaks were found for toluene: C–H stretching at around 3030 cm−1 (Fig. S6†) and C–C stretching at around 1500 and 1600 cm−1 were derived from dehydrogenation of MCH.52,53,56 Remarkably, toluene adsorption was not observed during the electric field application (Fig. 5) even though the conversions for two conditions were almost identical (with the electric field at 423 K and without the electric field at 523 K).
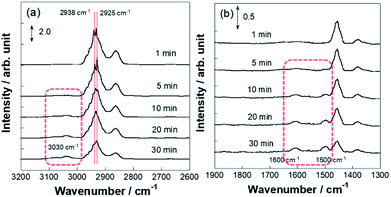 | ||
| Fig. 6 Operando DRIFTS spectra for 3 wt% Pt/CeO2 without the electric field at 523 K with time course: wavenumber range (a) 2600–3200 cm−1 and (b) 1300–1900 cm−1. | ||
3.3. Reversibility of the reaction and the reaction mechanism
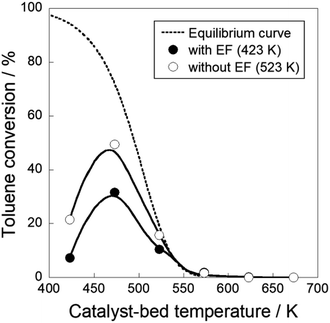
Toluene hydrogenation reaction was conducted with the Pt/CeO2 catalyst to assess the reversibility of the reaction because conversion of catalytic dehydrogenation of MCH with the electric field exceeded the calculated equilibrium, as shown in Table 1. Fig. 7 and Table S1† present temperature dependencies of toluene hydrogenation with and without the electric field. They show that hydrogenation activity with the electric field was lower than that without the electric field at temperatures below 523 K. Toluene hydrogenation activity reached the equilibrium limit above 523 K because catalysis with heat is reversible. This reversible path is dominant at temperatures higher than 523 K, irrespective of the reaction with/without the electric field. Suppressing catalytic activity for the reverse hydrogenation reaction with the electric field was observed. It derived from two reasons. First, as described above, the reactant toluene only slightly approached the reaction sites on Pt/CeO2 because toluene can desorb easily by the application of the electric field. Additionally, it was difficult for the hydrogenation of adsorbed toluene to proceed because of proton conductivity ascertained from “inverse” kinetic isotopes. Proton hopping promoted MCH dehydrogenation through three-atom transition (C7H13–H–H+).45 Consequently, hydrogenation with the electric field necessitated large apparent active energy and might be nearly irreversible.45–47,49 This phenomenon is related to the effects of proton collision during MCH dehydrogenation. Therefore, the electric field application promoted dehydrogenation reaction with proton collision, and it inhibited reverse hydrogenation, then the dehydrogenation of MCH exceeds the equilibrium limitation by applying the electric field at low temperatures. Also, the catalytic dehydrogenation in the electric field showed stable activity (Table S2†) and no change for the catalyst structure was observed (Table S3†).Fig. 8 presents the proposed reaction scheme according to the series of obtained results. We inferred that accelerated protons in the electric field (step 1) collided with H atoms of physisorbed MCH on either the β-position or δ-position (step 2), which triggered the first dehydrogenation reaction of MCH (step 3). After subsequent dehydrogenation had proceeded, toluene desorption was also promoted with the electric field (step 4).
4. Conclusions
MCH dehydrogenation was conducted on 3 wt% Pt/CeO2 with the electric field application. High catalytic activity was obtained even at 423 K, exceeding the equilibrium limitation. In the electric field, partial pressure dependence of H2 was found to be correlated positively with the reaction rate of dehydrogenation despite reversibility of the reaction. Furthermore, kinetic analyses revealed an “inverse” kinetic isotope effect (KIE). Proton acceleration that occurred along with the electric field application induced collisions with H atoms on MCH, which advanced the dehydrogenation on Pt/CeO2. According to operando IR measurements and DFT calculations, peculiar peaks were observed at wavenumbers of 2910 and 2953 cm−1 in the electric field. They were attributed to chemisorbed C7H13 species with β-position and δ-position. Results demonstrate that protons collided with H atoms of MCH at such positions, and that C7H13 remained on the surface as the reaction intermediates. Although toluene adsorption was observed without the electric field, it was not confirmed with the electric field. Consequently, electric fields can also facilitate toluene desorption. Moreover, toluene hydrogenation (i.e. reverse reaction) was inhibited in the electric field. In conclusion, the electric field promoted MCH dehydrogenation with proton collision irreversibly, even at the low temperature of 423 K.Conflicts of interest
There are no conflicts to declare.References
- S. Dutta, J. Ind. Eng. Chem., 2014, 20, 1148–1156 CrossRef CAS
.
- Q.-L. Zhu and Q. Xu, Energy Environ. Sci., 2015, 8, 478–512 RSC
.
- E. Gianotti, M. Taillades-Jacquin, J. Roziere and D. J. Jones, ACS Catal., 2018, 8, 4660–4680 CrossRef CAS
.
- Y. Okada, E. Sasaki, E. Watanabe, S. Hyodo and H. Nishijima, Int. J. Hydrogen Energy, 2006, 31, 1348–1356 CrossRef CAS
.
- F. Alhumaidan, D. Cresswell and A. Garforth, Energy Fuels, 2011, 25, 4217–4234 CrossRef CAS
.
- Y. Sugiura, T. Nagatsuka, K. Kubo, Y. Hirano, A. Nakamura, K. Miyazawa, Y. Iizuka, S. Furuta, H. Iki, T. Higo and Y. Sekine, Chem. Lett., 2017, 46, 1601–1604 CrossRef CAS
.
- A. Nakano, S. Manabe, T. Higo, H. Seki, S. Nagatake, T. Yabe, S. Ogo, T. Nagatsuka, Y. Sugiura, H. Iki and Y. Sekine, Appl. Catal., A, 2017, 543, 75–81 CrossRef CAS
.
- R. B. Biniwale, S. Rayalu, S. Devotta and M. Ichikawa, Int. J. Hydrogen Energy, 2008, 33, 360–365 CrossRef CAS
.
- L. W. Jossens and E. E. Petersen, J. Catal., 1982, 73, 377–386 CrossRef CAS
.
- M. A. Pacheco and E. E. Petersen, J. Catal., 1984, 86, 75–83 CrossRef CAS
.
- M. A. Pacheco and E. E. Petersen, J. Catal., 1984, 88, 400–408 CrossRef CAS
.
- M. Chai and K. Kawakami, J. Chem. Technol. Biotechnol., 1991, 51, 335–345 CrossRef CAS
.
- J. F. Garcia de la Banda, A. Corma and F. V. Melo, Appl. Catal., 1986, 26, 103–121 CrossRef CAS
.
- G. Maria, A. Marin, C. Wyss, S. Muller and E. Newson, Chem. Eng. Sci., 1996, 51, 2891–2896 CrossRef CAS
.
- A. K. Pal, M. Bhowmick and R. D. Srivastava, Ind. Eng. Chem. Process Des. Dev., 1986, 25, 236–241 CrossRef CAS
.
- J. Yu, Q. Ge, W. Fang and H. Xu, Int. J. Hydrogen Energy, 2011, 36, 11536–11544 CrossRef CAS
.
- S. Nagatake, T. Higo, S. Ogo, Y. Sugiura, R. Watanabe, C. Fukuhara and Y. Sekine, Catal. Lett., 2016, 146, 54–60 CrossRef CAS
.
- J. Yan, W. Wang, L. Miao, K. Wu, G. Chen, Y. Huang and Y. Yang, Int. J. Hydrogen Energy, 2018, 43, 9343–9352 CrossRef CAS
.
- M. A. Pacheco and E. E. Petersen, J. Catal., 1985, 96, 507–516 CrossRef CAS
.
- D. Teichmann, K. Stark, K. Muller, G. Zottl and P. Wasserscheid, Energy Environ. Sci., 2012, 5, 9044–9054 RSC
.
- G. W. H. Scherer and E. Newson, Int. J. Hydrogen Energy, 1998, 23, 19–25 CrossRef CAS
.
- G. W. H. Scherer, E. Newson and A. Wokaun, Int. J. Hydrogen Energy, 1999, 24, 1157–1169 CrossRef CAS
.
- G. Li, K. Yada, M. Kanezashi, T. Yoshioka and T. Tsuru, Ind. Eng. Chem. Res., 2013, 52, 13325–13332 CrossRef CAS
.
- Y. R. Chen, T. Tsuru and D. Y. Kang, Int. J. Hydrogen Energy, 2017, 42, 26296–26307 CrossRef CAS
.
- P. Ferreira-Aparicio, I. Rodriguez-Ramos and A. Guerrero-Ruiz, Chem. Commun., 2002, 2082–2083 RSC
.
- P. Ferreira-Aparicio, I. Rodriguez-Ramos and A. Guerrero-Ruiz, J. Catal., 2002, 212, 182–192 CrossRef CAS
.
- J. K. Ali, E. J. Newson and D. W. T. Rippin, Chem. Eng. Sci., 1994, 49, 2129–2134 CrossRef CAS
.
- J. K. Ali and A. Baiker, Appl. Catal., A, 1997, 155, 41–57 CrossRef CAS
.
- K. Oda, K. Akamatsu, T. Sugawara, R. Kikuchi, A. Segawa and S. Nakao, Ind. Eng. Chem. Res., 2010, 49, 11287–11293 CrossRef CAS
.
- S. Hodoshima, H. Arai and Y. Saito, Int. J. Hydrogen Energy, 2003, 28, 197–204 CrossRef CAS
.
- S. Hodoshima, S. Takaiwa, S. Shono, K. Satoh and Y. Saito, Appl. Catal., A, 2005, 283, 235–242 CrossRef CAS
.
- C. Shinohara, S. Kawakami, T. Moriga, H. Hayashi, S. Hodoshima, Y. Saito and S. Sugiyama, Appl. Catal., A, 2004, 266, 251–255 CrossRef CAS
.
- D. Sebastian, E. G. Bordeje, L. Calvillo, M. J. Lazaro and R. Moliner, Int. J. Hydrogen Energy, 2008, 33, 1329–1334 CrossRef CAS
.
- Y. Saito, K. Aramaki, S. Hodoshima, M. Saito, A. Shono, J. Kuwano and K. Otake, Chem. Eng. Sci., 2008, 63, 4935–4941 CrossRef CAS
.
- N. Kariya, A. Fukuoka and M. Ichikawa, Appl. Catal., A, 2002, 233, 91–102 CrossRef CAS
.
- A. A. Shukula, P. V. Gosabi, J. V. Pande, V. P. Kumar, K. V. R. Chary and R. B. Biniwale, Int. J. Hydrogen Energy, 2010, 35, 4020–4026 CrossRef
.
- R. Manabe, S. Okada, R. Inagaki, K. Oshima, S. Ogo and Y. Sekine, Sci. Rep., 2016, 6, 38007 CrossRef CAS PubMed
.
- R. Inagaki, R. Manabe, Y. Hisai, Y. Kamite, T. Yabe, S. Ogo and Y. Sekine, Int. J. Hydrogen Energy, 2018, 43, 14310–14318 CrossRef CAS
.
- K. Oshima, T. Shinagawa, Y. Nogami, R. Manabe, S. Ogo and Y. Sekine, Catal. Today, 2014, 232, 27–32 CrossRef CAS
.
- T. Yabe, Y. Kamite, K. Sugiura, S. Ogo and Y. Sekine, J. CO2 Util., 2017, 20, 156–162 CrossRef CAS
.
- Y. Sekine, M. Haraguchi, M. Tomioka and E. Kikuchi, J. Phys. Chem. A, 2010, 114, 3824–3833 CrossRef CAS PubMed
.
- S. Ogo and Y. Sekine, Chem. Rec., 2017, 17, 726–738 CrossRef CAS PubMed
.
- K. Oshima, T. Shinagawa, M. Haraguchi and Y. Sekine, Int. J. Hydrogen Energy, 2013, 38, 3003–3011 CrossRef CAS
.
- Y. Sekine, M. Haraguchi and E. Kikuchi, Catal. Today, 2011, 171, 116–125 CrossRef CAS
.
- S. Okada, R. Manabe, R. Inagaki, S. Ogo and Y. Sekine, Catal. Today, 2018, 307, 272–276 CrossRef CAS
.
- G. C. Schatz and A. F. Wagner, J. Phys. Chem., 1984, 88, 221–232 CrossRef CAS
.
- M. J. Kurylo, G. A. Hollinden and R. B. Timmons, J. Chem. Phys., 1970, 52, 1773–1781 CrossRef CAS
.
- K. B. Wiberg, Chem. Rev., 1955, 55, 713–743 CrossRef CAS
.
- B. Kerkeni and D. C. Clary, J. Phys. Chem. A, 2004, 108, 8966–8972 CrossRef CAS
.
- G. A. Olah and R. H. Schlosberg, J. Am. Chem. Soc., 1968, 90, 2726–2727 CrossRef CAS
.
- G. A. Olah, G. Klopman and R. H. Schlosberg, J. Am. Chem. Soc., 1969, 91, 3261–3268 CrossRef CAS
.
- D. Murzin, T. Salmi, S. Smeds, M. Laatikainen, M. Mustonen and E. Paatero, React. Kinet. Catal. Lett., 1997, 61, 227–236 CrossRef CAS
.
- M. D. Hernandez, I. Tejedor-Tejedor, J. M. Coronado and M. A. Andreson, Appl. Catal., B, 2011, 101, 283–293 CrossRef
.
- P. A. V. Trimpont, G. B. Marin and G. F. Froment, Ind. Eng. Chem. Fundam., 1986, 25, 544–553 CrossRef
.
- F. Alhumaidan, D. Cresswell and A. Garforth, Ind. Eng. Chem. Res., 2011, 50, 2509–2522 CrossRef CAS
.
- K. Takise, T. Higo, D. Mukai, S. Ogo, Y. Sugiura and Y. Sekine, Catal. Today, 2016, 265, 111–117 CrossRef CAS
.
Footnote |
| † Electronic supplementary information (ESI) available. See DOI: 10.1039/c9ra00407f |
| This journal is © The Royal Society of Chemistry 2019 |

