 Open Access Article
Simple, selective detection and efficient removal of toxic lead and silver metal ions using Acid Red 94†
Ghada M. Kamelab,
Marwa N. El-Nahassa,
Mohamed E. El-Khouly *bc,
Tarek A. Fayeda and
Maged El-Kemaryd
aDepartment of Chemistry, Faculty of Science, Tanta University, Tanta, 31527, Egypt
bDepartment of Chemistry, Faculty of Science, Kafrelsheikh University, Kafr El-Sheikh 33516, Egypt
cInstitute of Basic and Applied Sciences, Egypt-Japan University of Science and Technology (E-JUST), Alexandria, Egypt. E-mail: mohamed.elkhouly@ejust.edu.eg
dInstitute of Nanoscience and Nanotechnology, Kafrelsheikh University, Kafr El-Sheikh 33516, Egypt
First published on 13th March 2019
Abstract
Toward the goal of detecting toxic elements and removing them from drinking water, we report herein the utilization of Acid Red 94 (AR94) in sensing the hazardous metal ions in water. Among the various examined metal ions (Ag+, Pb2+, K+, Mn2+, Zn2+, La3+, Hg2+, Ca2+, Cd2+, Co2+, and Ni2+), the UV-visible absorption spectra showed high selectivity and sensitivity for toxic silver and lead metal ions in an aqueous solution. The observed absorption spectral changes and the rapid color changes confirm complex formation between AR94 and both Ag+ and Pb2+ metal ions. The emission measurements showed the significant fluorescence quenching of the singlet excited state of AR94 in the presence of Ag+ and Pb2+ metal ions suggesting the formation of an irradiative dye–metal complex under the prevailing experimental conditions. In order to remove the accumulated complexes of AR94 with silver metal ions, safe and harmless mesoporous titanium dioxide was utilized efficiently in removing the complexes with adsorption capacities of 91% at 30 minutes. These findings suggest a simple, fast and efficient method for both detecting silver in water, and removing the formed AR94–metal complexes in water. In addition, AR94 is shown to be a good sensor for the presence of Ag and Pb nanoparticles, NPs, in aqueous solution. The absorption and emission spectra of AR94 showed significant changes that may be rationalized by the strong electromagnetic coupling induced by NPs plasmonic effects. These findings render AR94 a sensitive and selective sensor and a visual indicator for the qualitative and quantitative detection of silver ions, lead ions and their nanoparticles.
1. Introduction
Chemical sensors are becoming more and more important in our life due to their use in several fields including; chemistry, medicine, the environment, food, and agriculture.1,2 As is well known, metal ions cause many problems in the human body if they are found in large amounts. Among the various metal ions, lead can spread out across water causing serious environmental and health problems.3 When lead ions are absorbed by the human body, they can replace some important elements in our body like Zn2+ and Ca2+ in hydroxyapatite in bones, which will cause huge damage to bones.4 In addition, drinking water could be polluted with lead ions through the corrosion of pipes and this can cause some health troubles, e.g., anemia,5 rising blood pressure, kidney damage,6 and diminished learning abilities in children.7 Although many people think that silver has no toxic side effects, silver toxicity has become a big problem in recent decades.8Recently, considerable efforts have been paid to developing highly selective and sensitive fluorescent probes for detection and removal of the toxic and radioactive species in drinking water.9–15 El-Nahass et al. developed a number of fluorescent chemosensors for metal ion detection in the environment.16–18 Also, J. Yoon et al.19 succeeded in designing fluorescent probes for the selective and sensitive detection of some metal ions, such as Cu2+, Hg2+, Zn2+, Pb2+, Cd2+, Ag+ and Au3+, by introducing various ligands to core fluorophores, such as rhodamine, fluorescein, pyrene, anthracene, naphthalimide, coumarin, and BODIPY.
Herein, we report the selective and sensitive detection of silver and lead as hazard metal ions using a cheap and easily prepared Acid Red (AR94) dye. As is known, AR94 dye is a good probe for monitoring electrostatic interactions and hydrogen bonding interactions,20,21 and is widely used in photocatalytic reactions. To our knowledge, utilizing AR94 as a sensitive chemosensor is rarely reported in the literature. Furthermore, our main goal aimed at studying the ability to use Acid Red 94 dye as a fluorescent chemosensor for the detection of metal ions such as lead and silver qualitatively (using naked eye detection) and quantitatively (using spectroscopic techniques at low concentration levels). Since the fabrication of nanoparticles (NPs) has attracted great attention in a wide range of environmental and technological applications in recent years, we have examined the electronic interactions of AR94 with silver and lead nanoparticles (NPs). As is well known, NPs exhibit different electrical, optical, magnetic, and chemical properties compared to their bulk counterparts, Ag+ and Pb2+ metal ions.21–23 Finally, TiO2 mesoporous materials have been used as safe and harmless materials for the removal of the accumulated AR94–Ag+ complexes from the water under UV radiation in a fast and efficient way.
2. Experimental section
2.1. Materials
Acid Red dye (AR94) was purchased from TCI and used without any further purification. The metal salts as AgNO3, Pb(NO3)2, KCl, MnCl2·4H2O, LaCl3·7H2O, ZnCl2·4H2O, HgCl2·2H2O, CaCl2·2H2O, CdNO3·4H2O, CoCl2·6H2O, NiCl2·6H2O, Pb(CH3COOH)2 and Ag2SO4 were obtained from Merck-Aldrich and used without purification. Trisodium citrate, sodium borohydride, Triton-X-100, cetyl trimethyl ammonium bromide (CTAB) and titanium butoxide were used as received from Aldrich.2.2. Synthesis
where N is the number of atoms per nanoparticle, D is the diameter of the AgNPs which was obtained from the TEM image (18 × 10−7 cm), ρ is the density of fcc Ag (10.5 g cm−3),25 M is the atomic mass (107.68 g mol−1), and NA is the Avogadro number.
| N = 3.14 × 10.5 × (18 × 10−7)3/(6 × 107.68) = 179251.59 |
The molar concentration of the AgNPs solution, C, can be calculated using the following equation:
3. Results and discussion
3.1. Interaction of AR94 and Ag+ metal ions
Fig. 1 shows the UV-visible absorption spectra of AR94 in the absence and presence of metal ions. As shown, the UV absorption spectrum of AR94 exhibited an absorption maximum at ∼520 nm. Upon addition of the examined metal ions (K+, Hg2+, Cd2+, Ni2+, Zn2+, Ca2+, Cu2+, La+, and Mn2+), the absorption spectrum of AR94 is kept almost the same suggesting no interactions between AR94 and these metal ions (ESI, Fig. S1–S4†). In the presence of AgNO3, it was interesting to see a rapid change of the color of AR94 from pink to violet color. In addition, the absorption spectrum of AR94 showed a considerable decrease of the intensity at 520 nm, with an accompanying increase of a new band at longer wavelength (∼600 nm). This observation suggests the formation of a ground state complex (AR94–Ag). As seen from Fig. 2A, the absorption intensity of the formed complex increases with increasing the concentration of Ag metal ions. The existence of an isosbestic point at 580 nm confirms the formation of two species in equilibrium.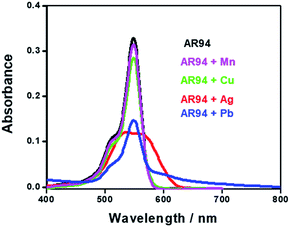 | ||
| Fig. 1 UV-visible absorption spectra of AR94 in the absence and presence of lead and silver metal ions in water. | ||
In a complementary experiment, the fluorescence spectra of AR94 in the absence and presence of AgNO3 were recorded in water, and are shown in Fig. 2B. Upon addition of different amounts of Ag+ metal ions, it was found that the characteristic emission of the singlet state of AR94 at ∼560 nm is heavily quenched with a considerable small blue shift suggesting the formation of a non-emissive complex. Similar fluorescence quenching features were observed with the interaction of AR94 and silver sulfate. The calculated quenching rate constant of AR94–Ag2SO4 was found to be higher than that of AR94–AgNO3. This finding could be rationalized by the high negative charge density and high hydration energy of sulfate ions compared with nitrate ions.
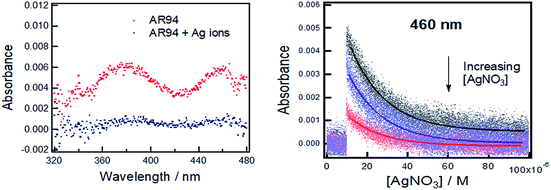
Powerful nanosecond laser photolysis will also be utilized to examine the interaction between the excited AR94 and Ag ions in water. As is well known, nanosecond transient absorption spectroscopy is useful in measuring the kinetics of a population and decay of states following an initial excitation pulse.27,28 Fig. 3 shows the transient absorption spectrum of AR94 in an oxygen-free water solution obtained using excited 576 nm laser light. As shown, the transient spectrum exhibited absorption bands at 380 and 460 nm. The decay rate of the triplet excited state at 460 nm was determined to be 5.71 × 10⁴ s−1.27–29 Upon addition of different concentrations of AgNO3, it was found that the transient spectra significantly decreased and the decay profiles of the triplet state at 460 nm were getting much faster. These findings confirm the interaction between the excited AR94 and the silver ions in an aqueous solution.
By measuring the kinetics of the fast reaction between AR94 and Ag metal ions, Fig. 4 shows the following observations: (i) the decay of the absorption band of AR94 is accompanied with the formation of an AR94–Ag complex, (ii) the reaction between Ag and AR94 is almost complete after 20 minutes, and (iii) the rates of complex formation increase with increasing the concentration of Ag metal ions. When increasing the concentration of added AgNO3 from 4.5 × 10⁻⁶ to 1.1 × 10⁻⁵ M, the reaction rates increase from 6.0 × 10⁻³ to 3.4 × 10⁻² min−1, respectively.
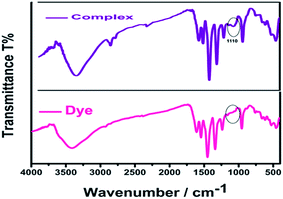
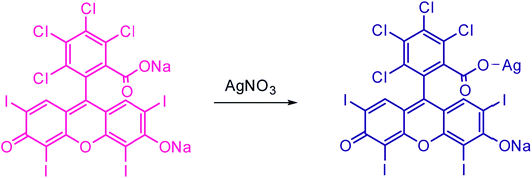
The complex formation between AR94 and Ag+ has been evidenced using an FTIR technique. As seen from Fig. 5, the free dye showed peaks at about 1547, 1492, and 1448 cm−1, which are ascribed to the characteristic absorption of the vibration of the aromatic ring frame of AR94. A peak at 1235 cm−1 was recorded and corresponds to C–O–C groups. The observed peaks at 1613 and 1339 cm−1 could be attributed to the asymmetric and symmetric stretching vibrations of COO−, respectively. The characteristic absorption bands of C–Cl stretching vibrations and Na–O bonds were observed at 759 and 1020 cm−1, respectively. When turning to the AR94–Ag complex, new peak was recorded at 1110 cm−1 that can be assigned to the characteristic Ag–O bond, confirming the formation of an AR94–Ag complex (Scheme 1).30,31
3.2. Interaction of AR94 and Pb2+ metal ions
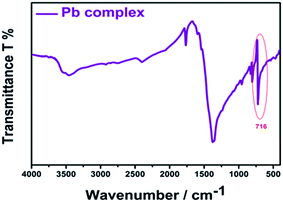
The selectivity of AR94 for Pb2+ metal ions has also been investigated by measuring the absorbance and emission spectra (Fig. 6). Upon adding different concentrations of Pb2+ metal ions, the UV-visible absorption spectra of AR94 showed a significant decrease in the absorption intensity, accompanied with the formation of an isosbestic point at 580 nm and a new peak around 600 nm. Additionally, an observable change in the color from pink to violet by the addition of Pb2+ metal ions has been noticed. These observations suggest the formation of a fast ground state complex (AR94–Pb2+). Similarly, the fluorescence intensity of the singlet AR94 dye showed a significant quenching was observed with the addition of various amounts of Pb2+ metal ions. The quenching follows the Stern–Volmer relation (Io/I = 1 + KSV[Q]), where Io and I are the emission intensities of AR94 in the absence and presence of a quencher of concentration [Q], respectively, and KSV is the Stern–Volmer quenching constant. The Stern–Volmer plots show an upward curvature, especially at higher concentrations, confirming the static quenching (Fig. 6). This higher quenching of AR94 in the presence of lead acetate was found to be higher than that of AR94/lead nitrate, which may be explained by the high pKa and high protonation energy of acetate anions compared to nitrate anions.32 It is most likely that the high selectivity of Acid Red 94 towards Ag+ and Pb2+ metal ions may be related to the their appropriate ionic radii (115 and 119 pm for Ag and Pb, respectively).33 In addition, the formation of the complex between AR94 and Pb2+ has been confirmed by FTIR analysis. As seen from Fig. 7, a new band centered at 716 cm−1 has been observed that can be attributed to Pb–O bond vibrations and confirms the formation of AR94–Pb complexes.343.3. Interaction of AR94 with silver and lead nanoparticles
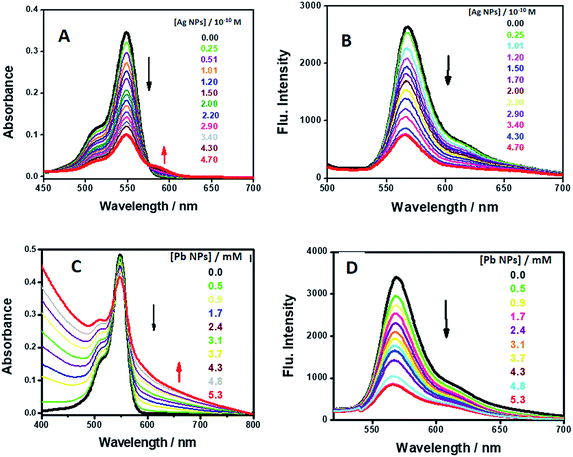 | ||
| Fig. 9 UV-visible absorption spectra and emission spectra of AR94 in the absence and presence of different concentrations of the synthesized AgNPs (A and B) and PbNPs (C and D). | ||
However, as the concentration of Ag+/Pb2+ metal ions and/or NP quencher increases, the positions of the fluorescence bands do not change despite the substantial decrease in the fluorescence intensities. This indicates the absence of significant molecular interactions under the prevailing experimental conditions. Generally, from the notable spectral and fast color changes of the investigated acid dye upon addition of the synthesized NPs, we conclude that the investigated dye can potentially become a sensitive and selective sensor for the qualitative and quantitative detection of the used metal ions and could be used as a visual indicator.
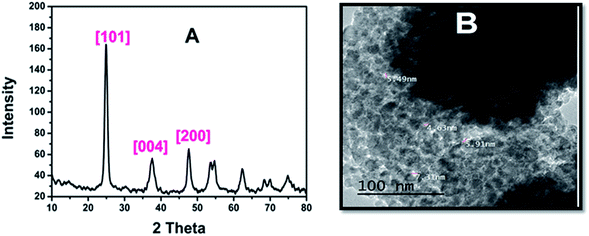
Despite the importance of AR94 acting as a sensor for metal ion detection, there must be a way to get rid of the accumulated complex (AR94–Ag), which will negatively affect the water. Therefore, we have synthesized mesoporous titanium dioxide, which is a safe and harmless material, in order to remove these complexes. Fig. 10A shows a representative XRD pattern of mesoporous TiO2. As can be seen, all peaks can be indexed to the pure structure of TiO2 without any impurities and the broadening of the peaks is due to the small size of the nanoparticles. The (2θ) peaks positioned for TiO2 at 25.02, 37.05, and 47.82, correspond to the reflection lattice planes of (101), (004), and (200), respectively.35 Fig. 10B shows a TEM image that further reveals the porous nature of the materials. The pores in the mesoporous spheres (∼5 nm) are clearly observed. The mesoporous spheres are composed of a lot of interconnected nanoparticles with sizes around 10 nm, which is compatible with results calculated theoretically using Scherrer’s equation.
Fig. 11 shows the degradation of the AR94–Ag complex solution on adding 0.01 g of mesoporous TiO2 with increasing the radiation time using UV lamp at 365 nm. Before irradiation, the suspensions were stirred in a shaker water bath for a period of time to establish the equilibrium. As can be seen, the absorption of AR94–Ag complex decreases gradually with time. This can be rationalized by the adsorption of the complex on the surface of mesoporous TiO2. The removal efficiency was determined to be 91% at 30 min. The high and fast efficiency of using mesoporous TiO2 to remove the free AR94 could be rationalized by the generated electrons and holes in the conduction band and valence band of TiO2, generated by UV irradiation, respectively. The electrons in the conduction band can react with oxygen to produce superoxide radical anions O2˙−.36,37 These superoxide radical anions further produce hydroxyl radicals as well as reacting with a proton to form hydroperoxyl radicals (HO2˙). The positive hole can oxidize hydroxide ions (or water molecules) adsorbed on the surface of TiO2 particles to produce hydroxyl radicals.38 The generated radicals are usually reacting with AR94 followed by the formation of several intermediates, and it is most likely that it is finally mineralized into carbon dioxide and water.
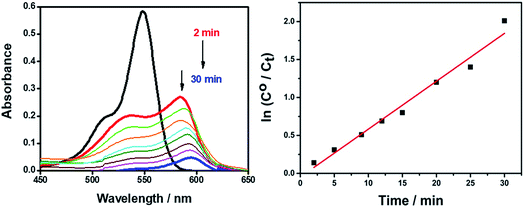 | ||
| Fig. 11 UV-visible absorption spectra of removing AR94–Ag+ complexes using mesoporous TiO2 under continuous UV radiation. | ||
The observed rate constants for the photocatalytic degradation of this complex with mesoporous TiO2 were determined using the relation: ln(C/C0) = −kobst, where C0 (mg L−1) is the initial concentration and kobs depends on the initial concentration (C0).39,40 From the linear plot of ln(C/C0) with irradiation time, the degradation rate (k) of the complex in the presence of mesoporous TiO2 was found to be 0.063 min.
4. Conclusion
Herein, we report the utilization of the commercial AR94 dye as a sensor for the detection of toxic lead and silver metal ions in water. The interaction between AR94 and both metal ions was proved quantitatively by the absorption and fluorescence spectral changes, and qualitatively by the rapid color change from a pink color (for AR94) to a violet color (for the AR94–Ag complex). The removal of the accumulated complex (AR94–Ag) was successfully performed using safe and harmless mesoporous titanium dioxide with an adsorption capacity of 91% at 30 min. The high and fast efficiency of mesoporous TiO2 was due the generation of radicals which usually react with the free dye particles followed by the formation of several intermediates which are finally mineralized into carbon dioxide and water. So, the removal process in water was easy and safe as the complex is adsorbed on the mesoporous TiO2. Furthermore, the interactions between AR94 and the fabricated Ag and/or Pb nanoparticles have been examined. Compared to the corresponding UV-visible absorption spectra measured in the case of Ag+ or Pb2+ metal ions, dramatic changes in the shape and position of the formed complex have been noticed, which may be due to strong electromagnetic coupling between the metal and the dye, induced by NPs plasmonic effects. From the notable spectral changes and fast color changes of AR94 with the addition of silver, lead and their nanoparticles, we conclude that AR94 can potentially become a sensitive and selective sensor for the qualitative and quantitative detection of the used metal ions and could be used a visual indicator.Conflicts of interest
The authors declare no conflict of interest.Acknowledgements
This work was financially supported by the Science and Technology Development Fund (STDF), Egypt, Grant Numbers 5537 and 12436.References
- C. H. Lee, H. Miyaji, D. W. Yoon and J. L. Sessler, Chem. Commun., 2008, 1, 24–34 RSC.
- S. M. Mousavi, S. A. Hashemi, M. Zarei, A. M. Amani and A. Babapoor, Med. Chem., 2018, 8, 205–217 Search PubMed.
- K. Sardar, S. Ali, S. Hameed, S. Afzal, S. Fatima, M. B. Shakoor, S. A. Bharwana and H. M. Tauqeer, Greener J. Environ. Manag., 2013, 2, 172–179 Search PubMed.
- H. T. Ratte, Environ. Toxicol. Chem., 1999, 18, 89–108 CrossRef CAS.
- R. Baran, D. A. R. de Berker, M. Holzberg and L. Thomas, Baran and Dawber’s Diseases of the Nails and their Management, John Wiley & Sons, 2012, pp. 1–417 Search PubMed.
- E. B. Ekong, B. G. Jaar and W. M. Weaver, Kidney Int., 2006, 70, 2074–2084 CrossRef CAS PubMed.
- W. L. Harold and W. S. Barton, Int. J. Environ. Health Res., 2016, 26, 5–6 Search PubMed.
- W. L. Roper, Toxicological profile for silver, Agency for Toxic Substances and Disease Registry, U.S. Public health Service, 1990 Search PubMed.
- N. M. El-Shafai, M. E. El-Khouly, M. El-Kemary, M. S. Ramadan, A. S. Derbalah and M. S. Masoud, J. Ind. Eng. Chem., 2019, 69, 315–323 CrossRef CAS.
- A. F. Tag El-Din, E. A. Elshehy and M. E. El-Khouly, J. Environ. Chem. Eng., 2018, 6, 5845–5854 CrossRef.
- A. F. Tag El-Din, M. E. El-Khouly, E. Elshehy, A. A. Atia and W. A. El-Said, Microporous Mesoporous Mater., 2018, 265, 211–218 CrossRef CAS.
- X. F. Zhang, Z. G. Liu, W. Shen and S. Gurunathan, Int. J. Mol. Sci., 2016, 17, 1–34 Search PubMed.
- K. D. Datkhile, P. P. Durgawale and M. N. Patil, Biomed. Pharmacol. J., 2017, 10, 337–344 CrossRef.
- V. Marassi, L. Di Cristo, S. G. J. Smith, S. Ortelli, M. Blosi, A. L. Costa, P. Reschiglian, Y. Volkov and A. Prina-Mello, R. Soc. Open Sci., 2018, 5, 1–21 Search PubMed.
- T. Sadhasivam, K. Dhanabalan, S. H. Roh, S. C. Kim, D. Jeon, J. E. Jin, J. Shim and H.-Y. Jung, J. Mater. Sci., 2017, 28, 5669–5674 CAS.
- M. N. El-Nahass and T. A. Fayed, Appl. Organomet. Chem., 2017, 31, 1–13 CrossRef.
- M. N. El-Nahass, M. Shaaban, T. Fayed and F. Hassan, Int. J. Chem. Appl. Biol. Sci., 2014, 1, 1–40 Search PubMed.
- M. N. El-Nahaa, T. A. Fayed, M. H. Shaaban and F. M. Hassan, Sens. Actuators, B, 2015, 210, 56–68 CrossRef.
- Y. Jeong and J. Yoon, Inorg. Chim. Acta, 2012, 381, 2–14 CrossRef CAS.
- D. Xu and D. C. Neckers, J. Photochem. Photobiol., A, 1987, 40, 361–370 CrossRef CAS.
- M. Blosi, S. Ortelli, A. I. Costa, M. Dondi, A. Lolli, S. Andreoli, P. Benito and S. Albonetti, Materials, 2016, 9, 1–25 CrossRef PubMed.
- A. Yadav, L. Zhong, J. Sun, L. Jiang, G. J. Cheng and L. Chi, Nano Convergence, 2017, 4, 1–8 CrossRef CAS PubMed.
- J. Jeevanandam, A. Barhoum, Y. S. Chan, A. Dufresne and M. K. Danquah, Beilstein J. Nanotechnol., 2018, 9, 1050–1074 CrossRef CAS PubMed.
- S. Asta, P. Judita and T. Sigitas, Mater. Sci., 2009, 15, 21–27 Search PubMed.
- X. Lui, M. Atwater, Q. Wang and J. Huo, Colloids Surf., B, 2007, 58, 3–7 CrossRef PubMed.
- K. Kannan, G. Muthuraman and S. Moon, Mater. Lett., 2014, 123, 19–22 CrossRef CAS.
- M. El-Khouly, P. Padmawar, Y. Araki, S. Verma, L. Y. Chiang and O. Ito, J. Phys. Chem. A, 2006, 110, 884–891 CrossRef CAS PubMed.
- M. E. El-Khouly, S. Gaddem, G. R. Deviprasad, M. Fujitsuka, O. Ito and F. D’Souza, J. Porphyrins Phthalocyanines, 2003, 7, 1–7 CrossRef CAS.
- M. E. El-Khouly, E. El-Mohsnawy and S. Fukuzumi, J. Photochem. Photobiol., C, 2017, 13, 36–83 CrossRef.
- Z. An, W. Zhang, H. Shi and J. He, J. Catal., 2006, 241, 319–327 CrossRef CAS.
- H. Yang, S. Li, X. Wang, F. Zhang, X. Zhong, Z. Dong and J. Ma, J. Mol. Catal. A: Chem., 2012, 364, 404–410 CrossRef.
- P. Bühlmann, E. Pretsch and E. Bakker, Chem. Rev., 1997, 97, 3083–3132 CrossRef.
- R. D. Shannon, Acta Crystallogr., Sect. A: Cryst. Phys., Diffr., Theor. Gen. Crystallogr., 1976, 32, 751–767 CrossRef.
- M. R. Ahsan, M. A. Uddin and M. G. Mortuza, Indian J. Pure Appl. Phys., 2005, 43, 89–99 CAS.
- C. H. Kwon, H. M. Shin, J. H. Kim and W. S. Choi, Mater. Chem. Phys., 2004, 86, 78–82 CrossRef CAS.
- H. A. Le, L. T. Linh and S. Chin, Powder Technol., 2012, 225, 167–175 CrossRef CAS.
- G. H. Wang, F. Wu, X. Zhang, M. Luo and N. Deng, J. Hazard. Mater., 2006, 133, 85–91 CrossRef CAS PubMed.
- R. J. Wu, C. C. Chen and C. S. Lu, Desalination, 2010, 250, 869–875 CrossRef CAS.
- E. Bizani, K. Fytianos, I. Poulios and V. Tsiridis, J. Hazard. Mater., 2006, 136, 85–94 CrossRef CAS PubMed.
- M. Sundararajan, L. J. Kennedya, P. Nithy, J. J. Vijaya and M. Bououdin, J. Phys. Chem. Solids, 2017, 108, 61–75 CrossRef CAS.
Footnote |
| † Electronic supplementary information (ESI) available. See DOI: 10.1039/c9ra00464e |
| This journal is © The Royal Society of Chemistry 2019 |


