 Open Access Article
Investigation of inverse emulsion assisted controlled release of polyacrylamides for enhanced oil recovery†
Zheyu Liu*ab,
Shruti Mendirattab,
Xin Chena,
Jian Zhangc and
Yiqiang Li *a
*a
aCollege of Petroleum Engineering, China University of Petroleum (Beijing), Beijing 102249, PR China. E-mail: zheyu-liu@outlook.com; lyq89731007@163.com
bChemical and Petroleum Engineering, University of Calgary, Calgary, AB T2N 1N4, Canada
cChina National Offshore Oil Corporation Research Institute, CNOOC, Beijing 100028, PR China
First published on 16th April 2019
Abstract
Conventional polymer flooding (e.g. using polyacrylamide) has been widely used in the oil fields as an economical means for enhanced oil recovery. However, its efficacy is affected by the polymer properties and increasingly harsh reservoir conditions. In this study, a high-molecular-weight modified polyacrylamide polymer (GF-1) encapsulated in a water-in-oil emulsion is proposed for controlled polymer release towards enhanced oil recovery. It is compared with the conventional polyacrylamide in terms of their microscopic morphology, dissolving capacity, concentration–viscosity relationship, and rheological properties. It contained swollen polymer micelles and gradually released the polymer after phase inversion, which caused its viscosity, viscoelasticity, and plugging capacity to increase with aging time. The plugging analysis surprisingly showed a four-fold increase in the dimensionless breakthrough pressure of the emulsion polymer and five-fold increase in the residual resistance factor after five days of aging, confirming the significant increase in viscosity in confined spaces. The most interesting results were obtained by parallel core flooding experiments, where a higher recovery factor of 2.7% more than the conventional polymer was observed for GF-1 and GF-1 outperformed the conventional polymer by 6.9% in the low permeability zone. This emulsion polymer is a promising material to achieve enhanced oil recovery using in-depth profile modification in future oilfield related efforts.
1. Introduction
Tertiary or enhanced oil recovery (EOR) is a very important topic in the petroleum industry and until 2017, oil and gas extraction held an 8.21% share of GDP in the Canadian economy, while China's oil demand is expected to reach 15.5 million barrels per day by 2040.1,2 As per the US Department of Energy several techniques including gas, thermal, and chemical/water injection can be used for enhanced oil recovery. It is well-known that nearly 70% of oil remains in the reservoir even after water flooding,3 which, fortunately, can be recovered by an incremental factor of 10–15% using polymer flooding.4,5 An aqueous solution of a polymer is capable of increasing the viscosity of the displacing phase, and expanding the sweep volume via mobility control, and has been extensively used in the mid-high permeability sandstone, conglomerate, and carbonate oil reservoirs.6–8Commonly used polymers in the EOR are in the form of powders, emulsions and solutions.9,10 Polymer powders are favoured by their small volume, easy transportation and low price, but also criticized due to their overwhelmingly high requirement on the drying temperature during synthesis that may lead to polymer branching and crosslinking, and thus resulting in low dissolution rate, poor homogeneity and weak tackifying effect.11,12 Moreover, the application of polymer powders in offshore oil fields is significantly limited due to huge investment and large site area required for polymer dissolution and maturation.13–15 In addition, high viscosity of the polymers are not sufficient to enlarge the sweep volume in case of heterogeneous reservoirs.16 Profile modification agents including polymer gels and microspheres can be added during polymer flooding,17–19 however, the adsorption and retention of crosslinking agents make it difficult for the in situ gels to work in areas far from the wellbore.20 Although gel particles can be transported into in-depth reservoirs and can improve sweep profile to some extent, the required strict matching between complicated pore structure and particle size hinder the application of pre-crosslinked gel particles.21,22 Therefore, it is necessary to develop an efficient oil displacement system that is not only capable of being dissolved rapidly, but can also function well in in-depth profile modification and oil displacement, so as to further expand the sweep volume.
Viscosity of aqueous phase can increase with the dissolution of polyacrylamide (PAM) molecules.23,24 Conformance control and oil displacement in the reservoir becomes better if water viscosity can be gradually increased with slow releasing PAM.25–27 Core–shell-protected nanostructures and polyelectrolyte complex nanoparticles are effective methods to encapsulate AM for controlled release.28–32 Inverse emulsion polymerization of an aqueous acrylamide solution and copolymerized polystyrene nanolayer coating as a hydrophobic protective shell have also been reported as a controlled polymer release system,33–36 however complex synthetic processes and high cost limits their scale up in oil fields.
We herein, investigate an emulsion encapsulating high-molecular-weight polyacrylamide-based polymer named, GF-1, that is generated from inverse phase micro-emulsion copolymerization with an aim to slowly increase aqueous viscosity. This polymer is initially present in water-in-oil (w/o) kind of emulsion and transforms into oil-in-water (o/w) emulsion with continuous injection of formation water and phase inversion leading to increased viscosity and achieving in-depth profile modification and oil displacement. We envisage that, the rapid dissolution rate of the emulsion polymer can significantly be appreciated in the offshore reservoirs.
We have further investigated this polymer system in confined and unconfined spaces, which can be further considered for EOR. Static performance evaluation and dynamic displacement experiments were combined to compare the performance of the emulsion polymer and the corresponding dehydrated polymer powders, in terms of microscopic morphology, dissolution rate, aging characteristics, and rheological properties. Interestingly, some of the important features of our experiments include: (1) GF-1 had high dissolution rates, increased viscosity, viscoelasticity, and plugging capacity with aging time; (2) the plugging analysis showed four-fold increase in the dimensionless breakthrough pressure of the GF-1 and five-fold increase in the residual resistance factor after five days of aging, confirming significant increase in viscosity in confined spaces; and (3) the parallel core flooding experiments impressively exhibited a higher recovery factor of 2.7% more than the conventional polymer under similar injected viscosity. We believe that GF-1 is a promising material in achieving enhanced oil recovery using in-depth profile modification in future oilfield development.
2. Materials and experiment
2.1 Chemicals and materials
| Ion | Na+/K+ | Mg2+ | Ca2+ | HCO3− | CO32− | Cl− | SO42− | Total salinity |
| Content (mg L−1) | 489.9 | 17.0 | 72.1 | 414.9 | 63.0 | 602.6 | 19.2 | 1678.7 |
| Components | Composition, wt% |
|---|---|
| Saturates | 47.86 |
| Aromatics | 33.35 |
| Resins | 12.50 |
| Asphaltenes | 6.29 |
2.2 Experiments
![[thin space (1/6-em)]](https://www.rsc.org/images/entities/char_2009.gif) :
:![[thin space (1/6-em)]](https://www.rsc.org/images/entities/char_2009.gif) 0, 3
0, 3![[thin space (1/6-em)]](https://www.rsc.org/images/entities/char_2009.gif) :
:![[thin space (1/6-em)]](https://www.rsc.org/images/entities/char_2009.gif) 1, and 1
1, and 1![[thin space (1/6-em)]](https://www.rsc.org/images/entities/char_2009.gif) :
:![[thin space (1/6-em)]](https://www.rsc.org/images/entities/char_2009.gif) 1, which were placed on the microscopic glass slides and observed with an inverted Eclipse Ti-E Nikon laser confocal microscope (Nikon Instruments, US). The emulsion type is easily distinguished because only dyed oil appeared coloured under the laser.
1, which were placed on the microscopic glass slides and observed with an inverted Eclipse Ti-E Nikon laser confocal microscope (Nikon Instruments, US). The emulsion type is easily distinguished because only dyed oil appeared coloured under the laser.
 | (1) |
 | (2) |
3. Results and discussion
3.1 Characterization, morphology, and droplet size distribution
Fourier transform infrared (FTIR) spectrum of the emulsion polymer, GF-1 was obtained at room temperature to analyse the characteristic functional groups in the 500–4000 cm−1 range (Fig. S1 (ESI)†). A broad peak at about 3436 cm−1 indicated the presence of amide–NH2 groups in the polymer forming hydrogen bonds with water molecules. Strong peak at 2921 cm−1 revealed the presence of methylene groups in the polymer. The peak around 1736 cm−1 was attributed to the C![[double bond, length as m-dash]](https://www.rsc.org/images/entities/char_e001.gif) O stretching in the amide functional groups present in the polymer. While the peaks around 1459 cm−1 were due to the presence of –CH2 and tertiary amines (N–(CH3)3) in the polymer. Lastly, the peak at 1113 cm−1 appeared as a result of C–C bond in the polymer.
O stretching in the amide functional groups present in the polymer. While the peaks around 1459 cm−1 were due to the presence of –CH2 and tertiary amines (N–(CH3)3) in the polymer. Lastly, the peak at 1113 cm−1 appeared as a result of C–C bond in the polymer.
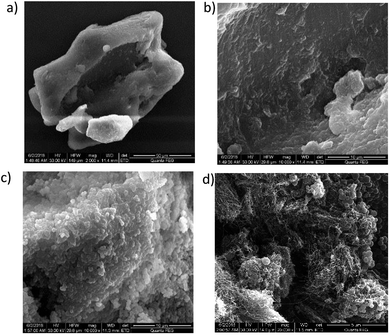
Fig. 2 shows SEM results on the microstructures of emulsion polymer (GF-1) and conventional polymer powders. Conventional polymer powders were observed to be flaky and blocky under microscopes with both large and small magnification, and they had smooth, flat surfaces (Fig. 2a and b). In contrast, the emulsion polymer featured small spherical particles attached on the surface, with diameters of several hundred nanometres. Acrylamide aggregates were included in the emulsion polymer (Fig. 2c), and the exposed solid surface contained fibrous filaments in addition to small spheres (Fig. 2d). The special surface of emulsion polymer may be attributed to the emulsifier which imparts amphiphilic groups, reducing the interface energy and making polymer surface rough due to interaction at oil–polymer interface. More images are available in ESI (Fig. S3 and S4).†
Fig. 3 shows difference in TEM images taken for emulsion polymer and conventional polymer. Emulsion polymer has dense acrylamide-packed pendant droplets attached in the polymer network, as shown in Fig. 3a. In contrast, the conventional polymer displays sparse network structure (Fig. 3b). The chain of emulsion polymer is thicker than the conventional polymer. These special features indicate emulsion polymer to have unique properties.
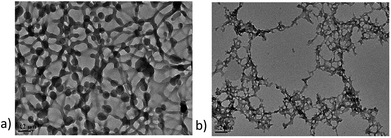 | ||
| Fig. 3 TEM images of emulsion polymer, GF-1 and conventional polymer. (a) Emulsion polymer with the concentration of 2000 ppm; (b) conventional polymer with the concentration of 2000 ppm. | ||
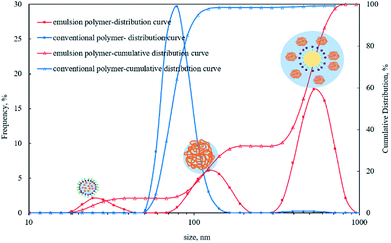
Three peaks were observed in the particle size distribution curve of emulsion polymer, as shown in Fig. 4. The first peak appeared below 50 nm, which was due to micelle formation on addition of emulsifier. The second peak was seen around 100 nm, which can be attributed to the aggregated and swollen polymer molecules; and the third peak appeared around 500 nm, which is due to the oil droplets formed via phase inversion.38 Fig. 4 also shows that there was only one peak around 70 nm in the particle size distribution curve of conventional polymer solution appearing as a result of coiled polymer molecules. The thickness of hydration film in emulsion polymer with surfactant was larger than that of conventional polymer leading to larger aggregated polymer molecules. SEM analysis of the dry samples also confirms the presence of particles that were several hundred nanometres in size. Both studies suggest better dispersion in case of emulsion polymer, which was significantly different from the conventional polymer solution.
3.2 Dissolution rate of emulsion polymer and conventional polymer
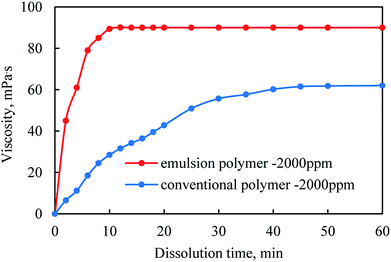
By measuring the viscosity of the supernatant, the dissolution rates of the conventional polymer powder and the emulsion polymer, GF-1 were respectively determined. As shown in Fig. 5, the viscosity of emulsion polymer first increased as the stirring went on, but stopped increasing after stirring for 10 minutes, which was 40 minutes for the conventional polymer powders. Therefore, it could be inferred that the dissolution rate of the emulsion polymer should be much faster than that of the conventional polymer powders.When polymer powders were added into the aqueous solution, water molecules would infiltrate into polymer particles, leading to their volumetric expansion. Since polymer molecules were of high weight, they had much larger molecule sizes than the water counterparts, and thus lower dispersion rate due to the interaction between macromolecular chains.39,40 Fig. 5 shows that the dissolution time of the emulsion polymer was much shorter than that of the conventional polymer powders in the condition that they were of the same mass, which could be attributed to the larger contacting area of emulsion polymer with aqueous solution due to its larger specific surface area.
3.3 Concentration–viscosity curves of emulsion polymer (GF-1) and conventional polymer
As shown in Fig. S2 (ESI),† the viscosity increased as the concentration grew, but the viscosity of emulsion polymer was always greater than that of conventional polymers in the condition with the same concentration. Given their similar relative molecular weights and no special functional additions, the larger viscosity of emulsion polymer was ascribed to the more enhanced intermolecular interaction in the emulsion polymer due to the dispersion of micro-emulsion droplets generated during the formation of the inverse emulsion.3.4 Aging characteristics and rheological properties
As shown in Fig. 6, the two systems with different polymers shared similar variation trends at low concentrations (1000 ppm), first increasing to the peak in one day and then becoming stable. The increasing part was attributable to the formation of hydration films surrounding the polymer molecules immediately after the polymers were dissolved, hindering the intertwining of polymer molecules.41 As the aging time went on, the polymer molecular chains were fully entangled, thus resulting in the stable viscosity.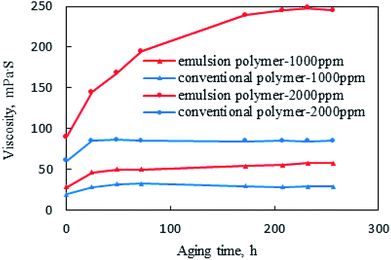 | ||
| Fig. 6 Viscosity variations with aging time for emulsion polymer (GF-1) solution and conventional polymer solution. | ||
However, as the concentration was increased, the viscosity of the emulsion polymer significantly rose with time, reaching the peak and keeping stable after 8 days, which was as large as 2.7 times of the initial viscosity. Contrastingly, the viscosity of conventional polymer became stable after 1 day of aging and increased to 1.5 times of the initial viscosity. In addition, the enhanced viscosity could also be ascribed to the continuously released polyacrylamide due to the swelling and breaking of small droplets in the emulsion polymer.42,43
The rheological property curves of the emulsion polymer (GF-1) solution with a concentration of 2000 ppm under different aging time are shown in Fig. 7. The viscosity of the emulsion polymer at different shear rates increased with the growing aging time, which was more obvious at low shear rates. An increase in the shear rate could result in the decrease in the viscosity of the emulsion polymer, which was always true disregard the aging time.
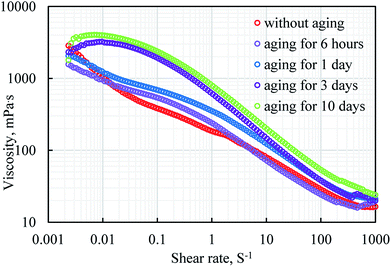 | ||
| Fig. 7 Rheological property curves of emulsion polymers (GF-1) solution with a concentration of 2000 ppm under different aging time. | ||
In general, the rheological property curve of GF-1 was approximately linear in the double logarithmic coordinate system, exhibiting the characteristics of power-law fluids.44,45 However, as the aging time increased, the slope of the rheological curve at low shear rates became gentle, and Newtonian flow behaviour was observed at low shear rates, which indicates polymer molecules are in the state of disordered Brownian motion at this shear rate. At low shear rate the shear stress is not sufficient to break the intermolecular interactions between polymer chains. Shear-thinning flow behaviour were observed with increasing shear rates because shear destroyed the mutual hooking and entanglement between the molecular chains, leading to low viscosity. As shear rate continuously increased, Newtonian flow behaviour appeared for fresh emulsion polymer because polymer coils were completely deformed, and viscosity keep constant. All results indicate that interactions between the polymer molecules increased with aging time.
As shown in Fig. 8, GF-1 exhibited increasingly obvious viscoelastic characteristics with the increase of aging time. G′ and G′′ were the store modulus and loss modulus of the solution, respectively, representing the elasticity and viscosity of the system. G′′ of fresh emulsion polymer (GF-1) was always larger than G′, which suggested viscosity to be the dominant property of the system. Meanwhile, G′ of fresh emulsion was much smaller than that of other aged solutions. G′′ of fresh emulsion polymer (GF-1) was always larger than G′, which suggested viscosity to be the dominant property of the system. Meanwhile, G′ of fresh emulsion was much smaller than that of other aged solutions. As the store modulus was defined as the ratio of the elastic stress to strain, the result indicated elasticity of fresh emulsion is small because weak intermolecular forces cannot store energy. As the aging time increased, both store modulus and loss modulus increasing with aging time, it was obviously for solutions aging before 3 days. Moreover, the intersection of G′ and G′′ moved to the left with aging time. The store modulus was higher than loss modulus after the intersection, which indicating the system dominantly exhibited elasticity when its frequency was greater than the oscillation frequency corresponding to the intersection point.46,47
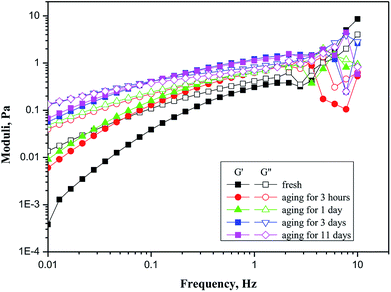 | ||
| Fig. 8 Modulus curves corresponding to different aging time of an emulsion polymer (GF-1) solution with a concentration of 2000 ppm. | ||
The aging time increasing caused phase inversion fully completed, released polymer made the molecular or inter particle forces become lager than the external applied force. The aged solution had some capacity to store energy and should be able to return after applied force disappearing.
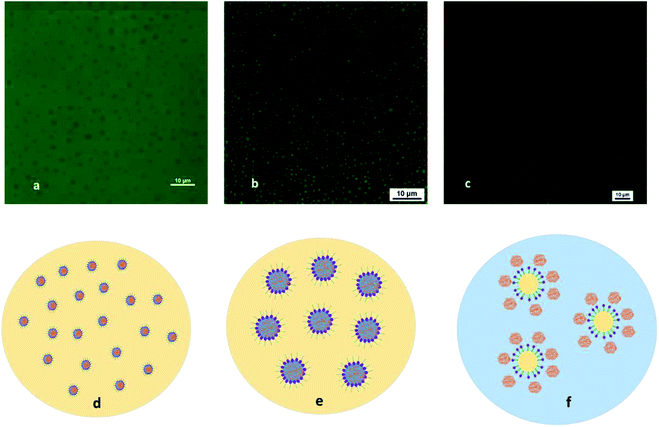
Unlike conventional emulsions, emulsion polymer is invisible with regular microscope because the sized of the dispersed droplets is hundred nanometres and they are transparent in nature. Therefore, a laser confocal microscope is adopted to observe the emulsion morphology. Laser confocal images of emulsion polymer (GF-1) and mechanism of polymer swelling and phase inversion are presented in Fig. 9. We had dyed the oil phase with fluorescein dye, therefore the oil was green in colour under the laser light. Fig. 9a shows emulsion polymer in original state and it is dispersed in oil phase. The polar head of the surfactant surrounds the polymer surface (dark spots), while the non-polar tail stretches into oil phase (green), also shown in Fig. 9d. With continuous injection of water in emulsion polymer, the emulsion polymer starts becoming darker under the laser (Fig. 9b). The micelles containing polymer molecules swell rapidly leading to quick phase inversion, as shown in Fig. 9b and c. Further injection of water leads to darkening of the emulsion polymer (Fig. 9c). The oil droplets appear, and water becomes the continuous phase. Polymer dissolves in the water and there is gradual increase in the viscosity of the solution. The mechanism can be seen in Fig. 9d–f. The phase inversion happens instantaneously, and Fig. 9e shows the transition state with swollen polymers before phase inversion. There is an increase in viscosity after phase inversion since polymer chain rearrange themselves in aqueous phase.48 This is the reason that emulsion polymer shows special aging characteristics compared to the conventional polymer.
3.5 Effect of aging time on the plugging property
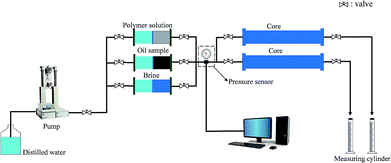
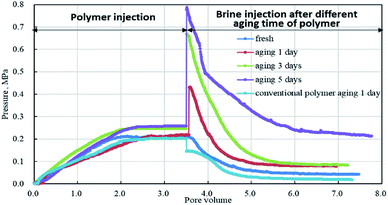
There was a total of five groups of experiments, in which the emulsion polymer solution (GF-1) and the conventional polymer solution were injected separately, and the breakthrough pressure (i.e. the maximum pressure) and the residual resistance factors were measured with brine after aging for different days. The pressure change in the whole process was shown in Fig. 10. Due to the similar viscosity of the polymer injected, the injection pressure curve did not differ much, with all the injection pressure reaching the steady state after the injection of 2 PV polymer solution. However, specific to the emulsion polymer, the breakthrough pressure of subsequent water flooding after different aging time varied greatly.With the increase of aging time, the breakthrough pressure of subsequent water flooding gradually increased, with the maximum value reaching 3 times of the GF-1 injection pressure, indicating the effective plugging role of the emulsion polymer after aging. In contrast, the viscosity of the conventional polymers peaked after 1 day of aging, and thus water flooding was implemented after 1 day. However, the maximum pressure in the water flooding was less than the pressure during the polymer flooding, and the pressure in the later period of water flooding dropped rapidly.
As shown in Fig. 11, the breakthrough pressure and residual resistance factor of emulsion polymer (GF-1) solution were always higher than those of conventional polymer solution, which was because of the more retained droplets of the microemulsion dispersed in the emulsion polymer in the core, increasing the displacement resistance.49 With the increasing aging time of the emulsion polymer (GF-1) in the core, the breakthrough pressure and the residual resistance factor of the subsequent water flooding also increased. Therefore, it could be inferred that the continuous swelling and releasing of the polyacrylamide should be inevitable even in the porous medium, which would lead to the enhanced in situ viscosity of GF-1 in the core, resulting in the increasing breakthrough pressure and residual resistance factor of subsequent water flooding. Accordingly, this could be applied for in-depth profile modification and oil displacement.
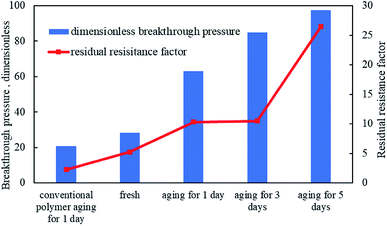 | ||
| Fig. 11 Dimensional breakthrough pressure and residual resistance factor of emulsion polymer (GF-1) and conventional polymer under different aging time. | ||
As the system migrated in the oil reservoir, GF-1 emulsion continuously swelled and released, elevating the viscosity of the system, which would reach the maximum in the deep part of the oil reservoir. Thus, in-depth profile modification and oil displacement was achieved, which was superior to traditional gel that merely worked in the vicinity of the wellbore.50,51
3.6 Oil displacement by emulsion polymer and conventional polymer in heterogenous cores
As shown in Table 3, the emulsion polymer, GF-1 with a smaller dosage could increase the total recovery factor by 2.7% compared with the conventional polymer. Moreover, the emulsion polymer contributed to a recovery factor of 6.9%, higher than that of conventional polymer in the low permeability cores under similar viscosity conditions. Low permeability zone is the most difficult to develop in petroleum industry. Displaced phase, even for polymer flooding cannot easily enter into it because of high flow resistance. The significantly incremental recovery factor of low permeability core suggests better profile control performance of the emulsion polymer.| Injection solution | Oil recovery by the water flood, % | Overall oil recovery, % | Incremental oil recovery by the polymer flood | ||||||
|---|---|---|---|---|---|---|---|---|---|
| HPCa | LPCb | Total | HPC | LPC | Total | HPC | LPC | Total | |
| a HPC = high permeability core.b LPC = low permeability core. | |||||||||
| Emulsion polymer | 45.26 | 12.26 | 30.47 | 67.11 | 49.76 | 58.74 | 21.85 | 37.50 | 28.27 |
| Conventional polymer | 46.45 | 13.82 | 31.85 | 67.83 | 44.47 | 57.38 | 21.38 | 30.65 | 25.53 |
However, the incremental recovery was only 0.5% in the high permeability cores, which means it has similar recovery factor with the conventional polymer under full sweep conditions. Even though emulsion polymer (GF-1) solution contained some surfactant as emulsifier, but high interfacial tension between oil and solution (5 mN m−1) was insufficient to mobilize trapped oil. It can be concluded that oil recovery enhancement by GF-1 is dependent on swept volume enlargement.
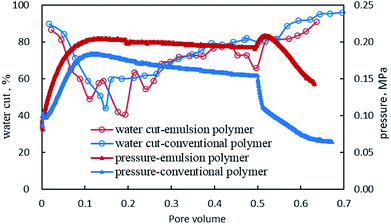
Given the similar characteristic curves of GF-1 and conventional polymer in the process of water flooding, only the pressure and water content curves corresponding to the polymer flooding and subsequent water flooding were drawn, as shown in Fig. 12. The injection pressure of the emulsion polymer, GF-1 was slightly higher than that of the conventional polymer with equal viscosity, and the emulsion polymer could quickly reach a steady state and remain stable. However, as for conventional polymers, the two-phase percolation resistance decreased in the displacement process, due to the reducing oil content, which made it impossible for the system to achieve mobility control by the viscosity of the system.52–54 In this case, the emulsion polymer functioned well, as the dispersed droplets on the surface of emulsion polymer could be adsorbed and retained in the core, continuing to expand the swept volume.
The system was placed for three days, after which the pressure was held to the level corresponding to the end of polymer flooding. Then, water flooding was implemented. The pressure of the water flooding subsequent to conventional polymer flooding was found to be different from that subsequent to emulsion polymer flooding. The former one dropped sharply and finally stabilized at a low value. Contrastingly, the later one first rose, indicating the rising in situ viscosity of the system in the core, and then declined, finally reaching a level greater than the initial injection pressure, suggesting large residual resistance caused by the adsorption retention of emulsion polymer in the core. Therefore, the emulsion polymer was more favorable for the in-depth profile modification and oil displacement.
Differing from the V-shaped water cut curve of the conventional polymer flooding, the U-shaped one of the emulsion polymer flooding indicated a much longer period of low water cut. Moreover, the depression in the curve of water flooding subsequent to the emulsion polymer flooding corresponded to the pressure increase process, indicating the positive role of the growing in situ viscosity of emulsion polymer in effectively blocking high-permeability channels, so that the subsequent water injection could continue to expand the swept volume in the core and displace more oil.
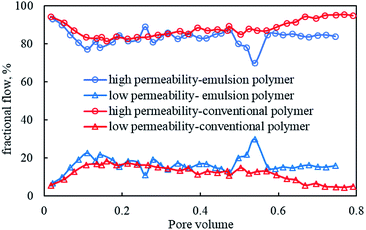
Fig. 13 shows the fractional flow curves of emulsion polymer (GF-1) solution and conventional polymer solution in the displacement process. During the polymer flooding, emulsion polymer flooding outmatched the conventional polymer flooding, in terms of higher fractional flow rates that meant the entrance of more fluids into the low permeability core. This could be ascribed to the absorption and retention of more dispersed droplets in the GF-1 in the high-permeability core, which lowered the relative permeability, enhanced the flow resistance of the displacement phase and thus contributed to the higher injection pressure than that of conventional polymer flooding (Fig. 12), although the two polymer solutions shared similar viscosity. Consequently, the sweep efficiency in the low permeability core got improved. Moreover, there was significantly more liquid absorption in the low-permeability core flooded by the GF-1 than that by the conventional polymer, which again demonstrated the positive role of elevated in situ viscosity of GF-1 in significantly improving the sweep profile.
4. Conclusion
In this study, we have utilized a high-molecular-weight modified polyacrylamide-based polymer (GF-1) that is encapsulated in water-in-oil emulsion for controlled polymer release towards enhanced oil recovery. The performance of this emulsion polymer was compared with the conventional polyacrylamide in terms of its microscopic morphology, dissolving capacity, concentration–viscosity relationship and rheological properties. Core flooding experiments were conducted to test the plugging capacity and oil displacement efficiency of the emulsion polymer. Interestingly, our results reveal special morphology of GF-1, featuring fibrous filaments bound to nanosized spheres, high dissolution rates, and increased viscosity. Laser confocal images of GF-1 and dynamic light scattering studies explain the swelling behaviour of polymer micelles and gradual release of polymer after phase inversion. This inversion is responsible for its increased viscosity, viscoelasticity and plugging capacity with aging time. The plugging analysis showed four-fold increase in the dimensionless breakthrough pressure of GF-1 and five-fold increase in the residual resistance factor after five days of aging, confirming significant increase in viscosity in confined spaces. Impressively, our parallel core flooding experiments exhibit a higher recovery factor of 2.7% more than the conventional polymer under same injection viscosity. Especially for the low permeability core, incremental recovery factor of 6.9% indicates controlled polymer releasing GF-1 works well for in-depth profile modification. We believe that GF-1 clearly meets industrial requirement of an ideal polymer and is a promising material to achieve enhanced oil recovery using in-depth profile modification in future oilfield related efforts.Conflicts of interest
There are no conflicts to declare.Acknowledgements
The authors would like to thank the Major National Science and Technology Project of China (Grant No. 2016ZX05025-003-010) and the grant from China University of Petroleum, Beijing (No. 01JB0585) for the financial support during this research.References
- See: https://www150.statcan.gc.ca.
- See: https://oilprice.com.
- S. Park, E. S. Lee and W. R. W. Sulaiman, J. Ind. Eng. Chem., 2015, 21, 1239–1245 CrossRef CAS.
- J. J. Sheng, B. Leonhardt and N. Azri, J. Can. Pet. Technol., 2015, 54, 116–126 CrossRef CAS.
- E. Delamaide, A. Zaitoun, G. Renard and R. Tabary, SPE Reservoir Eval. Eng., 2014, 17, 340–354 CrossRef.
- D. Wang, H. Dong, C. Lv, X. Fu and J. Nie, SPE Reservoir Eval. Eng., 2009, 12, 470–476 CrossRef CAS.
- Z. Liu, Y. Li, J. Lv, B. Li and Y. Chen, J. Pet. Sci. Eng., 2017, 152, 267–274 CrossRef CAS.
- H. Gong, H. Zhang, L. Xu, K. Li, L. Yu, Y. Li and M. Dong, RSC Adv., 2017, 7, 39564–39575 RSC.
- F. Candau and J. Selb, Colloid Interface Sci., 1999, 79, 149–172 CrossRef CAS.
- H. S. Kolla, P. Watson, Y. Wu, A. R. Patel, R. Robinson, L. Jackson and M. Nair, SPE Heavy Oil Conference Canada, SPE-157885, Calgary, Alberta, Canada, 2012 Search PubMed.
- D. P. Gates, S. A. Svejda, E. Oñate, C. M. Killian, L. K. Johnson, P. S. White and M. Brookhart, Macromolecules, 2000, 33, 2320–2334 CrossRef CAS.
- S. Jouenne, A. Klimenko and D. Levitt, SPE Improved Oil Recovery Conference, SPE-179631, Tulsa, Oklahoma, USA, 2016 Search PubMed.
- X. Kang and J. Zhang, SPE Heavy Oil Conference Canada, SPE-165473, Calgary, Alberta, Canada, 2013 Search PubMed.
- L. Shi, S. Zhu, J. Zhang, S. Wang, X. Xue, W. Zhou and Z. Ye, Pet. Sci., 2015, 12, 129–134 CrossRef CAS.
- D. H. Kim, D. Alexis, P. New, A. C. Jackson, D. Espinosa, T. J. Isbell, A. Poulsen, D. McKilligan, M. Salman, T. Malik and S. Thach, SPE Annual Technical Conference and Exhibition, SPE-191391, Dallas, Texas, USA, 2018 Search PubMed.
- R. S. Seright, G. Zhang, O. O. Akanni and D. Wang, J. Can. Pet. Technol., 2012, 51, 393–402 CrossRef CAS.
- K. S. M. El-Karsani, A. Ghaithan, G. A. Al-Muntasheri and I. A. Hussein, SPE J., 2014, 19, 135–149 CrossRef.
- D. Zhu, B. Bai and J. Hou, Energy Fuels, 2017, 31, 13063–13087 CrossRef CAS.
- S. Zhao, W. Pu, B. Wei and X. Xu, Fuel, 2019, 235, 249–258 CrossRef CAS.
- R. Barati and J. Liang, J. Appl. Polym. Sci., 2014, 131, 40735 CrossRef.
- H. Yan, W. Kang, X. Yin, X. Tang, S. Song, Z. A. Lashari, B. Bai and B. Sarsenbekuly, Powder Technol., 2017, 313, 191–200 CrossRef.
- M. O. Elsharafi and B. Bai, Ind. Eng. Chem. Res., 2012, 51, 11547–11554 CrossRef CAS.
- Y. Arryanto and L. S. Bark, Analyst, 1991, 116, 1149–1153 RSC.
- W. Zhao, H. Wang and Y. Wang, Soft Matter, 2018, 14, 4178–4184 RSC.
- H. Lv and Y. Feng, Study on associative polymerizable inverse microemulsion, J. Macromol. Sci., Part A: Pure Appl.Chem., 2008, 45, 372–380 CrossRef.
- C. Berkland, M. Cordova, J. T. Liang and G. P. Willhite, US Pat. 7644764, 2010.
- J. Qiu, H. Wang, Z. Du, X. Cheng, Y. Liu and H. Wang, J. Appl. Polym. Sci., 2018, 135, 46298 CrossRef.
- L. Bai, J. Cu, S. Huan and Z. Li, RSC Adv., 2014, 4, 27363–27380 RSC.
- M. Veisi, S. Johnson, K. Shafer-Peltier, J. T. Liang, C. Berkland, M. Chen and R. Barati, J. Appl. Polym. Sci., 2019, 136, 47225 CrossRef.
- R. A. Ramli, W. A. Laftah and S. Hashim, RSC Adv., 2013, 3, 15543–15565 RSC.
- Y. Liu, J. Goebl and Y. Yin, Chem. Soc. Rev., 2013, 42, 2610–2653 RSC.
- M. Shaban, J. Poostforooshan and A. P. Weber, J. Mater. Chem. A, 2017, 35, 18651–18663 RSC.
- F. Candau and J. Selb, Adv. Colloid Interface Sci., 1999, 79, 149–172 CrossRef CAS.
- Y. Tamsilian, A. R. SA, M. Shaban, S. Ayatollahi, J. C. de la Cal, J. J. Sheng and R. Tomovska, Energy Technol., 2016, 4, 1035–1046 CrossRef CAS.
- N. Nikmaram, S. Roohinejad, S. Hashemi, M. Koubaa, F. J. Barba, A. Abbaspourrad and R. Greiner, RSC Adv., 2017, 7, 28951–28964 RSC.
- R. A. Gelman, J. C. Harrington and K. A. Vaynberg, Langmuir, 2008, 24, 12727–12729 CrossRef CAS PubMed.
- L. Li, H. Wang, M. Lv, Y. Feng and F. Li, China Patent, CN105504157B, 2017.
- R. Cordero, A. Jawaid, M. S. Hsiao, Z. Lequeux, R. A Vaia and C. K. Ober, ACS Macro Lett., 2018, 7, 459–463 CrossRef CAS.
- B. A. Miller-Chou and J. L. Koenig, Prog. Polym. Sci., 2003, 28, 1223–1270 CrossRef CAS.
- C. Kingston, R. Zepp, A. Andrady, D. Boverhof, R. Fehir, D. Hawkins, J. Roberts, P. Sayre, B. Shelton, Y. Sultan and V. Vejins, Carbon, 2014, 68, 33–57 CrossRef CAS.
- B. Abu-Jdayil, Int. J. Miner. Process., 2011, 98, 208–213 CrossRef CAS.
- R. Pal, AIChE J., 1996, 42, 3181–3190 CrossRef CAS.
- S. Nandi and H. H. Winter, Macromolecules, 2005, 38, 4447–4455 CrossRef CAS.
- Z. Hu, M. Haruna, H. Gao, E. Nourafkan and D. Wen, Ind. Eng. Chem. Res., 2017, 56, 3456–3463 CrossRef CAS.
- M. Lotfollahi, R. Farajzadeh, M. Delshad, A. K. Al-Abri, B. M. Wassing, R. Al-Mjeni, K. Awan and P. Bedrikovetsky, SPE J., 2016, 21, 1178–1191 CrossRef.
- B. Sarsenbekuly, W. Kang, H. Fan, H. Yang, C. Dai, B. Zhao and S. B. Aidarova, Colloids Surf., A, 2017, 514, 91–97 CrossRef CAS.
- B. Sarsenbekuly, W. Kang, H. Yang, B. Zhao, S. Aidarova, B. Yu and M. Issakhov, Colloids Surf., A, 2017, 532, 405–410 CrossRef CAS.
- R. Zaleski, P. Krasucka, K. Skrzypiec and J. Goworek, Macromolecules, 2017, 50, 5080–5089 CrossRef CAS.
- L. Yu, M. Dong, B. Ding and Y. Yuan, Chem. Eng. Sci., 2018, 178, 335–347 CrossRef CAS.
- C. Zhong, L. Jiang and X. Peng, J. Polym. Sci., Part A: Polym. Chem., 2010, 48, 1241–1250 CrossRef CAS.
- B. Brattekås, S. G. Pedersen, H. T. Nistov, A. Haugen, A. Graue, J. Liang and R. S. Seright, SPE Prod. Oper., 2015, 30, 99–109 Search PubMed.
- Y. Zhu, W. Gao, R. Li, Y. Li, J. Yuan, D. Kong, J. Liu and Z. Yue, Acta Pet. Sin., 2018, 39, 189–200 Search PubMed.
- H. Koh, V. B. Lee and G. A. Pope, SPE J., 2018, 23, 1–17 CrossRef CAS.
- R. S. Seright, D. Wang, N. Lerner, A. Nguyen, J. Sabid and R. Tocher, SPE J., 2018, 23, 2260–2278 CrossRef.
Footnote |
| † Electronic supplementary information (ESI) available: FTIR spectrum, concentration–viscosity curve, SEM images. See DOI: 10.1039/c9ra00465c |
| This journal is © The Royal Society of Chemistry 2019 |

