 Open Access Article
Deposition of platinum on boron-doped TiO2/Ti nanotube arrays as an efficient and stable photocatalyst for hydrogen generation from water splitting†
Mengjia Suna,
Yanli Jiang *b,
Mei Tian*ab,
Huijun Yanb,
Ran Liub and
Lijuan Yangb
aSchool of Chemistry and Materials Science, Heilongjiang University, Harbin 150080, P. R. China
bDepartment of Chemistry, Harbin University, Harbin, 150086, P. R. China. E-mail: jylzhl@163.com; shl913@vip.sina.com
First published on 11th April 2019
Abstract
An efficient photocatalyst of boron-doped titanium dioxide/titanium nanotube array-supported platinum particles (Pt–B/TiO2/Ti NTs) was fabricated for photocatalytic water splitting for hydrogen production through a two-step route. First, B/TiO2/Ti NTs were prepared by anodic oxidation using hydrofluoric acid as electrolyte and boric acid as a B source. Then, Pt particles were deposited on the surface of B/TiO2/Ti NTs by photo-assisted impregnation reduction. The structure and properties of Pt–B/TiO2/Ti NTs were characterized by various physical measurements which showed the successful fabrication of Pt–B/TiO2/Ti NTs. The Pt–B/TiO2/Ti NTs, with a B-doping content of 15 mmol L−1, showed the highest photocatalytic activity and exhibited a photocatalytic hydrogen-production rate of 384.9 μmol g−1 h−1, which was 9.2-fold higher than that of unmodified TiO2/Ti NTs (41.7 μmol g−1 h−1). This excellent photocatalytic performance was ascribed mainly to the synergistic effect of Pt and B, which could enhance the photocatalytic activity of TiO2/Ti NTs.
1. Introduction
The development and application of energy are important concerns worldwide. Complete reliance on fossil fuels will result in energy shortages when their supplies run out. Moreover, excessive exploitation, combustion, and consumption of fossil fuels have led to environmental concerns.1 During coal combustion, sulfur dioxide and nitrogen dioxide are produced, which results in environmental pollution. Carbon dioxide (CO2) resulting from coal-burning enters the atmosphere, which increases the CO2 concentration in air and aggravates the greenhouse effect. Therefore, looking for a new type of renewable, clean energy with large reserves and which leads to less pollution to replace traditional energy sources is a top priority worldwide.2 Hydrogen is a type of “secondary energy”. It has been described as the “ideal green energy” because of its high combustion value, reproducibility, and zero pollution. Photolysis of water for producing hydrogen is a major research direction in which water is decomposed into hydrogen and oxygen under the action of light. Thus, finding a photocatalyst with excellent hydrogen generation performance is very important. At present, several scholars worldwide are conducting research and have made progress, but there is still a long way to go.3In 1972, Fujishima discovered, for the first time, that a titanium dioxide (TiO2) single-crystal electrode can act as a photocatalyst for hydrogen generation from water splitting.4 TiO2 is a n-type inorganic photosensitive semiconductor material. It is not poisonous, does not result in secondary pollution, is inexpensive and has good photocatalytic performance.5–7 TiO2 has been studied with regard to the photolysis of water for producing hydrogen.8,9 However, due to the wide band gap of TiO2 (E0 = 3.2 eV), only ultraviolet light of wavelength <387 nm can be absorbed by TiO2. TiO2 must be modified to enhance its photocatalytic activity and strengthen the application of TiO2 photocatalysis technology. The main modification methods are deposition of precious metals,10,11 semiconductor recombination,12 fabrication of heterojunctions,13,14 non-metal doping,15,16 and metal-ion doping.17,18 Doping of non-metals can narrow the band gap of TiO2, enlarge the range of light absorption, and strengthen absorption in the visible-light region.19 At present, modification of TiO2 by doping with non-metals involves use of powder TiO2 primarily. Modification is based usually on the sol–gel method and hydrothermal synthesis, both of which can lead to secondary separation.20–22 However, simultaneous preparation of TiO2 nanotube (NT) arrays and doping of non-metals by one-step anodic oxidation can solve the problem of secondary separation efficiently.23 This method has the advantages of simple operation and high efficiency. Deposition of an appropriate amount of precious metal on a catalyst surface can aid efficient separation of photoelectrons and holes.24 If the semiconductor surface is in contact with the metal, the carriers are redistributed and electrons are transferred from the n-type semiconductor (which has a higher Fermi energy level) to the metal (which has a lower Fermi energy level) and then a Schottky barrier is formed. The latter becomes an effective “trap” for capturing excited electrons, and photogenerated carriers are separated. Thus, the recombination of electrons and holes is inhibited and the photocatalytic activity is greatly improved.25
It has been reported that boron (B) and platinum (Pt) can enhance the photocatalytic performance of TiO2 NTs to some extent.26,27 In the present study, B/TiO2/Ti NTs were fabricated by an anodic oxidation method using hydrofluoric acid as electrolyte and boric acid as a B source. Then, Pt–B/TiO2/Ti NTs were obtained through deposition of Pt particles on B/TiO2/Ti NTs. By comparing the photocatalytic activity for hydrogen production of Pt–B/TiO2/Ti NTs, B/TiO2/Ti NTs and TiO2/Ti NTs, the effect of co-modification of Pt and B on the photocatalytic performance of TiO2/Ti NTs was investigated thoroughly.
2. Experimental
2.1. Preparation of Pt–B/TiO2/Ti NTs
Two procedures were involved in fabrication of Pt–B/TiO2/Ti NTs. In the first procedure, anodic oxidation was applied to synthesize B/TiO2/Ti NTs with various amounts of B doping. This was accomplished in a two-electrode system with a Ti plate as the anode and Pt wire as the cathode. Anodization was conducted at a potential of 20 V for 90 min in 0.4 wt% HF and H3BO3 of different concentrations. Then, the samples were removed from the solution, washed with deionized water and dried at room temperature. Finally, the samples were placed in a muffle furnace and calcined at 450 °C for 2 h. Prior to use, the Ti plate was pretreated according to the literature.28In the second procedure, B/TiO2/Ti NTs were placed in a quartz reactor containing a certain concentration of H2PtCl6, and irradiated vertically with a 150 W spherical xenon lamp. The light source was separated from the samples by 10 cm, and the irradiation time was 1 h. Different Pt–B/TiO2/Ti NTs were obtained. The various B/TiO2/Ti and Pt–B/TiO2/Ti NTs were prepared as outlined in Table 1.
| Sample | Concentration of B3+ (mmol L−1) | Concentration of Pt4+ (mmol L−1) | Irradiation time (h) |
|---|---|---|---|
| B/TiO2/Ti-0 | 0 | 0 | 0 |
| B/TiO2/Ti-10 | 10 | 0 | 0 |
| B/TiO2/Ti-15 | 15 | 0 | 0 |
| B/TiO2/Ti-20 | 20 | 0 | 0 |
| Pt–B/TiO2/Ti-0 | 0 | 18.4 | 1 |
| Pt–B/TiO2/Ti-10 | 10 | 18.4 | 1 |
| Pt–B/TiO2/Ti-15 | 15 | 18.4 | 1 |
| Pt–B/TiO2/Ti-20 | 20 | 18.4 | 1 |
2.2. Physical characterization
The crystalline phases of the samples were analyzed by X-ray diffraction (XRD; Bruker, EG). The surface morphologies of the samples were characterized by scanning electron microscopy (SEM; Hitachi, S-4300). X-ray photoelectron spectroscopy (XPS; PerkinElmer, D8 advance) with Mg Kα radiation was applied to determine the elemental compositions and valence states of the samples. Ultraviolet-visible diffuse reflectance spectroscopy (UV-vis DRS) were obtained on a UV-vis spectrophotometer (PerkinElmer; Lambda 950) and the photoluminescence (PL) spectra were recorded by a fluorescence spectrophotometer (PerkinElmer; Lambda 750). In addition, surface photovoltage spectroscopy (SPS) was applied to analyze the electronic transition of the samples on a SPS apparatus (Bofeilai; PL-SPS/IPCE1000).Previously, we demonstrated formation of hydroxyl radicals in the TiO2/Ti photoelectrocatalytic oxidation system by Fe(phen)32+ spectrophotometry. We showed that hydroxyl radicals exist in the as-prepared Pt–B/TiO2/Ti NTs.29
2.3. Photocatalytic activity test
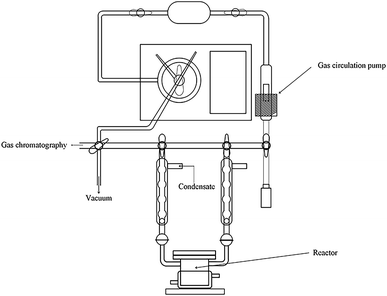
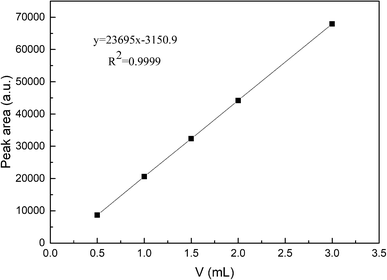
The reaction of photocatalytic water splitting for hydrogen production was carried out in an all-glass, automatic, online trace gas analysis system (Fig. 1), and the amount of hydrogen produced in the reaction was determined directly by gas chromatography. In detail, a piece of the as-prepared sample (1.5 × 2.5 cm) was placed on a homemade shelf in the reactor. Then, the sample together with shelf were placed in the reactor. Then, 80 mL of deionized water and 20 mL of methanol were added to the reactor, and the system was evacuated to 0.8 kPa. The gas chromatograph was opened and the light source was preheated. When the chromatographic temperature was stable, a current of 50 mA was applied. Nitrogen (carrier gas) flow made the system pressure > 5 kPa. Under uniform magnetic stirring, water photolysis was carried out with irradiation using a xenon lamp for 8 h. The experiment was monitored every 0.5 h, and the peak area of hydrogen was shown in a gas chromatogram. The output of hydrogen was calculated by the external standard method. The standard curve made with a hydrogen standard is shown as Fig. 2.3. Results and discussion
3.1. Material characterization
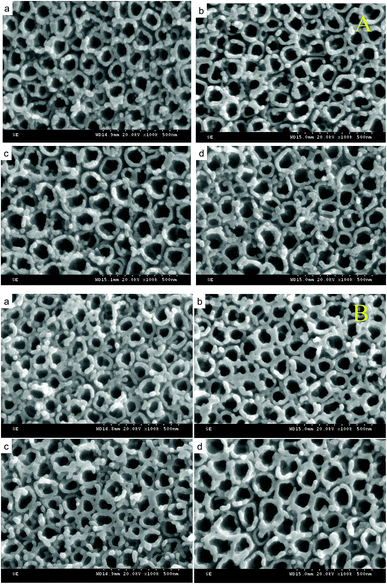
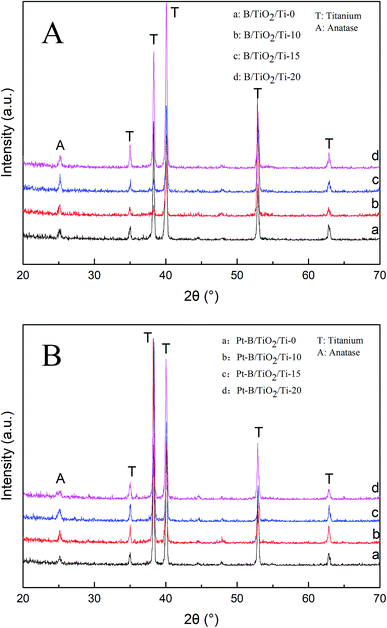
Fig. 3A shows the SEM images of TiO2/Ti NTs and various B/TiO2/Ti NTs. These images reveal that the NTs were distributed uniformly and were highly ordered. The outer diameter of the NTs was ∼120 nm and their wall was ∼30 nm. The surface roughness of the TiO2/Ti NTs doped with B was increased in comparison with that of the undoped TiO2/Ti NTs. This was because part of B3+ was not doped into the TiO2 lattice but instead covered the orifice, leading to roughness on the NT surface. Fig. 3B displays the SEM images of the various Pt–B/TiO2/Ti NTs. After deposition of Pt particles, the morphology of the NTs did not change significantly, the NTs retained an independent tubular structure, and the outer diameter of the NTs decreased to ∼80 nm.Fig. 4A shows the XRD patterns of various B/TiO2/Ti NTs. The diffraction peaks at 35.19°, 38.44°, 40.21°, 52.99° and 63.96° in each spectrum could be ascribed to the Ti substrate. The spectrum of TiO2/Ti NTs showed a diffraction peak at 25.27°, which corresponded to the (101) plane of the anatase TiO2. After doping of B3+ in TiO2, the diffraction peak of the anatase-type TiO2 remained in the same position. Further observation revealed that the strongest peak intensity was achieved for B/TiO2/Ti-15 NTs. However, the peak intensity decreased when the B-doping content increased further, indicating that excessive B-doping content had an inhibitory effect on TiO2 grains. Fig. 4B shows the XRD patterns of various Pt–B/TiO2/Ti NTs. After deposition of Pt particles on the surface of B/TiO2/Ti NTs, TiO2 NTs continued to exhibit the anatase phase. Obvious diffraction peaks of Pt were not observed, probably because Pt was in an amorphous state. The average grain size of TiO2 NTs was calculated to be 27 nm using the Scherrer formula (eqn (1)),
D = Kλ/β![[thin space (1/6-em)]](https://www.rsc.org/images/entities/char_2009.gif) cos(θ) cos(θ)
| (1) |
The XPS spectra of Pt–B/TiO2/Ti-15 NTs are exhibited in Fig. 5. Fig. 5a reveals clearly that NT surfaces were composed mainly of C, O, B, Ti and Pt. Among these elements, C was derived mainly from instrumental pollution during the test. In Fig. 5b, the 1s peak of B can be fitted to a peak at 191.15 eV, indicating that B, in the form of B3+, entered the lattice space of TiO2 and formed a Ti–O–B bond. Fig. 5c shows the XPS spectrum of O 1s, which could be fitted by three peaks at 529.45, 531.05 and 532.6 eV. Oxygen species centered at 529.45, 531.05 and 532.6 eV corresponded to the Ti–O bond in TiO2, the adsorbed OH on the surface of TiO2, and the Ti–O–B bond, respectively. In Fig. 5d, the Ti 2p1/2 peak at 463.8 eV and Ti 2p3/2 peak at 458.1 eV suggested that Ti existed mainly as Ti4+. Ti4+ reacted with O to form a Ti–O bond and, thus, formed TiO2. The Pt 4f signal (Fig. 5e) was fitted with two peaks at 76.43 and 73.03 eV, which corresponded with Pt 4f5/2 and Pt 4f7/2, respectively.
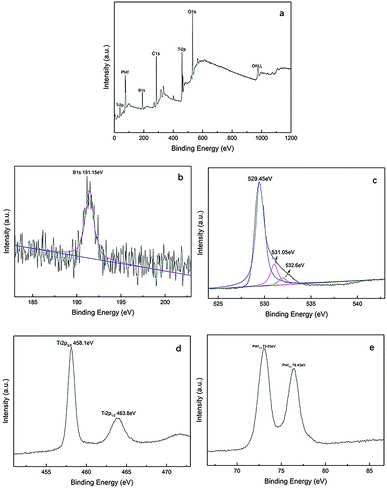 | ||
| Fig. 5 XPS spectra of Pt–B/TiO2/Ti-15 NTs, whole spectrum (a), B 1s (b), O 1s (c), Ti 2p (d) and Pt 4f (e). | ||
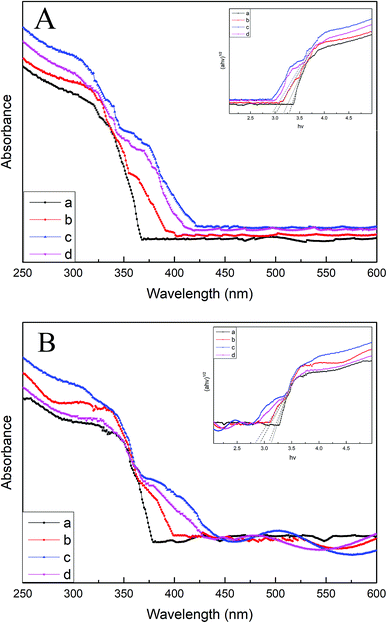
Fig. 6A and B display the UV-vis DRS spectra of various B/TiO2/Ti NTs and various Pt–B/TiO2/Ti NTs, respectively. The unmodified TiO2/Ti NTs absorbed UV light mainly of wavelength < 370 nm, which corresponded to the intrinsic absorption of the anatase-type TiO2. Compared with unmodified TiO2/Ti NTs, the light absorption of modified TiO2/Ti NTs was enhanced in the visible-light region. Pt–B/TiO2/Ti-15 NTs exhibited the strongest absorption intensity. The band gaps of TiO2/Ti NTs, various B/TiO2/Ti NTs and various Pt–B/TiO2/Ti NTs were determined according to eqn (2)
| αhν = A(hν − Eg) | (2) |
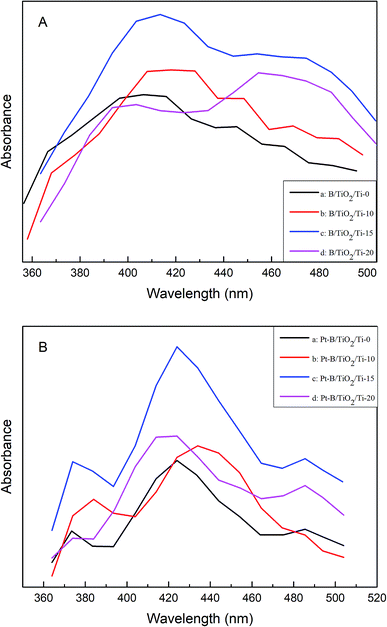
The PL spectra of various B/TiO2/Ti NTs and various Pt–B/TiO2/Ti NTs were tested at an excitation wavelength of 350 nm (Fig. 7A and B, respectively). All samples exhibited strong light emission from 400 nm to 500 nm. The PL spectra of all samples showed similar linear structures and no other peaks were observed. However, the peak intensity showed some difference. These results indicated that co-modification of Pt and B did not cause a new PL phenomenon, but did change the PL peak strength. Pt–B/TiO2/Ti-15 NTs exhibited the strongest PL peak among all samples. This was because: (i) a new impurity energy level was formed after B was doped into the TiO2 lattice; (ii) deposition of an appropriate amount of precious metal on the photocatalyst surface facilitated efficient separation of photogenerated electrons and holes. These results indicated that the PL peak intensity was correlated with the activity of the photocatalyst. In general, the stronger the FS signal, the greater the number of photogenerated carriers, and the better the photocatalytic performance.
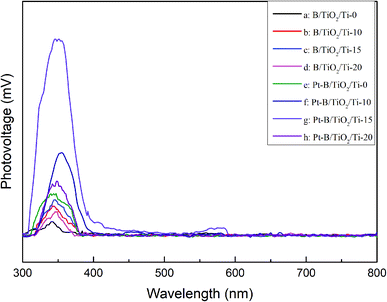
Fig. 8 displays the SPS spectra of various B/TiO2/Ti and various Pt–B/TiO2/Ti samples. All samples displayed significant photovoltaic responses at 300–400 nm. The photovoltaic responses of modified TiO2/Ti NTs were increased significantly compared with those of unmodified TiO2/Ti NTs. These results further confirmed that co-modification of B and Pt could enhance the separation ability of photogenerated carriers in TiO2 NTs and, thus, improve the photocatalytic performance of TiO2.
3.2. Photocatalytic activity
Fig. 9A and B show the photocatalytic activities with regard to hydrogen production of TiO2/Ti NTs, various B/TiO2/Ti NTs and various Pt–B/TiO2/Ti NTs. As seen from Fig. 9A, the photocatalytic hydrogen-production rate (in μmol g−1 h−1) of unmodified TiO2/Ti NTs, B/TiO2/Ti-10, B/TiO2/Ti-15, and B/TiO2/Ti-20 was 41.7, 46.8, 51.7 and 45.0, respectively. Therefore, B/TiO2/Ti NTs exhibited superior photocatalytic hydrogen-production activity over that of unmodified TiO2/Ti NTs. This finding could be because B was doped into the lattice of TiO2 to replace O and a novel impurity energy level was created above the valence band of TiO2, which narrowed the forbidden bandwidth. The impurity energy level helped to increase visible-light absorption of TiO2 significantly, thus enhancing the photocatalytic performance. After deposition of Pt particles on B/TiO2/Ti NTs, the photocatalytic activity of Pt–B/TiO2/Ti NTs was ∼10-fold higher than that of the corresponding B/TiO2/Ti NTs. Among these Pt–B/TiO2/Ti NTs, Pt–B/TiO2/Ti-15 exhibited the highest photocatalytic activity. The photocatalytic hydrogen-production rate of Pt–B/TiO2/Ti-15 NTs was 384.9 μmol g−1 h−1, which was 9.2-fold higher than that of unmodified TiO2/Ti NTs. The photocatalytic performance of the as-prepared Pt–B/TiO2/Ti NTs was superior to that of porous TiO2 fibers.30 One of the main reasons for limiting the photocatalytic hydrogen-production rate of TiO2 was that photogenerated electrons and photogenerated holes recombine readily and cannot participate effectively in the redox reaction. Deposition of Pt particles on the surface of TiO2 is a valid way to inhibit the recombination of photogenerated electrons and holes, and improve the quantum efficiency of hydrogen production. These results showed that photogenerated electrons could be transferred from a TiO2 conduction band with higher potential to Pt with lower potential after Pt made contact with TiO2, which improved the charge-separation efficiency of TiO2. Meanwhile, the Schottky barrier was formed at the interface between Pt and TiO2, which prevented the charge transferred to Pt from returning to the TiO2 substrate and decreased the recombination probability of photogenerated charges. Moreover, Pt has a smaller hydrogen-evolution overpotential, which further promotes the interfacial reaction and, correspondingly, enhances the photocatalytic performance.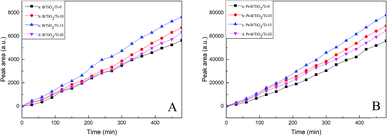 | ||
| Fig. 9 Photocatalytic activities of various B/TiO2/Ti NTs (A) and various Pt–B/TiO2/Ti NTs (B) for hydrogen production. | ||
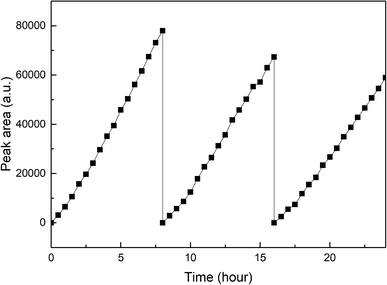
Fig. 10 exhibits the stability of photocatalytic hydrogen production on Pt–B/TiO2/Ti-15 NTs. The test was conducted under xenon-lamp irradiation for 24 h continuously and every cycle lasted 8 h. The hydrogen-producing yield after the first cycle was 154 μmol. After testing for three cycles, the hydrogen-producing yield was 117.8 μmol, which could maintain 76.5% of the first cycle. The reason for the decrease in photocatalytic hydrogen-production efficiency after catalyst recovery was that the NT structure was rough and porous. Hence, some substances adhered to the pores after one cycle, and the hydrogen-production rate decreased after one cycle.
3.3. Formation mechanism of TiO2/Ti NTs
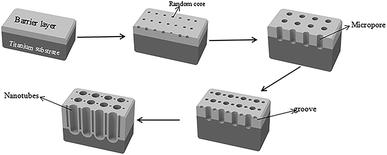
TiO2/Ti NTs were fabricated via anodic oxidation (Fig. 11). Under application of a voltage, the Ti plate dissolved to form Ti4+, and H2O in the electrolyte was ionized to form O2−. The latter reacted with Ti4+ to form an oxide film covering the surface of the Ti plate. After the barrier layer had been formed, the film layer was subjected to field-enhanced dissolution and chemical dissolution from the electric field and F−, respectively. Also, many depressions were formed on the surface of the oxide film and, then, pore nuclei were formed. The latter continued to grow into small pores in the direction of the Ti substrate under field-enhanced dissolution and chemical dissolution and, then, a porous oxide-film structure was formed. As the small pores continued to grow downwards, the unoxidized metallic Ti between the small pores formed a convex, and the electric field intensity of this part increased so that the oxide film on top of this part of the metallic Ti accelerated dissolution and formed a small-cavity structure. As the small cavities continued to grow, the small pores that were connected together originally were separated and, eventually, formed independent tubular structures.3.4. Photocatalytic mechanism of Pt–B/TiO2/Ti NTs
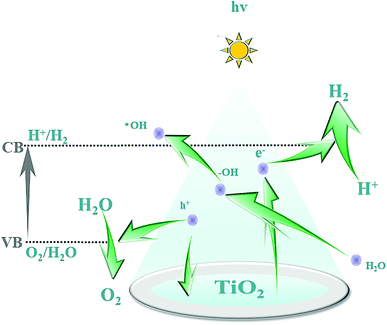
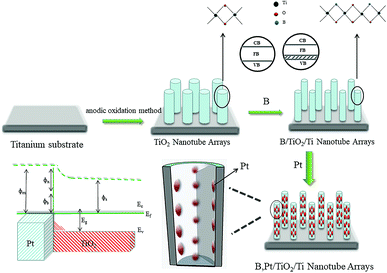
The B–O bond is formed via the sp2 hybrid orbital. B has an empty p orbital and, as an electron acceptor, the empty p orbital tends to strongly absorb foreign electrons. Hence, electrons and holes can be separated from each other effectively. Meanwhile, after hybridization of the O (2p) orbital and B (p) orbital, the valence bandwidth of TiO2 increases and the forbidden bandwidth of TiO2 decreases correspondingly. This action broadens the response range of the absorption spectrum and improves the photoelectrocatalytic efficiency further. After Pt particles are deposited on the anatase TiO2 crystals, the Eg of TiO2 becomes smaller and the Fermi level of TiO2 decreases, which reduces the recombination probability of electron–hole pairs and enhances the photocatalytic activity. The doping of B and deposition of Pt are synergistic and improve the photocatalytic performance of TiO2. Fig. 12 shows the mechanism of photocatalytic water splitting for hydrogen production. When the semiconductor material is irradiated under light whose photon energy is greater than the forbidden bandwidth of the semiconductor, the electrons in the valence band are excited to the conduction band, and free electrons and holes are formed in the conduction band and the valence band, respectively. Under the action of such photogenerated electron–hole pairs, water undergoes a redox reaction to generate hydrogen and oxygen.The photocatalytic mechanism of Pt–B/TiO2/Ti NTs is shown in Fig. 13. Elemental B was doped into the lattice of TiO2 and formed the Ti–O–B bond, which narrowed the band gap of TiO2, expanded the light-absorption range of TiO2, and increased the visible-light absorption of TiO2. Due to the difference in the Fermi energy levels of Pt and TiO2, when Pt and TiO2 came into contact, photoexcited electrons were transferred from TiO2 to Pt until their Fermi energy levels matched. The Pt surface obtained an excessive negative charge, and the TiO2 surface exhibited excessive positive charge, which resulted in “band bending” and formation of the Schottky barrier. The latter is an effective trap for capturing electrons, which can inhibit the combination of electrons and holes. Thus, the activity of the photocatalyst was highly improved.
4. Conclusions
We synthesized Pt–B/TiO2/Ti NTs by anodic oxidation and photo-deposition. Co-modification of Pt and B could reduce the outer diameter and wall thickness of TiO2 NTs. The presence of Pt and B elements resulted in formation of a novel energy level structure and surface defects. This led to a red-shift in the absorption spectrum and boosted the visible-light absorption at 350–450 nm. The photovoltaic response of PL and SPS was improved significantly, and the separation ability of photogenerated carriers in TiO2 NTs was enhanced. Pt–B/TiO2/Ti NTs with B-doping content of 15 mmol L−1 exhibited the most favorable photocatalytic performance, and showed a photocatalytic hydrogen-production rate of 384.9 μmol g−1 h−1, which was 9.2-fold higher than that of unmodified TiO2/Ti NTs (41.7 μmol g−1 h−1). These results indicated that: (i) the Pt–B/TiO2/Ti NTs we presented were feasible and efficient for photocatalytic hydrogen production; (ii) this synthetic strategy could be applied for other energy-conversion and energy-storage devices.Conflicts of interest
There are no conflicts to declare.Acknowledgements
This work was supported by the Excellent Academic Leaders Fund of Harbin Science and Technology Bureau (2016RAXXJ041) and Youth Science Foundation of Heilongjiang Province (QC2012C052).Notes and references
- S. Apak, E. Atay and G. Tuncer, Int. J. Hydrogen Energy, 2017, 42, 2446–2452 CrossRef CAS.
- M. S. Dresselhaus and I. L. Thomas, Nature, 2001, 414, 332 CrossRef CAS PubMed.
- A. Kudo and Y. Miseki, Chem. Soc. Rev., 2009, 38, 253–278 RSC.
- A. Fujishima and K. Honda, Nature, 1972, 238, 37 CrossRef CAS PubMed.
- A. J. Haider, R. H. Al Anbari, G. R. Kadhim and C. T. Salame, Energy Procedia, 2017, 119, 332–345 CrossRef CAS.
- R. Singh and S. Dutta, Fuel, 2018, 220, 607–620 CrossRef CAS.
- I. Ali, M. Suhail, Z. A. Alothman and A. Alwarthan, RSC Adv., 2018, 8, 30125–30147 RSC.
- P. Roy, S. Berger and P. Schmuki, Angew. Chem., Int. Ed. Engl., 2011, 50, 2904–2939 CrossRef CAS PubMed.
- K. Nakata and A. Fujishima, J. Photochem. Photobiol., C, 2012, 13, 169–189 CrossRef CAS.
- B. Naik, S. Y. Moon, S. H. Kim and J. Y. Park, Appl. Surf. Sci., 2015, 354, 347–352 CrossRef CAS.
- W. Nam and G. Young Han, J. Chem. Eng. Jpn., 2007, 266–269, DOI:10.1252/jcej.40.266.
- A. Wanag, E. Kusiak-Nejman, Ł. Kowalczyk, J. Kapica-Kozar, B. Ohtani and A. W. Morawski, Appl. Surf. Sci., 2018, 437, 441–450 CrossRef CAS.
- R. Tanwar, B. Kaur and U. Kumar Mandal, Appl. Catal., B, 2017, 211, 305–322 CrossRef CAS.
- R. Tanwar, S. Kumar and U. K. Mandal, J. Photochem. Photobiol., A, 2017, 333, 105–116 CrossRef CAS.
- R. T. Asahi, T. Morikawa, T. Ohwaki, K. Aoki and Y. Taga, Science, 2001, 293, 269–271 CrossRef CAS PubMed.
- F. Zhou, H. Song, H. Wang, S. Komarneni and C. Yan, Appl. Clay Sci., 2018, 166, 9–17 CrossRef CAS.
- W. Choi, A. Termin and M. R. Hoffmann, J. Phys. Chem., 1994, 98, 13669–13679 CrossRef.
- V. Kumaravel, S. Mathew, J. Bartlett and S. C. Pillai, Appl. Catal., B, 2019, 244, 1021–1064 CrossRef CAS.
- L. Gomathi Devi and R. Kavitha, RSC Adv., 2014, 4, 28265–28299 RSC.
- L. Kavan, M. Kalbác, M. Zukalova, I. Exnar, V. Lorenzen, R. Nesper and M. Graetzel, ChemInform, 2004, 16, 477–485 CAS.
- A. Matsuda, T. Matoda, T. Kogure, K. Tadanaga, T. Minami and M. Tatsumisago, Chem. Mater., 2005, 17, 749–757 CrossRef CAS.
- S. Sreekantan and L. C. Wei, J. Alloys Compd., 2010, 490, 436–442 CrossRef CAS.
- D. Gong, C. A. Grimes, O. K. Varghese, W. Hu, R. S. Singh, Z. Chen and E. C. Dickey, J. Mater. Res., 2011, 16, 3331–3334 CrossRef.
- H. E. Prakasam, K. Shankar, M. Paulose, O. Varghese and C. A. Grimes, J. Phys. Chem. C, 2007, 111, 7235–7241 CrossRef CAS.
- M. Sun, Y. Fang, S. Sun and Y. Wang, RSC Adv., 2016, 6, 12272–12279 RSC.
- L. E. Pérez-Jiménez, J. C. Solis-Cortazar, L. Rojas-Blanco, G. Perez-Hernandez, O. S. Martinez, R. C. Palomera, F. Paraguay-Delgado, I. Zamudio-Torres and E. R. Morales, Results Phys., 2019, 12, 1680–1685 CrossRef.
- C. Noberi and C. Kaya, Mater. Discovery, 2017, 9, 23–29 CrossRef.
- Y. Yu, Y. Jiang, M. Tian, L. Yang, H. Yan and S. Sheng, Rare Met. Mater. Eng., 2016, 45, 561–566 CrossRef.
- Y. L. Jiang, H. L. Liu, Q. H. Wang and Z. H. Jiang, J. Environ. Sci., 2006, 18, 158–161 CrossRef CAS.
- H. Hou, L. Wang, F. Gao, G. Wei, J. Zheng, B. Tang and W. Yang, Int. J. Hydrogen Energy, 2014, 39, 6837–6844 CrossRef CAS.
Footnote |
| † Electronic supplementary information (ESI) available. See DOI: 10.1039/c9ra00475k |
| This journal is © The Royal Society of Chemistry 2019 |

