 Open Access Article
Preparation of biodiesel oil-in-water nanoemulsions by mixed surfactants for bifenthrin formulation
Huiqiong Yan†
ab,
Chaoling Bao†b,
Xiuqiong Chenab,
Changjiang Yub,
Dulin Kongc,
Jianjun Shia and
Qiang Lin *ab
*ab
aKey Laboratory of Tropical Medicinal Resource Chemistry of Ministry of Education, College of Chemistry and Chemical Engineering, Hainan Normal University, Haikou 571158, Hainan, P. R. China. E-mail: linqianggroup@163.com; Fax: +86 898 66187313; Tel: +86 898 66275138
bKey Laboratory of Water Pollution Treatment & Resource Reuse of Hainan Province, College of Chemistry and Chemical Engineering, Hainan Normal University, Haikou 571158, Hainan, P. R. China
cSchool of Pharmaceutical Sciences, Hainan Medical University, Haikou 571199, Hainan, P. R. China
First published on 15th April 2019
Abstract
Although several approaches have been reported on the development of nanoemulsions over the last few years, studies on the formation of biodiesel nanoemulsions for bifenthrin formulation by the low-energy phase inversion composition (PIC) method are still scarce. Herein, the preparation of oil-in-water (O/W) nanoemulsions suitable for pesticide application has been achieved in biodiesel by dissolving a bifenthrin/mixture of a non-ionic surfactant (NP-6) and an anionic surfactant (ABSCa)/water system by the PIC method. The mechanism of the formation of bifenthrin nanoemulsions by dripping the water phase into the oil–surfactant phase was exemplified via the pseudo-ternary phase diagram. The effects of the mass ratio of NP-6 and ABSCa, mROS, stirring rate, the addition rate of water and the emulsification temperature on the mean droplet size of the nanoemulsion were investigated by dynamic light scattering (DLS). In addition, the interfacial tension and the contact angle of bifenthrin nanoemulsions for the spraying application were investigated. The insecticidal activity of bifenthrin nanoemulsions against cabbage maggots was further studied. Moreover, the emulsion stability of the bifenthrin nanoemulsions against Ostwald ripening behavior was evaluated, and the long-term stability of the bifenthrin formulation was studied by the HPLC method to assess the shelf life of the pesticide formulation. Experimental results showed that the optimum emulsification conditions for the mass ratio of NP-6 and ABSCa, mROS, stirring rate, the addition rate of water and the emulsification temperature were respectively 5/5, 1.4, 8000 rpm, 0.7 mL min−1 and 25 °C. The bifenthrin nanoemulsion with low interfacial tension and contact angle, easy adsorption on plant leaf surfaces and good shelf life has great potential for use as a pesticide formulation.
1 Introduction
Nanoemulsions are a class of emulsions with uniform and extremely small droplet sizes typically in the range between 20 and 200 nm.1 Due to their finer droplet sizes, they possess optical transparency, good stability to gravitational separation and droplet aggregation, as well as increased bioavailability over conventional microemulsions (diameter >200 nm).2,3 In addition, nanoemulsions require relatively lower surfactant concentration, typically 5–10%, as compared to conventional microemulsions that need at least 20% of surfactant.4 In particular, the oil-in-water nanoemulsions can avoid the use of a number of organic solvents and adjuvants, which are considered to be harmful to the environment;5 therefore, they can be widely used in foods, beverages, cosmetics, agrochemicals and pharmaceuticals.6–10Since nanoemulsions are thermodynamically unstable systems, energy input is required for their preparation. In this regard, two main approaches are currently used for the preparation of nanoemulsions: high energy and low energy emulsification methods.11,12 High-energy methods include extreme shear stirring, high-pressure homogenizers, ultrasound generators and microfluidizers, which apply intense mechanical energy to achieve the blending and crushing of oil and water phases.2 Although the high-energy methods are common and straightforward approaches to fabricating nanoemulsions, the level of energy required to obtain nanometer-scaled droplets is very high and thus cost-inefficient.13 Conversely, low-energy emulsification methods, based on the spontaneous formation of nanoemulsions by taking advantage of the internal chemical energy of the system, are energy-efficient and involve phase transitions taking place during the emulsification process.14 Several low-energy methods such as spontaneous phase inversion temperature (PIT) and phase inversion composition (PIC) methods have been proposed to prepare nanoemulsions, which respectively depend on specific changes in temperature at constant composition and specific changes in composition at constant temperature.13,15,16 Although low-energy emulsification methods have been the focus of considerable research interest in the last few years, there is still a relatively poor understanding of the physicochemical basis of nanoemulsions and the major factors impacting their performance. In particular, no direct evidence has been put forward to clarify the presence of lamellar liquid crystallites or bicontinuous microemulsions in the preparation of nanoemulsions by the PIC method. Therefore, further effort is required to fully understand the mechanism of the formation of nanoemulsions, and thus optimize the emulsification process.
Biodiesel is a green environmental industrial solvent and raw material derived from renewable biomass such as vegetable oils, animal fats, waste cooking oils, lipids of yeast and microalgae.17 Due to its high biological degradation speed, high flash point, high storing and shipping safety, good environmental compatibility, low cost, relatively stronger dissolving ability and renewability, it has recently attracted much attention all over the world.18 Significantly, biodiesel can be used as the carrier for insoluble pesticides for the formation of nanoemulsions, which could improve the bioavailability of pesticide by solubilization in the droplets of nanoemulsion.19 Many works also indicate that using nanoemulsions as pesticide delivery systems could realize the efficient delivery of the active ingredients of pesticides and improve their efficacy.5,20
In this study, we applied the PIC method to prepare transparent biodiesel nanoemulsions by mixed surfactants using biodiesel as the oil phase for bifenthrin formulation. It has been reported that the mixed surfactants often perform better for various applications, as compared to pure surfactant.21 For this reason, the mixture of nonionic nonylphenol polyoxyethylene ether (NP-6) and anionic calcium dodecylbenzene sulfonate (ABSCa) was used to prepare a nanoemulsion. Bifenthrin is a water-insoluble pesticide that is regarded as a third-generation synthetic pyrethroid insecticide for its great photostability and insecticidal activity;5,22 its structural formula is shown in Fig. 1. The low-energy method used in our work involves constant temperature but different compositions during emulsification by adding water to an oil–surfactant mixture to obtain the oil-in-water (O/W) nanoemulsions.23 To obtain the optimum emulsification conditions we investigated the effects of the mass ratio of NP-6 and ABSCa, the mass ratio of oil and the mixed surfactant (mROS), stirring rate, the addition rate of water and the emulsification temperature on the mean droplet size of the nanoemulsion. Unlike conventional microemulsions that are thermodynamically stable systems, nanoemulsions can be kinetically stable.11 It was reported that the main breakdown process for nanoemulsions is Ostwald ripening, which is attributed to the diffusion of molecules of the disperse phase from small to big droplets in the continuous phase because of their different Laplace pressures.13,16 The emulsion stability of the nanoemulsions against Ostwald ripening behavior was evaluated, and the long-term stability of the bifenthrin formulation was also studied by the HPLC method to assess the shelf life of the pesticide formulation. At the same time, the contact angle of the pesticide formulation on paraffin and its interfacial tension were also determined for the spraying application. In addition, the insecticidal activity of bifenthrin nanoemulsions against cabbage maggots was further studied. To the best of our knowledge, the formation of biodiesel nanoemulsions for bifenthrin formulation by the PIC method has rarely been reported so far. The main objective of this work is to obtain the optimum emulsification conditions for the preparation of transparent biodiesel nanoemulsions via the PIC method, and to evaluate the long-term stability of the bifenthrin nanoemulsions for the assessment of the shelf life of the pesticide formulation.
2 Experimental procedures
2.1 Materials
Biodiesel (major component: fatty acid methyl) and nonylphenol polyoxyethylene ether (NP-6, the average number of ethylene oxide groups was 6) were purchased from Shanghai Weipu Chemicals Co. Ltd. (Shanghai, China). Bifenthrin (standard substance) and calcium dodecylbenzene sulfonate (ABSCa) were provided by Aladdin Chemical Reagent Co. Ltd. (Shanghai, China). The chemicals were of analytical grade and were used without further purification. Double distilled water was used in the preparation of all solutions and nanoemulsions.2.2 Methods
Equilibrium interfacial tension was measured at 25 °C with a Sigma 70 tensiometer employing the DuNoüy ring method (Bruker, Germany). The average value of three measurements was used.
![[thin space (1/6-em)]](https://www.rsc.org/images/entities/char_2009.gif) :
:![[thin space (1/6-em)]](https://www.rsc.org/images/entities/char_2009.gif) 15 methanol
15 methanol![[thin space (1/6-em)]](https://www.rsc.org/images/entities/char_2009.gif) :
:![[thin space (1/6-em)]](https://www.rsc.org/images/entities/char_2009.gif) water (v/v) mobile phase; 5.0 μL of sample was injected at a flux rate of 1 mL min−1, and the retention time was about 5.4 min.
water (v/v) mobile phase; 5.0 μL of sample was injected at a flux rate of 1 mL min−1, and the retention time was about 5.4 min.3 Results and discussion
3.1 Nanoemulsions formation by PIC method
At constant pressure and temperature, the phase behavior of a three-component system can be represented by a planar triangle, called a ternary phase diagram. This is the most convenient and effective way to study the phase, composition and phase boundary of the equilibrium system. According to the phase diagram, the structural state of the mixed system can be preliminarily estimated, which can intuitively reflect the change in the phase state of the microemulsion system.13 Through the drawing of the pseudo-ternary phase diagram, the compatibility of the substances in the system and the conditions for forming the microemulsions can be studied.8 The pseudo-ternary phase diagram for the equilibrium phase behavior of biodiesel, water and the mixed ionic–nonionic surfactants was drawn with the aid of the naked eye and polarizing light microscopy. As shown in Fig. 2, the pseudo-ternary phase diagram of biodiesel, water and the mixed ionic–nonionic surfactants was divided into six different areas. These areas included, respectively, an inverse micellar solution of a W/O microemulsion (Om), a lower liquid crystalline phase with an upper colorless liquid phase (Lα + Om), a lamellar liquid crystalline phase (Lα), a bicontinuous microemulsion (D), a micellar solution of an O/W microemulsion (Wm) and a multiphase region (M). The Om, D and Wm phases were isotropic, colorless fluids, but the others contained several two- and multiple-phase regions.8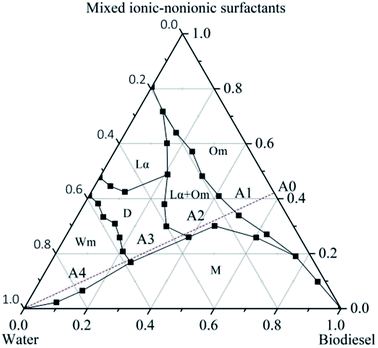 | ||
| Fig. 2 Pseudo-ternary phase diagram of biodiesel, water and the mixed ionic–nonionic surfactants system at 25 °C. | ||
Under the guidance of the pseudo-ternary phase diagram, we could accurately prepare the drug-loaded nanoemulsion by the PIC method, which involved a combination of phase-inversion and self-emulsification. The procedure to obtain nanoemulsions by the PIC method consisted of progressively adding one of the components (water or oil) to a mixture of the other two components (oil–surfactant or water–surfactant, respectively).13,26,27 In our work, the preparation of the nanoemulsions was achieved by dripping the water phase into the oil–surfactant phase. For example, we fixed the mass ratio of biodiesel and the mixed surfactants (mROS) at 1.4. Along with the addition of water, the preparation procedure of the nanoemulsions was gradually performed according to the A0–A4 route, as shown in Fig. 2. Firstly, a certain amount of biodiesel dissolving bifenthrin was blended with the mixed surfactants to form the mixture (A0 system). When water was dripped progressively into the oil phase, the initial system generally formed a W/O microemulsion (A1 system). Then, as the mass fraction of water increased, water droplets merged together to form a blend of a lamellar liquid crystalline phase and W/O microemulsion (A2). Subsequently, with the continued increase in the mass fraction of water, the hydration grade of the mixed ionic–nonionic surfactants was progressively enhanced, and the spontaneous curvature of the mixed surfactants changed from negative to zero, thus resulting in the formation of a bicontinuous microemulsion (A3).13 The mixed ionic–nonionic surfactant layer had higher flexibility to partition into the oil–water interface and decreased the oil–water interfacial tension instantaneously.28–31 Upon further increasing the water content, the bicontinuous microemulsion with zero curvature would generate phase inversion and decompose into a very finely dispersed O/W microemulsion (A4), which contained a very high positive curvature of the surfactant layer.32 The mechanism of the formation of bifenthrin nanoemulsions by dripping the water phase into the oil–surfactant phase was exemplified in Fig. 3, which was consistent with the previous report.24
 | ||
| Fig. 3 Schematic description of the formation mechanism of bifenthrin nanoemulsions by dripping the water phase into the oil–surfactant phase. | ||
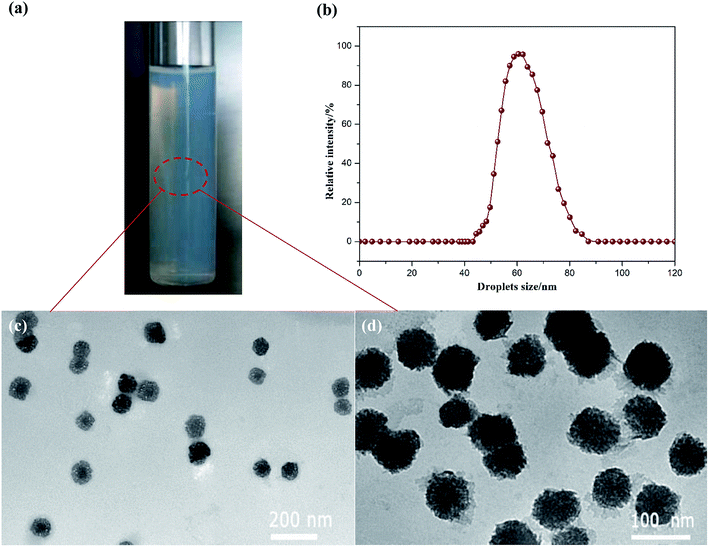
The resultant bifenthrin nanoemulsions were observed to be light blue and transparent, which exhibited low viscosity and good stability, as shown in Fig. 4a. The mean droplet size of the nanoemulsions and the morphology of the nanoemulsion droplets were respectively evaluated by DLS and TEM measurements. As shown in Fig. 4b, the obtained bifenthrin nanoemulsions possessed a narrow size distribution ranging from 45 nm to 90 nm, and their mean size was 63.8 nm with the PDI of 0.101. Moreover, TEM images (Fig. 4c and d) revealed that the bifenthrin nanoemulsions exhibited a similar spherical shape with the mean size of 62.3 nm, which was similar to the results of DLS measurements. Due to the coverage of the mixed ionic–nonionic surfactants at the oil–water interface, which protected the emulsion droplets against coalescence,33 the formed O/W nanoemulsions could show a very fine dispersion with small and uniform emulsion droplets, thus exhibiting good stability.
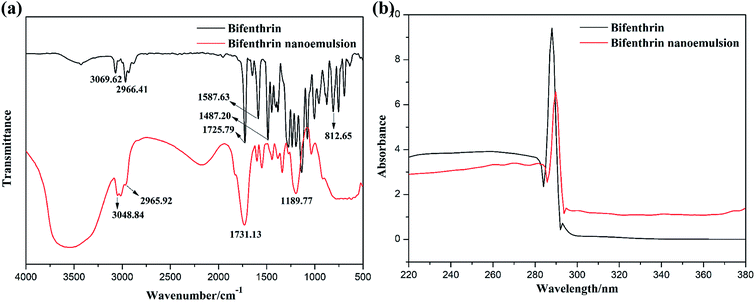
The biodiesel used in this work was obtained from soybean oil by chemical reaction with an alcohol, and its main component is fatty acid methyl ester. Since the chemical configuration of biodiesel may influence the preparation and stability of the nanoemulsion, we conducted FT-IR and UV-vis spectroscopy studies to characterize the structure of pure bifenthrin and the mixture of bifenthrin nanoemulsions. As shown in Fig. 5a, the characteristic peaks of bifenthrin at 3069.62, 1587.63, 1487.20 and 812.65 cm−1 were respectively assigned to C–H stretching vibrations and skeleton vibrations of the benzene ring.34 The peaks at 2966.41 and 1725.79 cm−1 were respectively attributed to symmetric stretching vibrations of C–H for methyl and –C![[double bond, length as m-dash]](https://www.rsc.org/images/entities/char_e001.gif) O for ester groups.35 In comparison with bifenthrin, the bifenthrin nanoemulsion exhibited a different FT-IR spectrum. The peak at 3048.84 cm−1 was ascribed to the stretching vibration of the unsaturated double bond in the fatty acid methyl ester carbon skeleton. The peaks at 1731.13 and 1189.77 cm−1 were respectively assigned to symmetric stretching vibrations of –C
O for ester groups.35 In comparison with bifenthrin, the bifenthrin nanoemulsion exhibited a different FT-IR spectrum. The peak at 3048.84 cm−1 was ascribed to the stretching vibration of the unsaturated double bond in the fatty acid methyl ester carbon skeleton. The peaks at 1731.13 and 1189.77 cm−1 were respectively assigned to symmetric stretching vibrations of –C![[double bond, length as m-dash]](https://www.rsc.org/images/entities/char_e001.gif) O and the characteristic absorption peak of fatty acid methyl ester. The above results implied that the bifenthrin was effectively encapsulated in the micelle structure of the mixed surfactant during the preparation of bifenthrin nanoemulsions. It was the coverage of the mixed surfactant that reduced the UV-vis absorbance of bifenthrin in the nanoemulsions, as shown in Fig. 5b.
O and the characteristic absorption peak of fatty acid methyl ester. The above results implied that the bifenthrin was effectively encapsulated in the micelle structure of the mixed surfactant during the preparation of bifenthrin nanoemulsions. It was the coverage of the mixed surfactant that reduced the UV-vis absorbance of bifenthrin in the nanoemulsions, as shown in Fig. 5b.
3.2 Effect of the emulsification conditions on the mean droplet size of the bifenthrin nanoemulsion
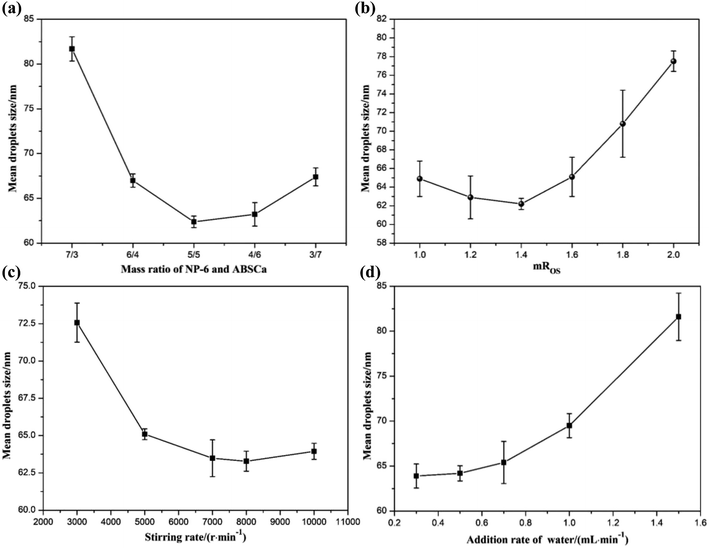
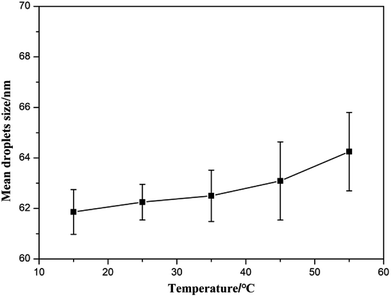
Various previous reports that used the PIC method to prepare the nanoemulsions have shown that the droplet size generally depends on many emulsification conditions, including the mass ratio of NP-6 and ABSCa, mROS, stirring rate, the water addition rate and the emulsification temperature.36–38 As the relationship between them was very complicated, other experimental conditions were kept unchanged during the experiment, and one of the factors was changed to test its effect on the mean droplet size of the bifenthrin nanoemulsion.3.3 Interfacial tension and contact angle of the bifenthrin nanoemulsion
Nanoemulsions have been shown to be advantageous for optimizing the delivery of hydrophobic compounds in agrochemicals. The small droplets of nanoemulsions allow them to deposit uniformly on plant leaves.8 Wetting, spreading and penetration would be also enhanced due to the low interfacial tension of the O/W nanoemulsions.41 As shown in Fig. 8, with the increase of mROS, the interfacial tension of the bifenthrin nanoemulsion gradually increased. When the mROS did not exceed 1.6, the interfacial tension was less than 29 mN m−1, without significant change. In this case, the bifenthrin nanoemulsion had low interfacial tension, good emulsifying performance, and easy adsorption on the plant surface, thus effectively improving the utilization of bifenthrin. The smaller the mROS in the nanoemulsion system, the larger was the mixed surfactant mass fraction, and the mixed surfactant could effectively reduce the interfacial tension of the bifenthrin nanoemulsion. Therefore when the mROS was less than 1.6, the interfacial tension was small, and the bifenthrin nanoemulsion could be suitable for spraying application. In addition, the effects of pesticide nanoemulsion on wetting, spreading and leaf penetration are also commonly expressed by the contact angle.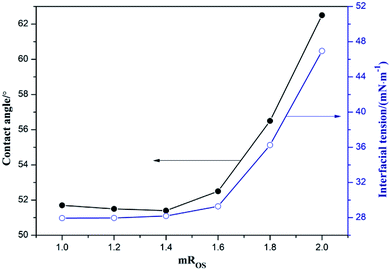 | ||
| Fig. 8 Variation curves of interfacial tension and the contact angle of bifenthrin nanoemulsion at different mROS. | ||
The leaves of the plants had a layer of wax that was highly hydrophobic. Therefore, the use of paraffin wax instead of plant leaves to measure the contact angle could similarly characterize the wetting of bifenthrin nanoemulsion on the plant leaves. As shown in Fig. 9, the contact angle of the double distilled water on the paraffin surface was 101°, which was non-wetting, while the contact angle of the bifenthrin nanoemulsion on the paraffin surface was obviously less than 90°, indicating that it was partially or totally wet. In addition, the droplet shapes of the double distilled water and the bifenthrin nanoemulsion on the real plant leaves were also measured. As shown in Fig. 10, the bifenthrin nanoemulsion droplets could be effectively spread on the real plant leaves in comparison with the double distilled water droplets, indicating good wetting properties, which is in good agreement with the results on the paraffin. These results imply that the bifenthrin nanoemulsion could be spread on the leaf surface, which indicated the potential for agrochemical active delivery. It could be also seen from Fig. 6 that the contact angle of the bifenthrin nanoemulsion was basically increased with the increase of the mROS, when the mROS exceeded 1.6. Since the higher mROS led to the lower mass fraction of the mixed surfactant, the thinner surfactant layer in the emulsion resulted in a worse wetting effect. Therefore, the optimum mROS for spraying application was 1.4, which was in accordance with the mROS for nanoemulsion formation.
 | ||
| Fig. 9 Droplet shape of (a) bifenthrin nanoemulsions and (b) double distilled water on paraffin surface. | ||
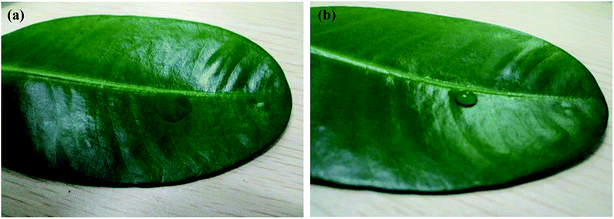 | ||
| Fig. 10 Droplet shape of (a) bifenthrin nanoemulsions and (b) double distilled water on the real plant leaves. | ||
3.4 Insecticidal activity against cabbage maggots
The insecticidal activity of bifenthrin nanoemulsions was studied against cabbage maggots after dilution. Table 1 shows the mortality of cabbage maggots over time, after 100-fold, 500-fold and 1000-fold dilution of bifenthrin nanoemulsions. The mortality rate of cabbage maggots increased with the increase in exposure time from 5 h to 20 h. It is worth noting that after 20 h of exposure, the mortality rate for all samples exceeded 90%, and 100% mortality was observed at 100-fold and 500-fold dilution of bifenthrin nanoemulsions with the exposure time of 20 h. These results indicate the high insecticidal activity of bifenthrin nanoemulsion for practical application.3.5 Stability of the bifenthrin nanoemulsion
The formed nanoemulsions exhibited good stability without phase separation after several days, but an increase in droplet size was observed with time. There are two probable breakdown processes in dispersed systems, namely, coalescence and Ostwald ripening. The droplet growth rate, ω, due to Ostwald ripening, can be calculated by the Lifshitz–Slezov and Wagner (LSW) theory:5,42,43
 | (1) |
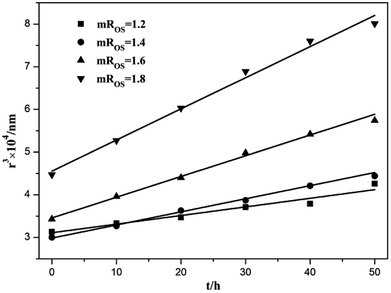
In order to verify that the breakdown process was Ostwald Ripening, the cube of the radius, r3, was plotted as a function of time at different mROS in Fig. 11. The linear variation of r3 as a function of time indicated that Ostwald ripening was the driving force for instability, which was similar to the results obtained by Du et al.44 It was clearly illustrated that the slope increased with the increase in mROS, which meant that the more stable nanoemulsions were formed with higher surfactant concentrations. These results were in agreement with previous research results.6,8 Note that the interfacial tension was reduced with the increase in surfactant concentration, which is a factor for reducing the Ostwald ripening, according to in eqn (1).
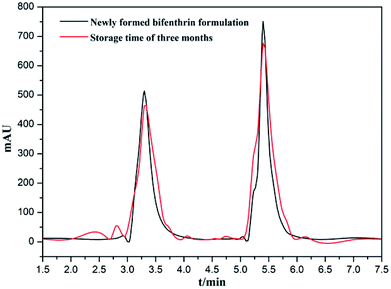
The long-term stability of the bifenthrin nanoemulsion was further probed to assess the shelf life of the bifenthrin formulation. The chemical stability was represented by the amount of bifenthrin retention measured by HPLC analysis at the storage time of three months. Fig. 12 shows the representative chromatogram of the bifenthrin nanoemulsion. The peaks at the retention time of 3.3 min were assigned to the biodiesel, while the retention time of bifenthrin was about 5.4 min. It could be seen that after three months of storage, the peak intensity was slightly weakened, revealing that the bifenthrin nanoemulsion is not easily decomposed or precipitated, and has a good shelf life, making it suitable for potential pesticide formulations.
4 Conclusion
A stable O/W bifenthrin nanoemulsion was successfully prepared by the PIC method, using NP-6 and ABSCa as the mixed surfactants, and biodiesel as the oil phase. The mechanism of the formation of bifenthrin nanoemulsions by dripping the water phase into the oil–surfactant phase was stated with the aid of the pseudo-ternary phase diagram. To obtain the optimum emulsification conditions, the effects of the mass ratio of NP-6 and ABSCa, mROS, stirring rate, the addition rate of water and the emulsification temperature on the mean droplet size of the nanoemulsion were investigated. Experimental results showed that the optimum emulsification conditions for the mass ratio of NP-6 and ABSCa, mROS, stirring rate, the addition rate of water and the emulsification temperature were respectively 5/5, 1.4, 8000 rpm, 0.7 mL min−1 and 25 °C. In addition, the bifenthrin nanoemulsion with the lower mROS had a low interfacial tension and contact angle, which could be spread and wet on the leaf surface for the spraying application. The insecticidal activity of bifenthrin nanoemulsions against cabbage maggots was further studied, and the emulsion stability of the nanoemulsions against Ostwald ripening behavior was also evaluated. HPLC analysis showed that the bifenthrin nanoemulsion is not easily decomposed or precipitated, and has a good shelf life, making it suitable for potential pesticide formulations.Conflicts of interest
There are no conflicts to declare.Acknowledgements
We gratefully thank the financial support from the Natural Science Foundation of Hainan Province (218QN233), Scientific Research Projects of Hainan Higher Education Institutions (Hnky2019-36) and the National Natural Science Foundation of China (21566009).Notes and references
- M. S. El-Aasser and E. D. Sudol, JCT Res., 2004, 1, 21–31 Search PubMed.
- D. J. McClements and J. Rao, Crit. Rev. Food Sci. Nutr., 2011, 51, 285–330 CrossRef CAS PubMed.
- A. H. Saberi, Y. Fan and D. J. McClements, J. Agric. Food Chem., 2014, 62, 1625–1633 CrossRef CAS PubMed.
- M. Kah and T. Hofmann, Environ. Int., 2014, 63, 224–235 CrossRef CAS PubMed.
- Y. Liu, F. Wei, Y. Wang and G. Zhu, Colloids Surf., A, 2011, 389, 90–96 CrossRef CAS.
- Y. Chang and D. J. McClements, J. Agric. Food Chem., 2014, 62, 2306–2312 CrossRef CAS PubMed.
- O. Sonneville-Aubrun, J. T. Simonnet and F. Lalloret, Adv. Colloid Interface Sci., 2004, 108, 145–149 CrossRef PubMed.
- L. Wang, X. Li, G. Zhang, J. Dong and J. Eastoe, J. Colloid Interface Sci., 2007, 314, 230–235 CrossRef CAS PubMed.
- S. Song, X. Liu, J. Jiang, Y. Qian, N. Zhang and Q. Wu, Colloids Surf., A, 2009, 350, 57–62 CrossRef CAS.
- N. Sadurní, C. Solans, N. Azemar and M. J. García-Celma, Eur. J. Pharm. Sci., 2005, 26, 438–445 CrossRef PubMed.
- C. Bilbao-Sainz, R. J. Avena-Bustillos, D. Wood, T. G. Williams and T. H. Mchugh, J. Agric. Food Chem., 2010, 58, 11932–11938 CrossRef CAS.
- D. J. McClements, Soft Matter, 2012, 8, 1719–1729 RSC.
- C. Solans and I. Solé, Curr. Opin. Colloid Interface Sci., 2012, 17, 246–254 CrossRef CAS.
- G. Calderó, M. J. García-Celma and C. Solans, J. Colloid Interface Sci., 2011, 353, 406–411 CrossRef.
- F. Ostertag, J. Weiss and D. J. McClements, J. Colloid Interface Sci., 2012, 388, 95–102 CrossRef CAS PubMed.
- D. J. McClements, Soft Matter, 2011, 7, 2297–2316 RSC.
- A. E. F. Abomohra, W. Jin, R. Tu, S. F. Han, M. Eid and H. Eladel, Renewable Sustainable Energy Rev., 2016, 64, 596–606 CrossRef CAS.
- C. R. Soccol, C. J. D. Neto, V. T. Soccol, E. B. Sydney, E. S. F. da Costa, A. B. P. Medeiros and L. P. de S. Vandenberghe, Bioresour. Technol., 2017, 223, 259–268 CrossRef CAS PubMed.
- L. C. Jiang, M. Basri, D. Omar, M. B. A. Rahman, A. B. Salleh, R. N. Z. R. A. Rahman and A. Selamat, Pestic. Biochem. Physiol., 2012, 102, 19–29 CrossRef CAS.
- S. Song, X. Liu, J. Jiang, Y. Qian, N. Zhang and Q. Wu, Colloids Surf., A, 2009, 350, 57–62 CrossRef CAS.
- L. C. Peng, C. H. Liu, C. C. Kwan and K. F. Huang, Colloids Surf., A, 2010, 370, 136–142 CrossRef CAS.
- M. Jin, X. Zhang, L. Wang, C. Huang, Y. Zhang and M. Zhao, Aquat. Toxicol., 2009, 95, 347–354 CrossRef CAS PubMed.
- N. Ahmad, R. Ramsch, M. Llinàs, C. Solans, R. Hashim and H. A. Tajuddin, Colloids Surf., B, 2014, 115, 267–274 CrossRef CAS PubMed.
- W. Wang, H. Wei, Z. Du, X. Tai and G. Wang, ACS Sustainable Chem. Eng., 2015, 3, 443–450 CrossRef CAS.
- S. V. Joseph and J. Zarate, Crop Prot., 2015, 77, 148–156 CrossRef CAS.
- O. Sonneville-Aubrun, D. Babayan, D. Bordeaux, P. Lindner, G. Rata and B. Cabane, Phys. Chem. Chem. Phys., 2009, 11, 101–110 RSC.
- A. H. E. Machado, D. Lundberg, A. J. Ribeiro, F. J. Veiga, B. Lindman, M. G. Miguel and U. Olsson, Langmuir, 2012, 28, 4131–4141 CrossRef CAS PubMed.
- C. J. Lim, M. Basri, D. Omar, M. B. A. Rahman, A. B. Salleh and R. N. Z. R. A. Rahman, Ind. Crops Prod., 2012, 36, 607–613 CrossRef CAS.
- W. Warisnoicharoen, A. B. Lansley and M. J. Lawrence, Int. J. Pharm., 2000, 198, 7–27 CrossRef CAS.
- Y. He, B. Yang, G. Cheng and H. Pan, Mater. Lett., 2004, 58, 2019–2022 CrossRef CAS.
- K. Zielinska, K. A. Wilk, A. Jezierski and T. Jesionowski, J. Colloid Interface Sci., 2008, 321, 408–417 CrossRef CAS PubMed.
- P. Fernandez, V. Andŕe, J. Rieger and A. Kühnle, Colloids Surf., A, 2004, 251, 53–58 CrossRef CAS.
- Z. Hu, S. Ballinger, R. Pelton and E. D. Cranston, J. Colloid Interface Sci., 2015, 439, 139–148 CrossRef CAS.
- Y. Shen, Q. Zhao, X. Li, D. Yuan, Y. Hou and S. Liu, J. Hazard. Mater., 2012, 241–242, 472–477 CrossRef CAS.
- J. S. Yang, H. B. Ren and Y. J. Xie, Biomacromolecules, 2011, 12, 2982–2987 CrossRef CAS PubMed.
- K. Bouchemal, S. Briancon, E. Perrier and H. Fessi, Int. J. Pharm., 2004, 280, 241–251 CrossRef CAS PubMed.
- J. C. López-Montilla, P. E. Herrera-Morales, S. Pandey and D. O. Shah, J. Dispersion Sci. Technol., 2002, 23, 219–268 CrossRef.
- Y. Chang, L. McLandsborough and D. J. McClements, J. Agric. Food Chem., 2013, 61, 8906–8913 CrossRef CAS PubMed.
- A. Shiloach and D. Blankschtein, Langmuir, 1998, 14, 7166–7182 CrossRef CAS.
- L. Yu, C. Li, J. Xu, J. Hao and D. Sun, Langmuir, 2012, 28, 14547–14552 CrossRef CAS PubMed.
- T. Tadros, P. Izquierdo, J. Esquena and C. Solans, Adv. Colloid Interface Sci., 2004, 108–109, 303–318 CrossRef CAS PubMed.
- I. Sole, C. M. Pey, A. Maestro, C. Gonzalez, M. Porras, C. Solans and J. M. Gutierrez, J. Colloid Interface Sci., 2010, 344, 417–423 CrossRef CAS PubMed.
- I. Capek, Adv. Colloid Interface Sci., 2004, 107, 125–155 CrossRef CAS PubMed.
- Z. Du, C. Wang, X. Tai, G. Wang and X. Liu, ACS Sustainable Chem. Eng., 2016, 4, 983–991 CrossRef CAS.
Footnote |
| † Huiqiong Yan and Chaoling Bao are co-first authors. |
| This journal is © The Royal Society of Chemistry 2019 |


