 Open Access Article
Philic–phobic chemical dynamics of a 1st tier dendrimer dispersed o/w nanoemulsion†
Naveen Kumari *ab,
Man Singh
 b,
Hari Om
 a and
K. M. Sachin
 b
b
aDepartment of Chemistry, Deenbandhu Chhotu Ram University of Science and Technology, Murthal, Haryana, India. E-mail: hariom.chem@dcrustm.org; nkandhil90@gmail.com
bSchool of Chemical Sciences, Central University of Gujarat, Gandhinagar, Gujarat, India. E-mail: mansingh50@hotmail.com; sachinbbau@gmail.com
First published on 23rd April 2019
Abstract
Olive, castor and linseed oil (oil-in-water) nanoemulsions were prepared using Tween-20, sodium dodecyl sulfate, and cetyltrimethylammonium bromide (0.12 w/w%) with 0.02 w/w% cellulose acetate propionate (CAP), 0.02 w/w% cellulose acetate butyrate (CAB), 6.2 w/w% ethyl acetate, 5.5 w/w% ethanol and 7.8 w/w% glycerol as dispersion agents. To study the dispersion effect of trimesoyl 1,3,5-tridimethyl malonate (TTDMM, 1st tier), nanoemulsions were prepared with olive, castor and linseed oil. Their density, viscosity, surface tension and friccohesity measurements at T = (293.15, 303.15, and 315.15) K, hydrodynamic radii, surface excess concentration, surface area per molecule, and antioxidant activities were studied. Dispersion variations of TTDMM on varying surfactant and specific interactions of the hydration spheres and ester moiety of TTDMM with ethyl acetate, ethanol and glycerol linked oil–water–surfactant networks have been established. The variations in physicochemical properties suggest that the oil–TTDMM interaction abilities of the surfactant and co-surfactant moieties in the nanoemulsions cause a hydrophobic segregation. The physicochemical study of both blank and TTDMM loaded nanoemulsions have illustrated the thermodynamic stabilities in terms of hydrophobic–hydrophilic, hydrophilic–hydrophilic, van der Waals and hydrogen bonding interactions.
1. Introduction
Recently, the preparation of stable nanoemulsions (NEs) has emerged as one of the challenging tasks for pharmacists as well as academicians, with critical roles played by the temperature and other chemical additives or stabilizers.1–3 Such systems with pertinent Brownian motions manifest essential entropic stabilization to modulate the structural expression of the dispersed phase. Numerous studies have shown electrostatic interactions, van der Waals forces and hydrophilic–hydrophobic force gradients as crucial stabilizing factors for functional chemical linkages between active molecular sites. These factors serve as important interfaces amongst the physicochemical properties (PCPs) of emulsions to mediate dispersion rather than conventional solubilisation.4,5 In fact, it is merely the entropically active nature of emulsions that facilitates a kinetic modulation of the dispersed phase. This attribute of emulsions forms the basis of their utility as drug delivery vehicles for several natural hydrophobic compounds.6–8 Emulsification typically focusses on the mixing of hydrophobic and hydrophilic phases, enabled via the addition of surfactants that gradually segregate along the interface.2,9,10 On the basis of the extent of the interfacial mixing of hydrophobic and hydrophilic phases, two variations of emulsions are recognized, namely, microemulsions and nanoemulsions.11,12 Despite the fact that both systems have oil, water and surfactant as their constituents as well as little variations in the physicochemical attributes, the distinction prevails in terms of surfactant concentration, and thermodynamic and kinetic stabilities.12–16 One of the most formidable challenges in the formation of nanoemulsions is the attainment of 1![[thin space (1/6-em)]](https://www.rsc.org/images/entities/char_2009.gif) :
:![[thin space (1/6-em)]](https://www.rsc.org/images/entities/char_2009.gif) 1 oil–surfactant stoichiometries, where co-surfactants or additive sources can play a crucial role. Despite such immense potential to facilitate an improved structural expression of the dispersed phase, the formation of long-term stable food grade nanoemulsions has emerged as a daunting task for food chemists. The probable factors responsible for this are the right selection of oil–surfactant proportion with structurally supporting contributions of co-surfactants and co-solvents. As a consequence, anionic, cationic and non-ionic surfactants are preferred for the pharmaceutical and food grade design of nanoemulsions, keeping in mind toxicity related complications. Typical methods for making nanoemulsions fall into high and low energy categories, on the basis of energy inputs.17,18 The common aim of all of these methods is to transform the intact cohesive forces (CFs) of the respective dispersed and dispersion phases into frictional and intermolecular forces (IMFs) to increase the number of functional nanoscale droplets. High energy methods make use of external shear to reduce the droplet size via combinations of oil and water, with the most common variations being high pressure homogenization and ultrasonication.1,19 On the contrary, low energy methods, such as emulsion-inversion point and phase inversion temperature, reduce the particle size through compositional or thermal energy changes.18,20 Some recently reported emulsification methods are bubble bursting at an oil/water interface, evaporative ripening, pH enabled molecular dissociation and the anti-solvent approach.14,21 Although studies have reported numerous applications of nanoemulsions, still, a mechanistic understanding of molecular kinetics and engineering needs to be studied more thoroughly. For instance, factors such as pH, temperature, molecular additives, inclusion of additive surfactants, self-assembly driven functional coalescence and proper consideration of hydrophilic–lipophilic balance could strongly influence the emulsification.2,20,22,23
1 oil–surfactant stoichiometries, where co-surfactants or additive sources can play a crucial role. Despite such immense potential to facilitate an improved structural expression of the dispersed phase, the formation of long-term stable food grade nanoemulsions has emerged as a daunting task for food chemists. The probable factors responsible for this are the right selection of oil–surfactant proportion with structurally supporting contributions of co-surfactants and co-solvents. As a consequence, anionic, cationic and non-ionic surfactants are preferred for the pharmaceutical and food grade design of nanoemulsions, keeping in mind toxicity related complications. Typical methods for making nanoemulsions fall into high and low energy categories, on the basis of energy inputs.17,18 The common aim of all of these methods is to transform the intact cohesive forces (CFs) of the respective dispersed and dispersion phases into frictional and intermolecular forces (IMFs) to increase the number of functional nanoscale droplets. High energy methods make use of external shear to reduce the droplet size via combinations of oil and water, with the most common variations being high pressure homogenization and ultrasonication.1,19 On the contrary, low energy methods, such as emulsion-inversion point and phase inversion temperature, reduce the particle size through compositional or thermal energy changes.18,20 Some recently reported emulsification methods are bubble bursting at an oil/water interface, evaporative ripening, pH enabled molecular dissociation and the anti-solvent approach.14,21 Although studies have reported numerous applications of nanoemulsions, still, a mechanistic understanding of molecular kinetics and engineering needs to be studied more thoroughly. For instance, factors such as pH, temperature, molecular additives, inclusion of additive surfactants, self-assembly driven functional coalescence and proper consideration of hydrophilic–lipophilic balance could strongly influence the emulsification.2,20,22,23
Interestingly, to date, no systematic study has been reported on the impact of a TTDMM dendrimer on the progressive enhancing of surfactant hydrophobicity due to dispersion efficacies. Therefore, a study of functional, structural linkages with thermodynamic stabilities of the dispersed phases and dispersion medium seems to be the fundamental need of the hour. The use of toxically optimal agents like ethanol, glycerol, cellulose acetate propionate (CAP), cellulose acetate butyrate (CAB), poly-ethylene glycol, citric acid and several others can significantly modulate the dispersion of edible oils, where applications as diverse as protein extraction, waste recovery, and metallurgical processing of ores could be significantly improved. The same dispersion of edible oil can be studied for the impact of CAP and CAB on the thermodynamic stability of olive oil (OO), castor oil (CO) and linseed oil (LO) with Tween-20 (Tw-20), sodium dodecyl sulfate (SDS), and cetyltrimethylammonium bromide (CTAB) o/w nanoemulsions at 293.15, 303.15, and 313.15 K.
2. Experimental section
2.1 Materials
Cellulose acetate propionate (CAP), cellulose acetate butyrate (CAB), Tween-20 (Tw-20), sodium dodecyl sulfate (SDS), cetyltrimethylammonium bromide (CTAB), castor oil (CO), olive oil (OO), linseed oil (LO), ethyl acetate (EA), glycerol and ethanol (Table S1†) were purchased from Sigma Aldrich (St. Louis, MO, USA).2.2 Preparation of the nanoemulsions
Quaternary mixtures were prepared of surfactant, ethyl acetate, ethanol, glycerol and water. Oil equivalent to (0.02 w/w%) was added to a 100 mL round bottomed flask and the quaternary mixture was added, which was termed the emulsion. After that, cellulose acetate butyrate and cellulose acetate propionate were separately added and the resulting mixtures were subjected to magnetic stirring at 500 rpm and 298.15 K for 2 h, and the resulting mixtures were named blank nanoemulsions (NEs) (Table S2†). For preparing the dendrimer (TTDMM) loaded nanoemulsion, TTDMM (0.166 mM) was dissolved in ethanol and used in the same manner as the preparation of blank nanoemulsions. The final obtained blank and TTDMM loaded nanoemulsions (DNEs) were used for further physicochemical parameter measurements.2.3 Physicochemical studies
Densities were measured using an Anton Paar ‘Density meter’ DSA 5000 M. The temperature inside the densimeter was controlled to ±1 × 10⁻³ K with a built-in Peltier device. The instrument was calibrated with Milli-Q water and dry air. Before and after each measurement, the tube was washed with acetone and dried uninterruptedly till a persistent oscillation period was obtained, by passing dried air through a tube using an air pump. The repeatability in the density was found to be 1 × 10⁻³ kg m−3.Surface tensions and viscosities of the prepared nanoemulsions were estimated by pendant drop number and viscous flow time, respectively, with a Borosil Mansingh Survismeter24–27 (calibration no. 06070582/1.01/C-0395, NPL, India) at 293.15 to 313.15 K. The temperature of the survismeter was controlled by a Lauda Alpha KA 8 thermostat to ±0.05 K. The pendant drop number was counted with an electronic counter, while the viscous flow time was recorded with an electronic timer with an accuracy of ±0.1 s. The Survismeter was properly washed with acetone and dried completely before the viscosity and surface tension measurements. Calibration was done to ensure the accuracy of the data. Ten pendant drop number (PDN) and viscous flow time (VFT) readings were taken to ensure reproducibility and precision. Surface tensions and viscosity uncertainties were in the range of ±0.35 mN m−1 and ±0.004 × 10⁻³ kg m−1 s−1. The accuracy and comparison with the literature values are reported28–30 in ESI Table S3.†
2.4 Calculations
The friccohesity of the prepared nanoemulsions was calculated using the Mansingh equation (eqn (1)):
 | (1) |
Surface excess concentration (Γmax) and surface area (1/Γmax) per molecule were calculated using the Josiah Willard Gibbs equation (eqn (2)):
 | (2) |
 is the slope of the plot between γ and the logarithm of the oil concentration at a fixed temperature.
For determining the contribution of the philic–phobic force gradient in nanoemulsion formation, the hydrodynamic radius, Rhyd, was calculated using the Einstein equation (eqn (2)):31
 | (3) |
2.5 Particle size and zeta potential measurements
The particle size, polydispersity index and zeta potential of the prepared nanoemulsions were determined by the dynamic scattering technique using a Zetasizer Nano ZS 90 (Malvern Instruments, UK). The samples were analysed at 25 °C with a backscattering angle of 173°.2.6 Antioxidant activity measurements
Antioxidant activities of the drug encapsulated formulations were evaluated through the free radical scavenging effect of stable DPPH˙ measured using a previously reported spectrophotometric method.31–33 For radical scavenging activity (RSA) determination, a 0.006% DPPH˙ solution in ethanol was prepared. For screening RSA, the pure DPPH˙ solution was mixed with DNEs in a 1![[thin space (1/6-em)]](https://www.rsc.org/images/entities/char_2009.gif) :
:![[thin space (1/6-em)]](https://www.rsc.org/images/entities/char_2009.gif) 1 ratio. Thereafter, on vigorous shaking, these samples were kept in the dark for an incubation period of 30 min. The relative RSAs were evaluated as a measure of comparative % decrease in absorbance of pure DPPH˙ at λmax = 520 nm, ascertained via the measurement of the absorbance of a DPPH + NEs 1
1 ratio. Thereafter, on vigorous shaking, these samples were kept in the dark for an incubation period of 30 min. The relative RSAs were evaluated as a measure of comparative % decrease in absorbance of pure DPPH˙ at λmax = 520 nm, ascertained via the measurement of the absorbance of a DPPH + NEs 1![[thin space (1/6-em)]](https://www.rsc.org/images/entities/char_2009.gif) :
:![[thin space (1/6-em)]](https://www.rsc.org/images/entities/char_2009.gif) 1 mixture at the same wavelength. The measurements were made using a Spectro2060 plus model UV/Vis spectrophotometer. The respective RSAs were calculated using the following equation:
1 mixture at the same wavelength. The measurements were made using a Spectro2060 plus model UV/Vis spectrophotometer. The respective RSAs were calculated using the following equation:where Ao and As are the absorbance of pure DPPH˙ and DNEs, measured at 520 nm.
2.7 Statistical analysis
All of the experiments were performed in triplicate and the results are reported as mean ± the standard deviation, standard uncertainties (0.68 level of confidence) and combined expanded uncertainties (0.95 level of confidence).3. Results and discussion
3.1 Density
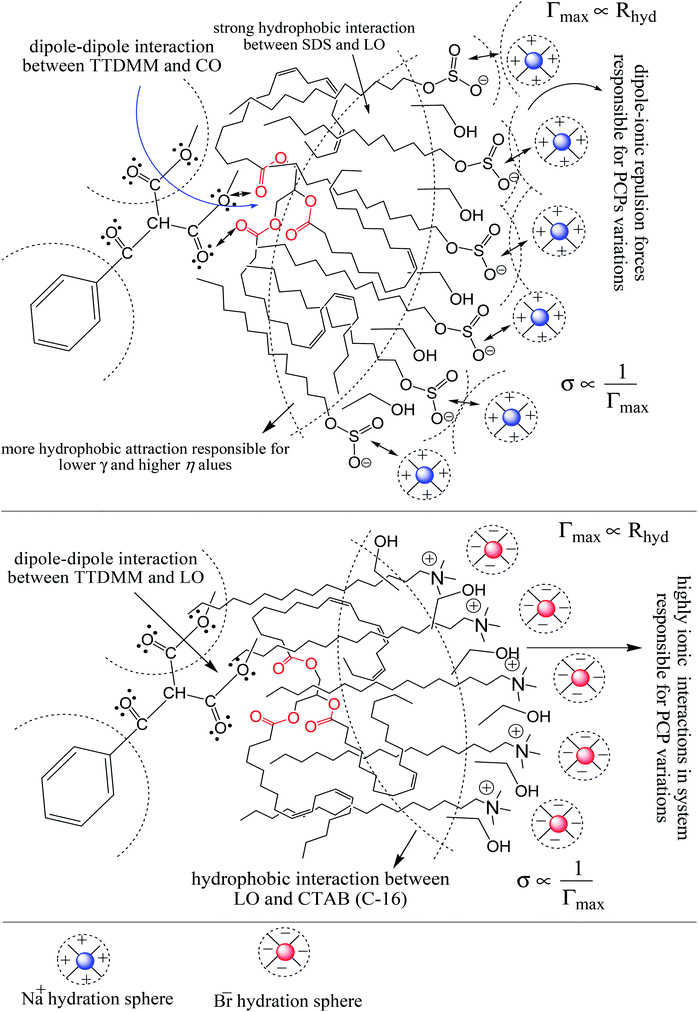
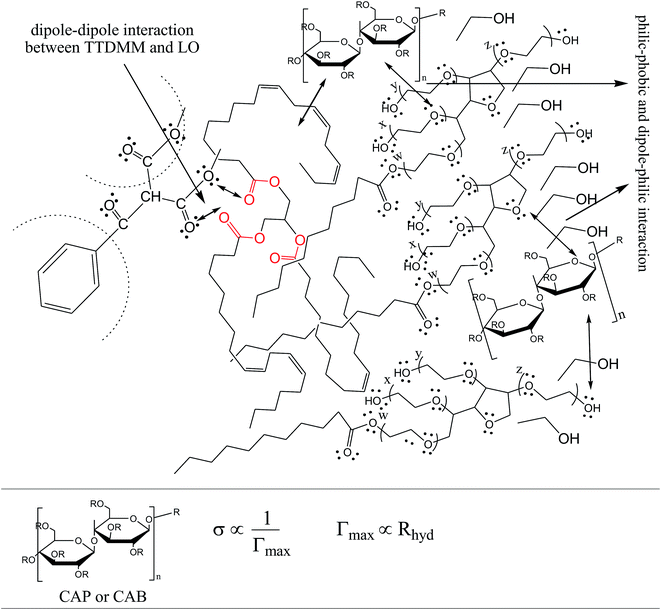
Density (ρ) values for the blank NEs, shown in Table S4,† as a function of oil, surfactant and used stabilizers, were estimated at T = 293.15, 303.15, and 313.15 K. For the blank NEs, ρ continuously decreased from 293.15 to 313.15 K due to a weakening of the cohesive force (CF) and electrostatic interactions.4,34 Such behaviour was also observed due to compositional changes with temperature that cause different solute–solvent interactions (Fig. S1†).35 With CAP, the ρ value decreased as CO > LO > OO (Tw-20 and CTAB) and the CO > OO > LO trend was observed with SDS from 293.15 to 313.15 K. It was observed that the ρ value for (OO + SDS) NEs was stable up to 303.15 K, then drastically decreased at 313.15 K and 303.15 K with CAP and CAB, respectively. Hence, the opposite trend was observed in the (OO + SDS) NEs with CAP and CAB. This may be due to a change in the hydrophobicities due to the presence of CAP and CAB.36 In the presence of TTDMM (0.166 mM), the ρ value significantly decreased at 293.15, 303.15 and 313.15 K. The decrease in ρ for the OO + CAP NEs was (0.31, 0.38, 0.37), (0.83, 0.59, 0.70) and (0.55, 0.54, 5.54)%, for the CO + CAP NEs, it was (0.41, 0.75, 0.47), (0.38, 0.61, 0.64) and (0.65, 0.65, 0.68)%, and the LO + CAP NEs, it was (0.51, 0.51, 0.55), (0.60, 0.61, 0.69) and (0.55, 0.56, 0.54)% with Tw-20, SDS and CTAB at 293.15, 303.15 and 313.15 K, respectively. The decrease in ρ was due to decreasing hydrophobic–hydrophobic interactions and dominance of the electrostatic interactions between the hydrophilic and ester moieties of TTDMM (Fig. S2, S3,† 1 and 2).37 Similarly, in the presence of CAB, the TTDMM NEs show a decrease in the ρ values: for OO + CAB, (0.38, 0.41, 0.38), (0.66, 0.67, 0.65) and (0.64, 0.61, 0.64)%, for CO + CAB, (0.35, 0.33, 0.32), (2.55, 1.03, 1.18) and (0.63, 0.65, 0.60)%, and for LO + CAB, (0.46, 0.48, 0.57), (0.51, 0.51, 0.44) and (0.64, 1.26, 0.91)% with Tw-20, SDS and CTAB at 293.15, 303.15 and 313.15 K, respectively. Thus, the density values reflect the compactness of the solution, which depends on the nature of the solute–solvent interactions.38 The temperature in terms of intermolecular interactions also plays a pivotal role in the engagement of oil droplets into TTDMM. The ρ values were higher due to multiple stronger intermolecular interactions, i.e. phobic–phobic (oil–TTDMM).3.2 Surface tension (γ)
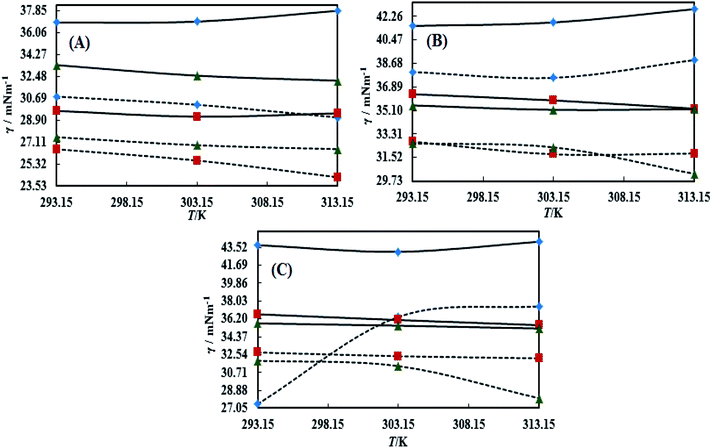
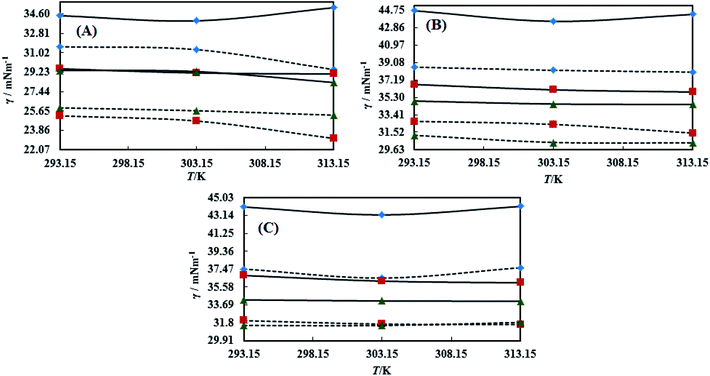
The surface tension (γ) or surface energy defines the active involvement of the NE solvent in oil activities where the cohesive force or surface energy of a solvent decreases to interact with OO, CO and LO. Stronger oil–solvent interactions reflect a weaker cohesive force with disruption of the hydrogen bonding network, with a lower γ and vice versa. The hydrophobic alkyl chain of TTDMM accumulates on the solvent surface, thereby increasing the γ value. The γ values of the prepared NEs were observed in the order of OO > CO > LO, and they are listed in Table S5,† where the γ values for the blank NEs decrease for all formulations with increasing T = 293.15, 303.15 and 313.15 K, except for OO + CTAB (CAP or CAB) NEs and OO + SDS + CAP NEs (Fig. 3). The decrease in the γ values infers an increase in molecular thermal activity and hydrogen bonding, due to which the binding forces or cohesive forces weakened at the same rate. The decrease in γ for (OO + TW-20 + CAP NEs) was 5.54% from 293.15 to 313.15 K. For the CO + CAP NEs, the γ values decreased by 8.60, 2.77 and 1.82%, and for the LO + CAP NEs, they decreased by 3.59, 7.08 and 12.03% with Tw-20, SDS and CTAB from 293.15 to 313.15 K, respectively. The observed decreasing order of the γ values for the CAP stabilized NEs is (Tw-20 > SDS > CTAB) with CO and (CTAB > SDS > Tw-20) with LO (Fig. 3). For the CAB stabilized NEs, the decreasing order of γ values is (Tw-20 > SDS) with OO, (Tw-20 > SDS > CTAB) with CO, and (SDS > Tw-20) with LO from 293.15 to 313.15 K (Fig. 4). The decreased γ values infer attenuation of water, surfactants and stabilizer (CAP or CAB) molecules. In the CAB stabilized NEs, the γ values decrease for the OO NEs by 6.65 and 1.40% for Tw-20 and SDS, respectively, for the CO NEs, they decrease by 8.24, 3.92 and 1.30% with Tw-20, SDS and CTAB, respectively, and for the LO NEs, they decrease by 2.62 and 2.63% with Tw-20 and SDS, respectively, from 293.15 to 313.15 K. The presence of hydrophobicities in the bulk system of NEs reduced the net inward force gradient via decreasing the surface energy of individual molecules, which reduced the γ values. Furthermore, with increasing temperature, the kinetic energy of the individual molecules increases, which weakens the effectiveness of the intermolecular interactions between oil and solvent components.39,40 Thus, this increased molecular motion makes it easier to stretch the solvent surface, which causes the lowering of γ. Likewise, the γ values increased by 2.40 and 36.37% for the CAP stabilized OO + SDS and OO + CTAB systems, respectively, and 0.37 and 1.03% for the CAB stabilized OO + CTAB and LO + CTAB systems from 293.15 to 313.15 K. This may be due to the highest charge density shown by the ionic surfactants via formation of individual hydration spheres (![[triple bond, length as m-dash]](https://www.rsc.org/images/entities/char_e002.gif) N+–, Br−, –SO3− and Na+), which may not interfere with the phobic–phobic and philic–phobic interactions (Fig. S2, S3,† 1 and 2).
N+–, Br−, –SO3− and Na+), which may not interfere with the phobic–phobic and philic–phobic interactions (Fig. S2, S3,† 1 and 2).
In the presence of TTDMM (0.166 mM) in the CAP stabilized NEs, the γ values increased compared to the blank NEs; for OO + CAP NE systems, (CTAB > Tw-20 > SDS) by (37.18, 16.40 and 8.46%) at 293.15 K, (Tw-20 > CTAB > SDS) by (18.39, 15.47 and 10.07%) at 303.15 K, and (Tw-20 > CTAB > SDS) by (23.05, 15.01 and 9.05%) at 313.15 K. For the CO + CAP NE systems, the γ value increments are (CTAB > Tw-20 > CTAB) by (10.63, 10.61 and 9.92%) at 293.15 K, (Tw-20 > SDS > CTAB) by (12.24, 11.42 and 10.23%) at 303.15 K, and (Tw-20 > SDS > CTAB) by (17.74, 9.68 and 9.53%) at 313.15 K. For the LO + CAP NE systems (Fig. 3), the γ value increments are (Tw-20 > CTAB > SDS) by (17.65, 10.68 and 8.17%), (Tw-20 > CTAB > SDS) by (17.50, 11.65 and 8.11%), and (CTAB > Tw-20 > SDS) by (20.48, 17.45 and 14.0%) at 293.15, 303.15 and 313.15 K, respectively (Table S5†). Similarly, in CAB stabilized NEs, the γ values increased for the OO + CAB NE systems as (CTAB > SDS > Tw-20) by (14.88, 13.72 and 8.35%), (CTAB > SDS > Tw-20) by (15.45, 15.20 and 7.81%), and (Tw-20 > CTAB > SDS) by (16.24, 14.69 and 14.16%) at 293.15, 303.15 and 313.15 K, respectively. For the CO + CAB NE systems (Fig. 4), the γ value increment order is (Tw-20 > CTAB > SDS) by (14.77, 12.96 and 10.91%), (Tw-20 > CTAB > SDS) by (15.22, 12.54 and 10.38%), and (Tw-20 > SDS > CTAB) by (20.50, 12.45 and 12.25%) at 293.15, 303.15 and 313.15 K, respectively. Further, for the LO + CAB NE systems, the γ value increment order is (Tw-20 > SDS > CTAB) by (11.77, 10.69 and 7.89%), (Tw-20 > SDS > CTAB) by (12.37, 12.09 and 7.62%), and (SDS > Tw-20 > CTAB) by (12.11, 10.68 and 6.57%) at 293.15, 303.15 and 313.15 K, respectively (Table S5†). As compared to the blank and DNEs, the γ values are highly increased, hence the addition of TTDMM increased the hydrophobic domain in the system. Furthermore, due to the presence of hydrophobic dominance between the long alkyl chain of the fatty acid, surfactant and TTDMM, the molecular orientation of hydrophobic chains forms a stable film around the NE surface (Fig. S2, S3,† 1 and 2).36,39
3.3 Viscosity (η)
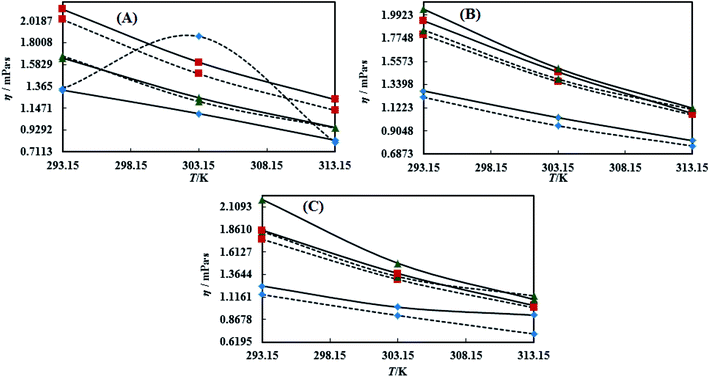
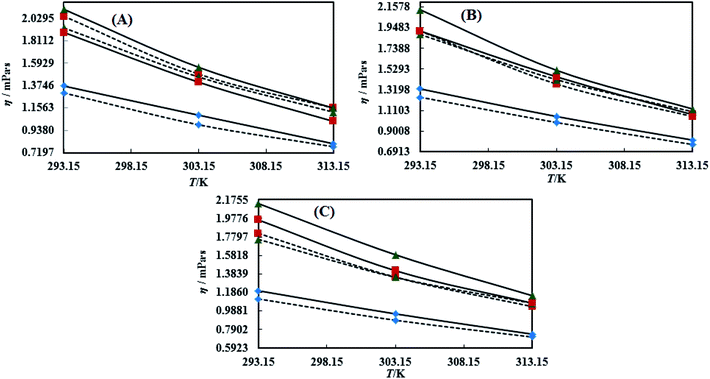
Viscosity (η) values of the BNEs and DNEs are given in Table S6.† The η values of blank NEs with CAP or CAB strongly decrease with increasing temperature from 293.15 to 313.15 K. The decrements in η values for OO + CAP are (40.17, 37.40 and 37.99%), for CO + CAP, they are (44.59, 41.61 and 43.06%), and for LO + CAP, they are (43.10, 40.29 and 38.58%) with Tw-30, SDS and CTAB from 293.15 to 313.15 K, respectively (Fig. 5). Similarly, for the CAB stabilized NEs, the decrease in η values for OO is (40.21, 38.49 and 36.40%), for CO, it is (43.61, 45.18 and 43.02%), and for LO, it is (42.39, 41.58 and 38.90%) with Tw-20, SDS and CTAB from 293.15 to 313.15 K, respectively (Table S6†). Therefore, with rising temperature caused by higher molecular thermal activity, the structure of the system develops a fast flow through a uniform capillary with a shorter time and weakens frictional forces on the laminar flow.33,41 On comparison of the η values, it is clear that higher values were observed with the Tw-20 surfactant. The η values for the blank NEs were observed in the order of (Tw-20 > SDS > CTAB) for the OO and CO (CAP or CAB) systems, (SDS > CTAB > Tw-20) for LO + CAP, and (Tw-20 > SDS > CTAB) for the LO + CAB NE systems (Table S6† and Fig. 6). The highest η values being observed with the Tw-20 surfactant (for both CAP and CAB) prove that it may develop stronger interactions with strong bonding and form a rigid system, and that adjacent laminar flow takes a longer time within a uniform capillary (Fig. S2, S3,† 1 and 2).42In the presence of TTDMM, the η values increase for both CAP and CAB stabilized NEs. The increment in η values is (4.68, 7.53 and 6.05%) and (7.69, 9.11 and 22.61%) for OO + CAP with SDS and CTAB at 293.15, 303.15 and 313.15 K, respectively. For the CO + CAP NEs, the increments are (4.87, 7.23 and 8.75%), (6.83, 6.32 and 1.28%), and (5.42, 4.83 and 2.36%) with Tw-20, SDS and CTAB at 293.15, 303.15 and 313.15 K, respectively. For the LO + CAP NEs, the increments are (9.57, 6.82 and 1.14%) with SDS at 293.15, 303.15 and 313.15 K, respectively. Interestingly, the η values decrease for OO + CAP + Tw-20 by 0.99 and 41.33% at 293.15 and 303.15 K, respectively, and for LO + CAP NEs with Tw-20 and CTAB, they decrease by 1.21 and 3.60% at 293.15 and 313.15 K, respectively. Further, for the CAB stabilized NEs, the η values increased in the presence of TTDMM. The increments for the OO + CAB NEs are (4.91, 8.57 and 3.58%), (6.34, 5.81 and 5.58%), and (7.29, 7.15 and 4.15%) with Tw-20, SDS and CTAB at 293.15, 303.15 and 313.15 K, respectively. For the CO + CAB NEs, the increase in the η values are (0.03, 5.05 and 1.77%) and (7.26, 4.89 and 3.37%) with SDS and CTAB at 293.15, 303.15 and 313.15 K, respectively. For the LO + CAB NEs, the increments are (8.54, 6.09 and 3.35%), (11.71, 6.26 and 2.44%), and (17.91, 15.22 and 7.06%) with Tw-20, SDS and CTAB at 293.15, 303.15 and 313.15 K, respectively (Fig. 5 and 6). The increase in the η values reflects the increase in hydrophobicity, where greater phobic–phobic interactions and phobic–philic repulsion are observed. However, the η values also decreased for CO + CAB with Tw-20 by 7.68, 5.32 and 11.28% at 293.15, 303.15 and 313.15, respectively (Fig. S2, S3,† 1 and 2).
3.4 Dual force interconversion via friccohesity (σ)
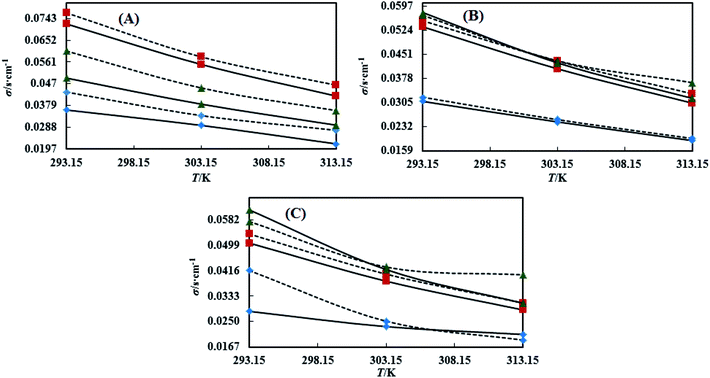
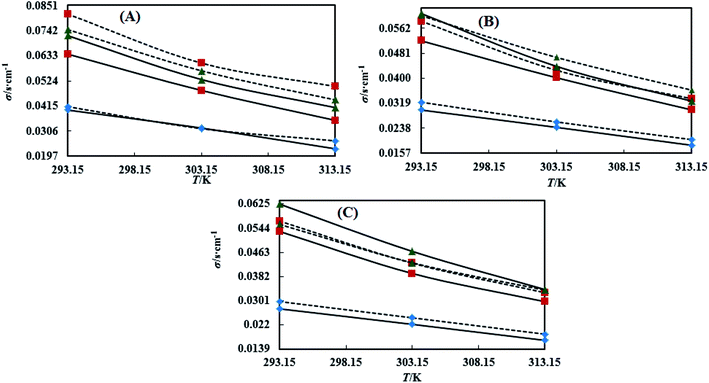
Table S7† shows that the σ values of the NEs decreased with temperature by 30–55% for both CAP and CAB stabilized NEs. This could be attributed to weakening in frictional force (FF) and cohesive force (CF) at higher kinetic energy of individual molecules. However, the decrements in the σ values observed in linear trends also show the proper homogenization of CF and FF. The σ values of the oils were observed in a different order: for CAP NEs, (CO > LO > OO), (CO > LO > OO), and (LO > CO > OO) with Tw-20, SDS and CTAB, respectively. Similarly, in the presence of TTDMM, the order for the CAP NEs is (CO > LO > OO), (LO > CO > OO), and (LO > CO > OO) with Tw-20, SDS and CTAB, respectively (Fig. 7). Further, for the CAB NEs, the trend of σ values observed was (CO > LO > OO), (CO > LO > OO), and (LO = CO > OO) with Tw-20, SDS and CTAB, respectively. In the presence of TTDMM with CAB, the trend of σ values observed was (LO > CO > OO), (LO > CO > OO), and (LO > CO > OO) with Tw-20, SDS and CTAB, respectively (Fig. 8). These trends depict the actively participating π conjugated molecules in the NE dispersion, which increase the phobic–phobic and philic–phobic interactions via dual force interconversion. As shown in Table S7,† the NEs with CAP and CAB get stabilized, and in the presence of TTDMM, higher σ values are observed for the Tw-20 NEs. This may be due to effective inter-conversion of CF to FF via the long alkyl chain of Tw-20 with oil, which would develop FF due to CAP or CAB with its bulkiness as compared to SDS and CTAB. However, for both CAP and CAB NEs, the lowest σ values were observed with the CTAB and SDS surfactants, which suggests hydration sphere formation by![[triple bond, length as m-dash]](https://www.rsc.org/images/entities/char_e002.gif) N+– and Br− (CTAB), and –SO3− and Na+ (SDS), where these ions are responsible for the higher entropy of the NE system (Fig. 7 and 8). Hence, the small Na+ and Br− hydration spheres of SDS and CTAB, respectively, interfere in the phobic–phobic interactions.43 In the current study, the σ value of the NEs effectively shows the stability and dispersion behaviour of TTDMM in the NE system (Fig. S2, S3,† 1 and 2).
N+– and Br− (CTAB), and –SO3− and Na+ (SDS), where these ions are responsible for the higher entropy of the NE system (Fig. 7 and 8). Hence, the small Na+ and Br− hydration spheres of SDS and CTAB, respectively, interfere in the phobic–phobic interactions.43 In the current study, the σ value of the NEs effectively shows the stability and dispersion behaviour of TTDMM in the NE system (Fig. S2, S3,† 1 and 2).
3.5 Hydrodynamic radius (Rhyd)
The Rhyd values for the BNEs and DNEs are given in Table S8,† as a function of oil, surfactant and co-surfactant addition, and temperature from 293.15 to 313.15 K. The Rhyd values provide detailed information about how the oil–surfactant dispersion and hydration spheres of the ionic part of the surfactants hindered the tendencies in the bulk of the system. Due to this hindered tendency of hydrophobic and hydrophilic interactions, there is rotational conversion in the philic–phobic forces, which increases the energy decrease at a constant shear flow rate.4 In our study, the Rhyd results suggest the significant possibilities of nanoemulsion self-assemblies with perfect molecular arrangements. As compared to the BNEs, the DNEs had smaller Rhyd values with selected NE components (Table S8†). The Rhyd of the BNEs decreased with increasing temperature from 293.15 to 313.15 K, whereas it increased for LO + CAP with SDS and CTAB, and LO + CAB with Tw-20 and SDS, attributed to the immediately weaker structural orientation at higher thermal energy. Furthermore, with increasing temperature from 293.15 to 313.15 K, hydration sphere formation by –SO3− and Na+ is repressed, weakening intermolecular forces due to the presence of charge density on the ions and TTDMM ester moiety. For the BNEs and DNEs, Rhyd > 0 could infer a spherical shape of the NE droplets. Rhyd < 0 suggests a majority of hydrophobicity and non-spherical shape in the case of LO + CAP BNEs with Tw-20, due to the presence of unsaturated pi-conjugation, which completely favours phobic–phobic interactions with the long alkyl chain of Tw-20. In the presence of TTDMM, Rhyd < 0 is also observed in the case of CO + CAB with Tw-20 at 293.15, 303.15 and 313.15 K, OO + CAP with Tw-20 at 293.15 K, and LO + CAP with Tw-20 at 293.15 K. The wider Rhyd variation with different oils and surfactants with increasing temperature indicates the decrease in solute–solvent interactions. Such trends reveal that![[triple bond, length as m-dash]](https://www.rsc.org/images/entities/char_e002.gif) N+–, Br−, –SO3− and Na+ form their own hydration spheres, which show contrasting electrostatic repulsion in between the hydration spheres and the TTDMM ester moiety, which leads to discrete chemical interactions in the NE bulk system.30 This could be due to secondary CF working within the system, which also explains the η and γ values (Table S8†).
N+–, Br−, –SO3− and Na+ form their own hydration spheres, which show contrasting electrostatic repulsion in between the hydration spheres and the TTDMM ester moiety, which leads to discrete chemical interactions in the NE bulk system.30 This could be due to secondary CF working within the system, which also explains the η and γ values (Table S8†).
3.6 Surface excess concentration (Γmax) and surface area (1/Γmax) per molecule
To understand the oil–TTDMM and surfactant interfaces, ionic surfactant hydration sphere formation by![[triple bond, length as m-dash]](https://www.rsc.org/images/entities/char_e002.gif) N+–, Br−, –SO3− and Na+ and consequent surface segregation of water molecules and the NE interface, Γmax values of the blank and DNEs at the air–water interface (AWI) were obtained using Gibbs eqn (2). Tables S9 and S10† show the temperature dependent (from 293.15 to 313.15 K) Γmax and (Γmax)−1 values of the blank and DNEs, where a negative slope was observed for the blank and DNEs stabilized with both CAP and CAB, which suggests the stronger hydrophilic stabilization of the oil–water droplet interfaces. However, in the OO + CAP + CTAB blank NEs, Γmax shows a positive increase that caused a small disturbance to the oil–water interface. Although blank NEs with Tw-20, SDS and CTAB in the presence of both CAP and CAB were stabilized systems, Γmax showed a decrease from 293.15 to 313.15 K. The decreases for OO + CAP are 14.67 and 4.14%, for CO + CAP they are 14.44 and 8.98%, and for LO + CAP they are 9.75 and 13.02% with Tw-20 and SDS, respectively, from 293.15 to 313.15 K. However, in the presence of CTAB with the OO + CAP NEs, Γmax shows an increase of 27.66% and again decreased by 8.09 and 17.65% for the CO + CAP and LO + CAP NEs, respectively. Similarly, the Γmax of the CAB stabilized NEs shows an increase for OO + CAB of 7.29, 7.70 and 6.04%, for CO + CAB of 14.10, 10.05 and 7.62%, and for LO + CAB of 8.84, 8.85 and 5.43% with Tw-20, SDS and CTAB at 293.15 to 313.15 K, respectively. This increase illustrates the stronger oil–water surface activity with higher dispersion patterns of the NEs. Furthermore, in the presence of TTDMM, the Γmax values increased, which indicated the stronger oil–TTDMM dispersion within the aqueous surfactants with CAP or CAB. The increases in the Γmax values for the OO + CAP NEs are 16.40, 18.39 and 23.05% with Tw-20, 8.46, 10.07 and 9.05% with SDS, and 37.18, 15.47 and 15.10% with CTAB at 293.15, 303.15 and 313.15 K, respectively. For the CO + CAP NEs, the increases in the Γmax values are 10.61, 12.24 and 17.74% with Tw-20, 9.92, 11.42 and 9.68% with SDS, and 10.63, 10.23 and 9.53% with CTAB at 293.15, 303.15 and 313.15 K, respectively. For the LO + CAP NEs, the increases in the Γmax values are 17.65, 17.50 and 17.45% with Tw-20, 8.17, 8.11 and 14% with SDS, and 10.64, 11.65 and 20.08% with CTAB at 293.15, 303.15 and 313.15 K, respectively. Additionally, the kinetic energy of the system from 293.15 to 313.15 K also influences the hydration spheres (formed by ionic surfactants) and kinetic energy transport of individual molecules, which stimulated the oil–water surface segregation. Hence, the increases in the Γmax values observed in random order or drastic variations from 293.15 to 313.15 K could be due to greater ionic dissociation by CTAB and SDS, creating a higher kinetic energy that attracts a higher Br− and Na+ hydration sphere population to the bulk via electrostatic interactions.44
N+–, Br−, –SO3− and Na+ and consequent surface segregation of water molecules and the NE interface, Γmax values of the blank and DNEs at the air–water interface (AWI) were obtained using Gibbs eqn (2). Tables S9 and S10† show the temperature dependent (from 293.15 to 313.15 K) Γmax and (Γmax)−1 values of the blank and DNEs, where a negative slope was observed for the blank and DNEs stabilized with both CAP and CAB, which suggests the stronger hydrophilic stabilization of the oil–water droplet interfaces. However, in the OO + CAP + CTAB blank NEs, Γmax shows a positive increase that caused a small disturbance to the oil–water interface. Although blank NEs with Tw-20, SDS and CTAB in the presence of both CAP and CAB were stabilized systems, Γmax showed a decrease from 293.15 to 313.15 K. The decreases for OO + CAP are 14.67 and 4.14%, for CO + CAP they are 14.44 and 8.98%, and for LO + CAP they are 9.75 and 13.02% with Tw-20 and SDS, respectively, from 293.15 to 313.15 K. However, in the presence of CTAB with the OO + CAP NEs, Γmax shows an increase of 27.66% and again decreased by 8.09 and 17.65% for the CO + CAP and LO + CAP NEs, respectively. Similarly, the Γmax of the CAB stabilized NEs shows an increase for OO + CAB of 7.29, 7.70 and 6.04%, for CO + CAB of 14.10, 10.05 and 7.62%, and for LO + CAB of 8.84, 8.85 and 5.43% with Tw-20, SDS and CTAB at 293.15 to 313.15 K, respectively. This increase illustrates the stronger oil–water surface activity with higher dispersion patterns of the NEs. Furthermore, in the presence of TTDMM, the Γmax values increased, which indicated the stronger oil–TTDMM dispersion within the aqueous surfactants with CAP or CAB. The increases in the Γmax values for the OO + CAP NEs are 16.40, 18.39 and 23.05% with Tw-20, 8.46, 10.07 and 9.05% with SDS, and 37.18, 15.47 and 15.10% with CTAB at 293.15, 303.15 and 313.15 K, respectively. For the CO + CAP NEs, the increases in the Γmax values are 10.61, 12.24 and 17.74% with Tw-20, 9.92, 11.42 and 9.68% with SDS, and 10.63, 10.23 and 9.53% with CTAB at 293.15, 303.15 and 313.15 K, respectively. For the LO + CAP NEs, the increases in the Γmax values are 17.65, 17.50 and 17.45% with Tw-20, 8.17, 8.11 and 14% with SDS, and 10.64, 11.65 and 20.08% with CTAB at 293.15, 303.15 and 313.15 K, respectively. Additionally, the kinetic energy of the system from 293.15 to 313.15 K also influences the hydration spheres (formed by ionic surfactants) and kinetic energy transport of individual molecules, which stimulated the oil–water surface segregation. Hence, the increases in the Γmax values observed in random order or drastic variations from 293.15 to 313.15 K could be due to greater ionic dissociation by CTAB and SDS, creating a higher kinetic energy that attracts a higher Br− and Na+ hydration sphere population to the bulk via electrostatic interactions.44
3.7 Particle size and zeta potential measurements
Tables S11 and S12† contain the particle size (PS), PDI and zeta potential values of the BNEs and DNEs, where PS was obtained in the range of 171.3 ± 2.1 to 322.2 ± 6.2 nm for the BNEs and 78.8 ± 4.4 to 176.8 ± 3.5 nm for the DNEs, and the PDI values were obtained in the range of 0.149 ± 0.029 to 0.881 ± 0.031 for the BNEs and 0.060 ± 0.017 to 0.356 ± 0.009 for the DNEs, showing the homogeneity of the NEs after TTDMM dispersion. The obtained PS and PDI values for the BNEs show regular variation, which suggests that the oil–surfactant interaction materialized on account of the distinctly oscillating hydrophilic and hydrophobic domains of the medium components. An irregular variation also infers interaction patterns of oil and different cationic, anionic and non-ionic surfactants with CAP and CAB, which are also responsible for abrupt Brownian motions. In the TTDMM dispersed NEs, PS and PDI values of >176.8 ± 3.5 nm and 0.356 ± 0.009 were obtained, respectively, which implies that the TTDMM dispersed oil droplets of the DNEs have a similar size distribution to the BNEs, which is considered as a reliable synergistic effect of medium interactions between TTDMM and oil with different surfactants. Hence, the PDI values of >0.350 account for the uniform compositional behaviour of the prepared NEs. Furthermore, vital key zeta potential data were measured using dynamic light scattering, which indicated the moderate stability of the NEs. Hence, in this study, after TTDMM dispersion in the NEs, the obtained PS, PDI and zeta potential values showed the higher stability and dispersion, and non-uniformity of the TTDMM–oil nanodroplets with the CAP and CAB additives, as compared to the BNEs.3.8 Antioxidant activity of the TTDMM dispersed NEs
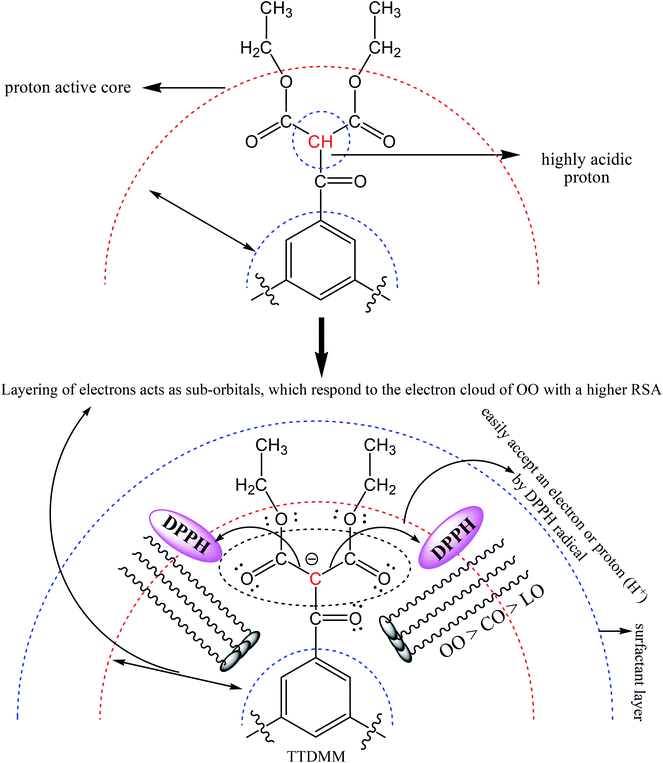
Fig. 9 depicts the antioxidant activity of the blank and DNEs, where the DNE system shows an excellent radical scavenging activity as compared to the aqueous surfactant solution. This may be due to the catalytic activity of oil causing TTDMM to undergo a chemical process, which favours the release of H+ ions into the NE system.32,33 The donated H+ ions are easily accepted by the DPPH radical to become a stable diamagnetic molecule. In the presence of TTDMM, the oil–TTDMM mixture having strong phobic–phobic interactions with a higher surface area would also be responsible for the higher radical scavenging activity.28 As shown in Fig. 9, the % RSA was observed in the order of OO > LO > CO, because a larger number of pi bonds could strengthen the hydrophobic interactions with TTDMM (Fig. 10). The highest antioxidant activity was observed for the OO NEs that have electron clouds on the TTDMM surface, which act as sub-orbitals. Thus, these sub-orbitals respond to the electron cloud of OO, producing 97.89% DPPH scavenging activity; hence, such a constricting mechanism favours H+ release from TTDMM more easily. However, the three –OH groups of CO inhibit the electron cloud, which reduces the electron repulsion. Similarly, in the case of LO, the presence of an asymmetric pi bond distribution favoured a disturbed molecular alignment and orientation, hence inhibiting the H+ releasing activity. Hence, the oil–TTDMM hydrophobic interaction dominated over the water–ethyl acetate, ethanol and glycerol interactions, which could not interfere with the oil–TTDMM hydrophobicity. Furthermore, the hydrophilic part of Tw-20, SDS and CTAB might also not affect the hydrophobic interaction, hence the hydrophilic part of the surfactants engaged with the water–ethyl acetate, ethanol and glycerol interfaces. For the CAP stabilized NEs, antioxidant activity was observed in the order of Tw-20 > CTAB > SDS for all of the selected oils. Similarly, for the CAB stabilized NEs, the activity orders are CTAB > SDS > Tw-20, Tw-20 > CTAB > SDS, and Tw-20 > CTAB > SDS with OO, CO and LO, respectively. The highest antioxidant activity was observed with Tw-20, due to strong hydrophobic engagement in oil–TTDMM-Tw20. This also proves that TTDMM remained in cluster form where the benzene ring in the core has delocalized pi electrons, which affect the nearby non-bonding electron pairs that undergo electron–electron repulsion as per the Lennard-Jones potential.19 In general, electron shielding of H-bonded –CH– of TTDMM shows a transition state, and these activities only happen in the case of the mono-dispersed form, not in the agglomerated or aggregated form. In the presence of TTDMM, the lowest antioxidant activity of the DNEs was obtained with SDS, which may be due to the development of electrostatic interactions between the –SO3−, Na+ and electron rich sites of the ester groups (![[double bond splayed left]](https://www.rsc.org/images/entities/char_e009.gif) C
C![[double bond, length as m-dash]](https://www.rsc.org/images/entities/char_e001.gif) O and –COO–) of TTDMM. These results show an inhibition in the electron donating affinity of the ester group, which is responsible for the decreasing radical scavenging activity.
O and –COO–) of TTDMM. These results show an inhibition in the electron donating affinity of the ester group, which is responsible for the decreasing radical scavenging activity.
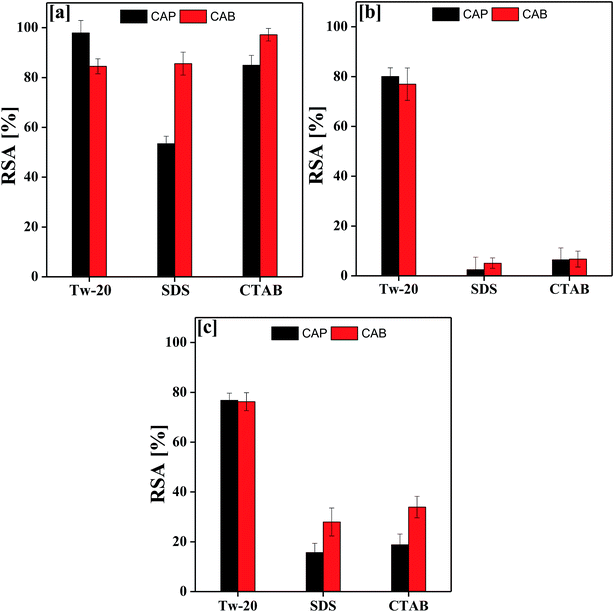 | ||
| Fig. 9 Antioxidant activity of TTDMM nanoemulsions (DNEs) with (a) OO, (b) CO and (c) LO with anionic, cationic and non-ionic surfactants. | ||
4. Conclusions
The stable nanoemulsions of a TTDMM dendrimer have been successfully prepared and analysed for the effect of philic–phobic modulation. The interaction activities of different oils, surfactants and chemical additives for TTDMM stabilization have been reported in the current study with their physicochemical properties (PCPs) estimated at T = 293.15 to 313.15 K. It has been revealed that the variation in PCPs with a change in temperature along with added additives shows the dispersion of the TTDMM–oil interaction with cationic, anionic and non-ionic surfactants. The strong phobic–phobic interaction between long alkyl chains of the oils and surfactants produced structural compactness that led to a lower ρ, where the free ion, i.e. Na+ and Br−, hydration spheres developed a dynamic structural modulation. Therefore, the presence of unsaturated moieties in the oils and different surfactants influenced the PCPs of the NEs and DNEs. The philic–phobic, phobic–phobic and different electrostatic interactions play the greatest role in TTDMM dispersion, along with NE stability.Conflicts of interest
There are no conflicts to declare.Acknowledgements
Authors are thankful to Central Instrumental facility, Central University of Gujarat, Gandhinagar (CIF-CUG), Deenbandhu Chhotu Ram University of Science and Technology, Murthal for providing necessary experimental facilities. Authors are also thanks to Government of India for the award of research fellowship under the project TEQIP-III.References
- S. Uluata, E. A. Decker and D. J. McClements, Food Biophys., 2016, 11, 52–59 CrossRef.
- K. Tong, C. Zhao, Z. Sun and D. Sun, ACS Sustainable Chem. Eng., 2015, 3, 3299–3306 CrossRef CAS.
- L. Salvia-Trujillo, R. Soliva-Fortuny, M. A. Rojas-Graü, D. J. McClements and O. Martín-Belloso, Annu. Rev. Food Sci. Technol., 2017, 8, 439–466 CrossRef CAS PubMed.
- A. K. Jangid, P. Malik and M. Singh, J. Mol. Liq., 2018, 259, 439–452 CrossRef CAS.
- G. Gotchev, T. Kolarov, K. Khristov and D. Exerowa, Adv. Colloid Interface Sci., 2011, 168, 79–84 CrossRef CAS PubMed.
- J. E. Kim and Y. J. Park, Colloids Surf., B, 2017, 150, 362–372 CrossRef CAS PubMed.
- P. Karthik, P. N. Ezhilarasi and C. Anandharamakrishnan, Challenges associated in stability of food grade nanoemulsions, 2017 Search PubMed.
- A. K. Jangid, D. Pooja and H. Kulhari, RSC Adv., 2018, 8, 28836–28842 RSC.
- T. J. Wooster, D. Labbett, P. Sanguansri and H. Andrews, Soft Matter, 2016, 12, 1425–1435 RSC.
- A. Kumar, H. Agraval, N. Gupta, U. C. S. Yadav and R. Sistla, Colloids Surf., B, 2019, 175, 202–211 CrossRef PubMed.
- R. M. Shah, D. S. Eldridge, E. A. Palombo and I. H. Harding, Eur. J. Pharm. Biopharm., 2017, 117, 141–150 CrossRef CAS PubMed.
- M. Hessien, N. Singh, C. Kim and E. Prouzet, Langmuir, 2011, 27, 2299–2307 CrossRef CAS PubMed.
- K. Kaur, R. Kumar and S. K. Mehta, J. Mol. Liq., 2015, 209, 62–70 CrossRef CAS.
- N. Sharma, P. Madan and S. Lin, Asian J. Pharm. Sci., 2016, 11, 404–416 CrossRef.
- N. Dubey, J. Mol. Liq., 2013, 184, 60–67 CrossRef CAS.
- I. Hoffmann, M. Simon, A. Hörmann, T. Gravert, P. Heunemann, S. E. Rogers and M. Gradzielski, Langmuir, 2016, 32, 12084–12090 CrossRef CAS PubMed.
- J. Li, Y. Yang, L. Lu, Q. Ma and J. Zhang, Int. J. Nanomed., 2018, 13, 2129–2141 CrossRef CAS PubMed.
- J. Rao and D. J. McClements, J. Agric. Food Chem., 2010, 58, 7059–7066 CrossRef CAS PubMed.
- R. Kumar, K. Kaur, S. Uppal and S. K. Mehta, Ultrasound processed nanoemulsion: A comparative approach between resveratrol and resveratrol cyclodextrin inclusion complex to study its binding interactions, antioxidant activity and UV light stability, 2017 Search PubMed.
- C. Bilbao-Sáinz, R. J. Avena-Bustillos, D. F. Wood, T. G. Williams and T. H. McHugh, J. Agric. Food Chem., 2010, 58, 11932–11938 CrossRef PubMed.
- L. Ghaicha, R. M. Leblanc, F. Villamagna and a K. Chattopadhyay, Langmuir, 1995, 11, 585–590 CrossRef CAS.
- L. Wang and Y. Zhang, J. Agric. Food Chem., 2017, 65, 2990–2998 CrossRef CAS PubMed.
- T. J. Wooster, M. Golding and P. Sanguansri, Langmuir, 2008, 24, 12758–12765 CrossRef CAS PubMed.
- M. Singh, J. Biochem. Biophys. Methods, 2006, 67, 151–161 CrossRef CAS PubMed.
- M. Singh and S. Singh, Survismeter: fundamentals, aspects and applications, Pan stanford publishing Pte. Ltd., Singapore, ISBN: 978-981-4774-70-3(Hardcover), ISBN: 978-0-429-02761-1(eBook) 2019 Search PubMed.
- N. K. Sharma, M. Singh and A. Bhattarai, RSC Adv., 2016, 6, 90607–90623 RSC.
- A. Bhattarai, K. Pathak and B. Dev, J. Mol. Liq., 2017, 229, 153–160 CrossRef CAS.
- R. G. Lebel and D. A. I. Goring, J. Chem. Eng. Data, 1962, 7, 100–101 CrossRef CAS.
- B. Naseem, A. Jamal and A. Jamal, J. Mol. Liq., 2013, 181, 68–76 CrossRef CAS.
- W. J. Cheong and P. W. Carr, J. Liq. Chromatogr., 1987, 10, 561–581 CrossRef CAS.
- A. Einstein, Ann. Phys., 1906, 19, 289 CrossRef CAS.
- P. Malik, R. K. Ameta and M. Singh, Chem.-Biol. Interact., 2014, 222, 77–86 CrossRef CAS PubMed.
- P. Malik, R. K. Ameta and M. Singh, J. Mol. Liq., 2016, 220, 604–622 CrossRef CAS.
- K. M. Sachin, A. Chandra and M. Singh, J. Mol. Liq., 2017, 246, 379–395 CrossRef CAS.
- I. Bahadur and N. Deenadayalu, Thermochim. Acta, 2013, 566, 77–83 CrossRef CAS.
- J. Khanna, M. Singh, H. Om and K. Behera, Thermochim. Acta, 2016, 641, 43–48 CrossRef.
- N. Vashistha, A. Chandra and M. Singh, J. Mol. Liq., 2018, 260, 323–341 CrossRef CAS.
- K. M. Sachin, S. A. Karpe, M. Singh and A. Bhattarai, J. Chem., 2018, 2018, 1–17 CrossRef.
- J. Khanna, M. Singh, H. Om, K. Behera and M. Gulia, J. Mol. Liq., 2017, 225, 758–766 CrossRef.
- K. M. Sachin, S. Karpe, M. Singh and A. Bhattarai, Macromol. Symp., 2018, 379, 1700034 CrossRef.
- P. Malik and M. Singh, New J. Chem., 2017, 41, 12506–12519 RSC.
- D. Kumar, A. Chandra and M. Singh, J. Solution Chem., 2016, 45, 750–771 CrossRef CAS.
- A. Chandra, V. Patidar, M. Singh and R. K. Kale, J. Chem. Thermodyn., 2013, 65, 18–28 CrossRef CAS.
- K. M. Sachin, S. A. Karpe, M. Singh and A. Bhattarai, R. Soc. Open Sci., 2019, 6, 181979 CrossRef.
Footnote |
| † Electronic supplementary information (ESI) available. See DOI: 10.1039/c9ra00728h |
| This journal is © The Royal Society of Chemistry 2019 |


