 Open Access Article
One-pot synthesis of hollow hydrangea Au nanoparticles as a dual catalyst with SERS activity for in situ monitoring of a reduction reaction†
Yazhou Qina,
Yuxiang Luab,
Wufan Panab,
Dongdong Yuc and
Jianguang Zhou *ab
*ab
aState Key Laboratory of Industrial Control Technology, College of Control Science and Engineering, Zhejiang University, 38 Zheda Road, Hangzhou 310027, P. R. China. E-mail: jgzhou@zju.edu.cn
bDepartment of Chemistry, Zhejiang University, Hangzhou, 310027, China
cHospital of Zhejiang University, Zhejiang University, Hangzhou, 310027, China
First published on 2nd April 2019
Abstract
The controlled synthesis of metallic nanomaterials has attracted the interest of many researchers due to their shape-dependent physical and chemical properties. However, most of the synthesized nanocrystals cannot be combined with spectroscopy to measure the reaction kinetics, thus limiting their use in monitoring the catalytic reaction process to elucidate its mechanism. As a powerful analytical tool, surface-enhanced Raman spectroscopy (SERS) can be used to achieve in situ monitoring of catalytic reactions by developing bifunctional metal nanocrystals with both SERS and catalytic activities. Herein, we have developed a simple one-pot synthesis method for the large-scale and size-controllable preparation of highly rough hydrangea Au hollow nanoparticles. The growth mechanism of flower-like Au hollow nanostructures was also discussed. The hollow nanostructure with a 3D hierarchical flower shell combines the advantages of hollow nanostructure and hierarchical nanostructure, which possess high SERS activity and good catalytic activity simultaneously. Furthermore, the hydrangea Au hollow crystals were used as a bifunctional nanocatalyst for in situ monitoring of the reduction reaction of 4-nitrothiophenol to the 4-aminothiophenol.
1. Introduction
Anisotropic metal nanoparticles have attracted extensive attention due to their fascinating physical and chemical properties for their potential application in electronics,1,2 catalysis,3–6 photo thermal therapy7–10 and surface enhanced Raman scattering (SERS).11,12 Experiments and theoretical studies show that morphology and size together determine the physical and chemical properties of metal nanoparticles.13 In particular, the ability to enhance the local electromagnetic (EM) field and adjust the localized surface plasmon resonance (LSPR) peak across a wide spectral range is highly dependent on their shape, size, surroundings and structure.14 Therefore, over the past few decades, a large number of studies have focused on precious metal nanoparticles with controllable morphology and size. To date, many methods, including photochemical,15–17 wet chemical,18–21 electrochemical22,23 and template method24 have been developed for the synthesis well-defined metal nanoparticles. As a result, a large number of precious metal nanoparticles with regular morphology and size have been prepared, such as rods, triangles, cages, stars and yolk-like.25–28Among different types of metal nanostructures, hollow noble metal nanocrystals and three-dimensional (3D) flower-like noble metal architectures with large surface-to-volume ratio and different surface roughness have attracted extensive attention, since they can significantly affect the surface-sensitive applications, such as surface-enhanced Raman scattering (SERS) and catalysis. For hollow noble metal nanostructure, due to their intrinsic features, which including high surface area-to-volume ratios and high densities of catalytic sites make it an excellent catalyst.29–33 Based on recent studies, various hollow metal nanostructures have been prepared. Such as, by using a silver nanorod template Sieb et al. prepared hollow porous gold nanorod through electrochemical deposition in AAO templates.34 Aherne et al. reported the synthesis of triangular Ag@Au nanostructures through a galvanic replacement.35 In addition, 3D flower-like noble metal nanostructure, including nanostars,36 nanoflowers,37 and nanourchins,38 abundant in corners and edges, can provide a large enhancement of the local EM field and adjust the LSPR peak over a broad spectrum,39,40 make it an excellent candidate for surface sensitive applications, especially for SERS.41 For example, up to now, there have been many reports on the successful preparation 3D hierarchical noble metal nanostructures.42–47 For example, Nordlander and co-workers found that the core of the star-shaped gold nanoparticles acts as an antenna for the nanotip, which could enhancing the excitation cross section and the local electromagnetic fields of the tip plasmons.42 By galvanic replacement, Shen et al. prepared the gold@silvergold alloy nanoflowers for the efficient inhibition of bacteria.43 In contrast, by using the seed mediate synthesis method, gold nanourchin,44 and gold nanostar45 were fabricated. However, the above mentioned methods mainly use complex templates/seeds and tedious multi-step. Meanwhile, the synthesised noble metal nanoflowers are mainly specialized metal nanoparticles with multi-level branched tips or smooth petals. To the best of our knowledge, until now, there are few reports on the preparation of flower-like hollow structures. The hollow nanostructure with 3D hierarchical flower shell combines the advantages of hollow nanostructure and hierarchical nanostructure, which possess high SERS activity and good catalytic activity simultaneously. With this in mind, we report herein a simple one-pot synthesis method for the preparation of bifunctional flower like hollow gold nanoparticles.
2. Materials and methods
2.1. Materials
All reagents and solvents were purchased from commercial sources and used as received without further purification. Chemicals used in this study included HAuCl4·3H2O (Mw = 393.83, ≥99.9% trace metals basis), ascorbic acid (AA, AR, >99.0%), polyvinylpyrrolidone (PVP), 4-nitrothiophenol (4-NTP, 80%), 4-aminothiophenol (4-ATP, ≥98% GC), nitric acid (HNO3, AR) hydrochloric acid (HCl, AR) was purchased from Aladdin. Silver nitrate (AgNO3, A.R. 99.8%, Sinopharm Group Chemical Reagent Co., Ltd., China), ethylene glycol (EG, ≥99%) was purchased from Aladdin. The solutions were prepared from super pure water (18 MΩ cm) purified through a Milli-Q Lab system (Nihon Millipore Ltd.).2.2. Instruments
The morphologies and structures of flower like hollow gold nanoparticles were studied using scanning electron microscopy (SEM, 3.0 kV, SU70, Hitachi, Japan), transmission electron microscopy (TEM, Tecnai G2 F20 S-TWIN), high-resolution TEM (HRTEM), and TEM-EDS mapping, X-ray diffraction (XRD, Cu Kα1 radiation, Rigaku/Ultima IV, Japan). Absorption spectra were recorded on a Cary 60 Scan UV-vis spectrophotometer. The surface-enhanced Raman spectroscopy was performed using a confocal Raman microscope (Horiba HR Evolution 800) with laser excitation at 633 nm.2.3. Synthesis of hydrangea Au hollow nanoparticles
For a typical synthesis of uniform hollow hydrangea Au crystals, 40 mg PVP was added to 50 mL flask containing 20 mL water and stirred for 2 minutes at room temperature to obtain a homogeneous solution. First use the oscillator to oscillate 1 min, then ultrasonic 1 min to make the solution evenly. Subsequently, 150 μL of 0.5 M HAuCl4·3H2O and 10 μL of 0.5 M AgNO3 were added and kept under vigorous stirring for 15 min. Then 3.0 mL of 0.2 M, aqueous Ascorbic acid was added and the mixture was placed in an oil bath at 95 °C with vigorous stirring for 60 min. While maintaining other reaction conditions, when the content of HAuCl4·3H2O was 60 μL, 80 μL, 100 μL, 150 μL, 200 μL and 250 μL, the obtained Au nanoparticles were 170 nm, 240 nm, 300 nm, 410 nm, 430 nm, 550 nm in diameter, respectively. All glassware used in the experiments were cleaned in a bath of freshly prepared aqua regia (HCl![[thin space (1/6-em)]](https://www.rsc.org/images/entities/char_2009.gif) :
:![[thin space (1/6-em)]](https://www.rsc.org/images/entities/char_2009.gif) HNO3 = 3
HNO3 = 3![[thin space (1/6-em)]](https://www.rsc.org/images/entities/char_2009.gif) :
:![[thin space (1/6-em)]](https://www.rsc.org/images/entities/char_2009.gif) 1) and rinsed thoroughly in deionized water and ethanol. When the reaction is stopped the resulting product was first centrifuged at 10
1) and rinsed thoroughly in deionized water and ethanol. When the reaction is stopped the resulting product was first centrifuged at 10![[thin space (1/6-em)]](https://www.rsc.org/images/entities/char_2009.gif) 000 rpm for 10 min to remove the supernatant and the products were washed twice with ethanol and water, respectively. The prepared gold nanoparticles are dispersed in ethanol solution for use.
000 rpm for 10 min to remove the supernatant and the products were washed twice with ethanol and water, respectively. The prepared gold nanoparticles are dispersed in ethanol solution for use.
2.4. In situ detection of catalytic reactions
We first tested the UV-vis absorption spectra of 4-NTP and 4-ATP standards. 1.9 mL of 0.1 M 4-NTP and 1.9 mL of 0.1 M 4-ATP were mixed with 1 mL of 0.1 M NaBH4 solution to test the UV-vis absorption peaks, respectively. The 4-NTP reaction process was then monitored using UV-vis absorption spectroscopy. Pipette 1.9 mL of 0.1 M 4-NTP into the measuring cell. And 10 mg of 300 nm gold crystals were weighed and added to 1.0 mL of water to uniformly disperse. Then, 1 mL of 0.1 M NaBH4 solution and 100 μL of the listed gold crystal solution were sequentially added and mixed uniformly. UV-vis in situ monitoring was then performed and tested at different time points. In addition, we used SERS to monitor the 4-NTP reaction process. The Raman spectrometer was calibrated using a silicon wafer at 520 cm−1. And the above reaction solution was subjected to a surface-enhanced Raman test by taking 2 μL of the solution after different reaction times. The laser beam was focused through a 50× objective, and the diameter of the laser spot area is about 1 μm.3. Results and discussion
3.1. Formation process of Au nanoparticles
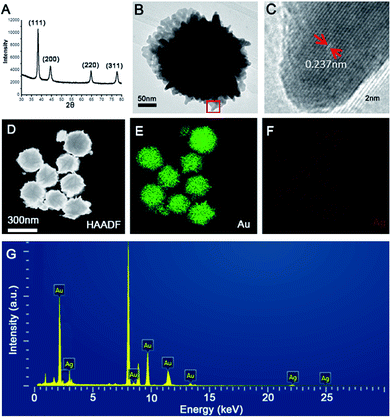
The formation process of hollow Au hydrangea is shown in Fig. 1. Firstly, add HAuCl4 and AgNO3 to PVP solution results in a colour change from yellowish to whitish. And the corresponding SEM image indicates the formation of AgCl nanoparticles with cubic morphology of an approximate average size of 150 nm (Fig. 1A). This result is consistent with previous reports.48 In the above solution, HAuCl4 provides Cl−, and AgNO3 provides Ag+ to form AgCl crystals. When 3.0 mL 0.2 M AA was added into the above reaction mixture, the colour of the solution immediately turns to colourless and then to dark green. At this stage, AuCl4− is reduced on the surface of AgCl to form AgCl@Au. Then, with further reaction, the AgCl@Au cube transforms to spherical Au nanoparticles with island rough surface (Fig. 1B). And we did not observe the formation of individual gold nanoparticles. This is because gold growth on the surface of the AgCl cube is more favourable than the nucleation alone.49 While increasing the reaction time and leave other conditions unchanged, a small amount of rough sheet structure formed on the surface of the spherical gold nanoparticles (Fig. 1C). As the reaction proceeds, the highly rough sheet structure gradually increases and eventually forms a 3D Au hydrangea (Fig. 1D). It is worth to note that there are many small Au particles grow out of the petals which make it high catalytic activities. The prepared gold nanoflowers will be treated with NH4OH solution to remove the AgCl template, and finally form hollow flower gold nanoparticles. This result is consistent with previous reports.48 Moreover, the size of the hollow gold nanoflower can be systematically controlled by varying the concentration of HAuCl4. As shown in Fig. 2A–F, when the volume of HAuCl4 is 60 μL, 80 μL, 100 μL, 150 μL, 200 μL and 250 μL while maintaining other reaction parameters, the diameter of the obtained flower-like Au crystal are: 170 nm (Fig. 2A), 240 nm (Fig. 2B), 300 nm (Fig. 2C), 410 nm (Fig. 2D), 430 nm (Fig. 2E), 550 nm (Fig. 2F), respectively. The synthesized Au hydrangea crystalline structure and the phase composition were characterized by X-ray diffraction (XRD), HRTEM and EDS. The XRD pattern of the flower Au crystals in Fig. 3A shows the characteristic diffraction peaks of (111), (200), (220) and (311), which are index to the face-centred-cubic (fcc) structure of Au. There are no obvious impurity was observed, which indicates that the flower Au crystals are well crystallized and the sample is pure. Furthermore, as we can see the intensity of the (111) peak is much higher than other peaks, indicating that the hydrangea flower-like Au crystals possess plenty of (111) facets. Fig. 3B shows a typical TEM image of hydrangea flower-like Au crystals. The image shows the contrast of the different regions of the gold crystal indicating the flower-like structure of the crystal. HRTEM image (Fig. 3C), which was recorded from the circled area in Fig. 3B, was used to further observe the structure of the synthesised gold crystals. As shown in Fig. 3C, the lattice spacing is 0.237 nm, which indicating the sheet-like petals of Au nanostructure are mainly composed of {111} planes. And the gold crystals were further identified by high-angle annular dark field scanning transmission electron microscopy (HAADF-STEM) and energy dispersive X-ray spectroscopy (EDS) elemental mapping (Fig. 3D). The HADDF-STEM image of gold crystals display a gray zone in the centre enclosed by a much brighter zone on the edge, which can be attributed to the hollow core and the Au shell, respectively. In some SEM images, we also observed the hollow structure of the synthesised gold nanoflower (Fig. S1†). Furthermore, from the HRTEM image of the entire gold nanoparticle (Fig. S2†) we can see the scattered gray areas, which also indicates that the synthesised gold nanoparticles are hollow. The EDS mapping (Fig. 3E and F) clearly shows that Au is distributed over the entire surface and only a small amount of silver is present to stabilize the surface.50 EDS elemental spectra (Fig. 3G) further confirms that the gold flower is predominantly gold (98.5 wt%) with residual silver (1.5 wt%).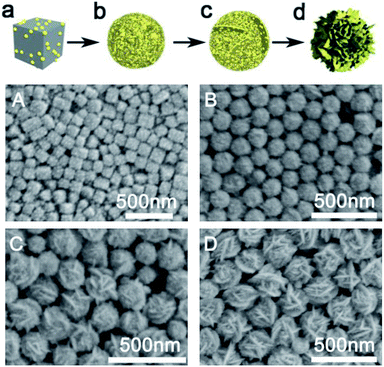 | ||
| Fig. 1 (a–d) A schematic diagram of hollow gold flower formation process. (A–D) SEM images corresponding to (a–d). | ||
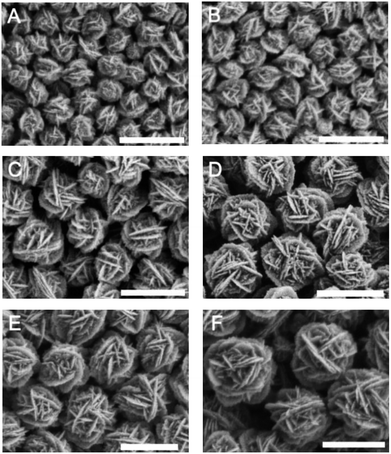 | ||
| Fig. 2 SEM images of various sized hollow gold nanoflower: (A) 170 nm, (B) 240 nm, (C) 300 nm, (D) 410 nm, (E) 430 nm, (F) 550 nm in diameter. Scale bar, 500 nm. | ||
3.2. Monitoring of catalytic reactions by UV-vis and SERS
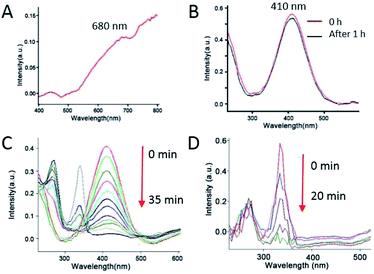
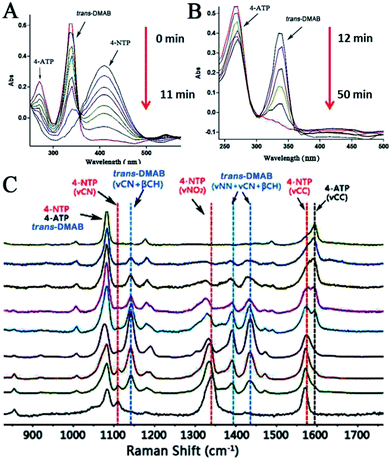
In order to evaluate the catalytic properties of the prepared metal nanocrystals, we applied a model reaction that reduced 4-nitrothiophenol (4-NTP) to 4-aminothiophenol (4-ATP) in the presence of NaBH4 solution. As shown in Fig. 4A, the obtained flower-like Au nanoparticles show a weak surface plasmon resonance (SPR) peak centred at ∼680 nm. First, we investigated the change of 4-NTP under the action of NaBH4 when Au catalyst is not added. As shown in Fig. 4B, there was no obvious change in the absorption peak around 410 nm, indicating that 4-NTP did not react in the absence of flower-like Au nanoparticles. Then, we measured the UV-vis absorption peak of 4-NTP and 4-ATP in the presence of NaBH4, which are located at 410 nm and 270 nm, respectively (Fig. S3 and S4†). The initial concentrations of 4-NTP and NaBH4 were 0.1 mM and 0.1 M, respectively, so that NaBH4 was in large excess. And 0.1 mL 10 mg mL−1 flower-like Au crystals (300 nm) were used. From Fig. 5A, we can see that the characteristic peak of 4-nitrothiophenolate at 410 nm decreases with the reaction time increasing, and nearly disappears after 11 minutes. At the same time, two new peaks, 340 and 270, appeared. Interestingly, when the peak of 410 is reduced, the 340 and 270 peaks increase simultaneously. Moreover, the peak of 340 increases faster than the peak of 270. As the reaction progressed to 12 min, the 410 peak disappeared, leaving only two peaks of 340 and 270 (Fig. 5B). As the reaction time continues increasing, the 340 peak decreases, while the 270 peak increases. At 50 min, the 340 peak disappeared, leaving only 270 peaks. As we know, the new peak around 270 nm assigned to the product, 4-ATP (Fig. S4†). Combined with the subsequent Raman test, we can infer that the 340 peak corresponds to the intermediate product trans-4,4′-dimercaptoazobenzene (trans-DMAB). Furthermore, the UV-vis spectra analysis of trans-DMAB was calculated by TD B3LYP/6-311+G (d, p) basis set. And the optimized structure of trans-DMAB was calculated by B3LYP/6-311+G (d, p). The calculation results show that the UV-vis absorption peak of trans-DMAB is located at 340 nm (Fig. S5†), which is consistent with the experimental results. All the calculations include geometry optimization and UV-vis spectrum were performed by Gauss View program and Gaussian 09W program package.57 Therefore, we can deduce that 4-NTP was first transformed into DMAB and then into 4-ATP. In addition, we investigated the effect of the amount of Au catalyst on the catalytic reaction. Fig. 4C and D are the UV-vis spectroscopy of the reaction as a function of reaction time when the amounts of catalyst added were 0.7 mg and 3.0 mg, respectively. We can see that when the amount of catalyst is 0.7 mg, the reaction of 4-NTP complete conversion DMAB takes 35 min (Fig. 4C). However, when the amount of the catalyst is increased to 3.0 mg, the process is completed within 1 min, so that we can't monitor the 4-NTP (Fig. 4D). When the amount of Au catalyst added was 1.0 mg, 1.5 mg, 2.0 mg and 3.0 mg while maintaining other reaction conditions, the total reaction time for 4-NTP to completely convert to 4-ATP was 50 min, 43 min, 32 min and 20 min, respectively (see details in Fig. S6–S8†). Thus we can conclude that the reaction rate will increase as the amount of catalyst added increases. Moreover, hydrangea flower-like Au hollow nanoparticles were employed as a dual catalyst and an active SERS substrate. In the SERS measurements, we used the flower-like Au nanoparticles with the size of 300 nm. Many studies have shown that the adsorption of 4-NTP molecules on bare SERS active substrates will be converted by light to dimerization of the azo compound, p,p′-dimercaptoazobenzene (DMAB) under high power laser irradiation.54–56 To avoid the side reaction, we chose a low laser power of 0.2 mW for the SERS measurements. In addition, in order to avoid plasma-driven photocatalytic side reactions as much as possible, during the Raman test interval, we removed the reaction cell to avoid long-term laser irradiation. The results of time-resolved SERS spectra indicated that the process of NaBH4 reducing 4-NTP to 4-ATP under Au catalysis included two consecutive steps. The first step involves that the reduction of 4-NTP to trans-DMAB. Next the trans-DMAB is transformed to 4-ATP. Fig. 5C shows the SERS spectra of 4-NTP at different time intervals after addition of the Au catalyst and the reducing agent NaBH4. Previous studies have shown that the characteristic bands of 4-NTP at 1572, 1336, and 1108 cm−1, assigned to the C–C stretching modes (νCC), NO2 symmetric stretching (νNO2), and C–N (νCN) bending, respectively.51,52 At t = 0 min, the SERS spectrum shows three characteristic vibrational bands of 4-NTP. At t = 4 min, the νNO2 of 4-NTP was blue shifted from 1336 to 1330 cm−1, together with a decrease in peak intensity. At the same time, the intensities of νCC and νCN decreased without any change of their peak positions. Furthermore, three new bands appeared, 1142, 1388, and 1429 cm−1 which can be assigned to βCH + νCN, νNN + νCN, and νNN + βCH of trans-DMAB, respectively.53 As the reaction progressed to 8 min and then 10 min, we noticed that the three bands of trans-DMAB continuously increased in intensity, together with the three bands of 4-NTP gradually decreased in intensity. At t = 11 min, a new band, 1595 cm−1, appeared which can be assigned to νCC of 4-ATP meanwhile the 1108 cm−1 band almost disappeared. As the reaction time continues increasing, the band of 4-ATP (at 1595 cm−1) was continuously increase in intensity, together with all the other peaks were gradually decrease. At t = 50 min, the peaks of 4-NTP and trans-DMAB are all disappeared. It is worth noting that two relatively stable peaks, 1083 and 1179 cm−1, in all the SERS spectra during the process of the reaction can be assigned to 4-NTP, trans-DMAB, or 4-ATP. The results of the SERS monitoring reaction process are consistent with the UV-vis results, both of which demonstrate that 4-NTP is first converted to trans-DMAB and then to 4-ATP.4. Conclusions
In summary, we have demonstrated the synthesis of hydrangea flower-like hollow Au crystals with highly roughened sheet-like petals by a one-pot synthesis method. By simply changing the volume of the HAuCl4 solution, we achieved a regulation of Au nanoparticle size from 170–550 nm. And the growth mechanism of flower-like Au hetero-nanostructure was explored. The prepared gold crystal has the advantages of both a 3D structure and a hollow structure, which can be used as a dual catalyst with SERS activity for in situ monitoring reduction reaction of 4-NTP to 4-ATP. We have achieved the in situ monitoring the reaction process both by UV-vis spectroscopy and SERS. This work not only provides an approach for preparing hollow nanostructure with flower-like shell, but also provides proposed hierarchical hollow gold nanoflower for potential applications in SERS-based sensors and catalyst.Conflicts of interest
There are no conflicts to declare.Acknowledgements
This work was supported by the Science Fund for Creative Research Groups of the National Natural Science Foundation of China (Grant No. 61621002) and the National Key Research and Development Program of China (2016YFC0800900, 2016YFC0800905 and 2016YFC0800905-Z03) and the Research Project of the State Key Laboratory of Industrial Control Technology, Zhejiang University, China (grant numbers ICT1806).Notes and references
- J. H. Choi, H. Wang, S. J. Oh, T. Paik, P. Sung, J. Sung, X. Ye, T. Zhao, B. T. Diroll, C. B. Murray and C. R. Kagan, Science, 2016, 352, 205–208 CrossRef CAS PubMed.
- Y. Huang, L. Wu, X. Chen, P. Bai and D.-H. Kim, Chem. Mater., 2013, 25, 2470–2475 CrossRef CAS.
- N. Yang, Z. Zhang, B. Chen, Y. Huang, J. Chen, Z. Lai, Y. Chen, M. Sindoro, A. L. Wang, H. Cheng, Z. Xian, X. Liu, B. Li, Y. Zong, L. Gu and H. Zhang, Adv. Mater., 2017, 29, 1700769 CrossRef PubMed.
- H. Duan, N. Yan, R. Yu, C. R. Chang, G. Zhou, H. S. Hu, H. Rong, Z. Niu, J. Mao and H. Asakura, Nat. Commun., 2014, 5, 3093 CrossRef PubMed.
- L. Bu, N. Zhang, S. Guo, X. Zhang, J. Li, J. Yao, T. Wu, G. Lu, J. Y. Ma and D. Su, Science, 2016, 354, 1410–1414 CrossRef CAS PubMed.
- L. Zhao, C. Xu, H. Su, J. Liang, S. Lin, L. Gu, X. Wang, M. Chen and N. Zheng, Adv. Sci., 2015, 2, 1500100 CrossRef PubMed.
- X. Huang, S. Tang, J. Yang, Y. Tan and N. Zheng, J. Am. Chem. Soc., 2011, 133, 15946–15949 CrossRef CAS PubMed.
- Y. J. Wang, N. Zhao, B. Fang, H. Li, X. T. Bi and H. Wang, Chem. Rev., 2015, 115, 3433–3467 CrossRef CAS PubMed.
- Z. Niu, N. Becknell, Y. Yu, D. Kim, C. Chen, N. Kornienko, G. A. Somorjai and P. Yang, Nat. Mater., 2016, 15, 1188–1194 CrossRef CAS PubMed.
- S. Tang, M. Chen and N. Zheng, Small, 2014, 10, 3139–3144 CrossRef CAS PubMed.
- S. Viarbitskaya, A. Teulle, R. Marty, J. Sharma, C. Girard, A. Arbouet and E. Dujardin, Nat. Mater., 2013, 12, 426–432 CrossRef CAS PubMed.
- X. Huang, S. Tang, B. Liu, B. Ren and N. Zheng, Adv. Mater., 2011, 23, 3420–3425 CrossRef CAS PubMed.
- M. C. Daniel and D. Astruc, Chem. Rev., 2004, 104, 293–346 CrossRef CAS PubMed.
- T. K. Sau, A. L. Rogach, F. Jackel, T. A. Klar and J. Feldmann, Adv. Mater., 2010, 22, 1805–1825 CrossRef CAS PubMed.
- F. Y. Kong, W. W. Li, J. Y. Wang and W. Wang, Biosens. Bioelectron., 2015, 69, 206–212 CrossRef CAS PubMed.
- Y. Xiong, Chem. Commun., 2011, 47, 1580 RSC.
- G. G. Rubio, P. D. Núñez, A. Rivera, A. Prada, G. Tardajos, J. G. Izquierdo, L. Bañares, P. Llombart, L. G. Macdowell, M. A. Palafox, L. M. Liz-Marzán, O. P. Rodríguez and A. G. Martínez, Science, 2017, 358, 640–644 CrossRef PubMed.
- Y. Z. Qin, W. F. Pan, D. D. Yu, Y. X. Lu, W. H. Wu and J. G. Zhou, Chem. Commun., 2018, 54, 3411–3414 RSC.
- A. Klinkova, E. M. Larin, E. Prince, E. H. Sargent and E. Kumacheva, Chem. Mater., 2016, 28, 3196–3202 CrossRef CAS.
- Y. Xia, K. D. Gilroy, H. C. Peng and X. Xia, Angew. Chem., Int. Ed., 2017, 56, 60–95 CrossRef CAS PubMed.
- W. X. Niu, Y. K. Duan, Z. K. Qing, H. J. Huang and X. M. Lu, J. Am. Chem. Soc., 2017, 139, 5817–5826 CrossRef CAS PubMed.
- Y. Y. Li, Y. X. Jiang, M. H. Chen, H. G. Liao, R. Huang, Z. Y. Zhou, N. Tian, S. P. Chen and S. G. Sun, Chem. Commun., 2012, 48, 9531–9533 RSC.
- J. H. Du, T. Sheng, C. Xiao, N. Tian, J. Xiao, A. Y. Xie, S. Liu, Z. Y. Zhou and S. G. Sun, Chem. Commun., 2017, 53, 3236 RSC.
- S. J. Hurst, E. K. Payne, L. Qin and C. A. Mirkin, Angew. Chem., 2006, 45, 2672–2692 CrossRef CAS PubMed.
- Y. Sun, B. T. Mayers and Y. Xia, Nano Lett., 2002, 2, 481–485 CrossRef CAS.
- M. Knez, R. Scholz, K. Nielsch, E. Pippel, D. Hesse, M. Zacharias and U. Go sele, Nat. Mater., 2006, 5, 627 CrossRef PubMed.
- J. Zhong, C. Cao, H. Liu, Y. Ding and J. Yang, Ind. Eng. Chem. Res., 2013, 52, 1303–1308 CrossRef CAS.
- A. L. Calderon, D. Bahena and M. J. Yacaman, Langmuir, 2016, 32, 7572–7581 CrossRef PubMed.
- M. Zhao, X. Wang, X. Yang, K. D. Gilroy, D. Qin and Y. Xia, Adv. Mater., 2018, 1801956 CrossRef PubMed.
- L. Shen, L. Yu, H. B. Wu, X.-Y. Yu, X. Zhang and X. W. Lou, Nat. Commun., 2015, 6, 6694 CrossRef CAS PubMed.
- W. Zhu, Z. Chen, Y. Pan, R. Dai, Y. Wu, Z. Zhuang, D. Wang, Q. Peng, C. Chen and Y. D. Li, Adv. Mater., 2018, 1800426 CrossRef PubMed.
- M. Q. Zhao, X. Q. Xie, C. E. Ren, T. Makaryan, B. Anasori, G. X. Wang and Y. Gogotsi, Adv. Mater., 2017, 29, 1702410 CrossRef PubMed.
- B. Li and H. C. Zeng, Adv. Mater., 2018, 1801104 CrossRef PubMed.
- N. R. Sieb, N. C. Wu, E. Majidi, R. Kukreja, N. R. Branda and B. D. Gates, ACS Nano, 2009, 3, 1365 CrossRef CAS PubMed.
- D. Aherne, M. Gara, J. M. Kelly and Y. K. Gun’ko, Adv. Funct. Mater., 2010, 20, 1329 CrossRef CAS.
- A. G. Martınez, S. Barbosa, I. P. Santos and L. M. L. Marzan, Curr. Opin. Colloid Interface Sci., 2011, 16, 118–127 CrossRef.
- C. Y. Song, N. Zhou, B. Y. Yang, Y. J. Yang and L. H. Wang, Nanoscale, 2015, 7, 17004–17011 RSC.
- A. J. Blanch, M. Doblinger and J. R. Fernandez, Small, 2015, 11, 4550–4559 CrossRef CAS PubMed.
- Z. Liu, B. Yang, C. Peng, C. Cao, C. Zhang, H. You, Q. Xiong, Z. Li and J. Fang, Adv. Mater., 2014, 26, 2431–2439 CrossRef CAS PubMed.
- N. T. Tran, A. Li, P. Chen, Y. Wang, S. Li and B. Liedberg, J. Mater. Chem. C, 2017, 5, 4884–4891 RSC.
- P. R. Sajanlal and T. Pradeep, Nano Res., 2009, 2, 306–320 CrossRef CAS.
- F. Hao, C. L. Nehl, J. H. Hafner and P. Nordlander, Nano Lett., 2007, 7, 729 CrossRef CAS PubMed.
- W. J. Yan, L. P. Yang, H. X. Wang, J. B. Zhang and W. B. Shen, Nanoscale, 2018, 10, 15661–15668 RSC.
- J. Li, J. Wu, X. Zhang, Y. Liu, D. Zhou, H. Sun, H. Zhang and B. Yang, J. Phys. Chem. C, 2011, 115, 3630–3637 CrossRef CAS.
- B. L. S. Gaytan, Z. Qian, S. P. Hastings, M. L. Reca, Z. Fakhraai and S. J. Park, J. Phys. Chem. C, 2013, 117, 8916–8923 CrossRef.
- J. Fang, S. Du, S. Lebedkin, Z. Li, R. Kruk, M. Kappes and H. Hahn, Nano Lett., 2010, 10, 5006–5013 CrossRef CAS PubMed.
- Y. H. Chang, C. Liu, S. I. Rouvimov, T. Luocand and S. P. Feng, Chem. Commun., 2017, 53, 6752 RSC.
- S. Pedireddy, H. K. Lee, W. W. Tjiu, I. Y. Phang, H. R. Tan, S. Q. Chua, C. Troadec and X. Y. Ling, Nat. Commun., 2014, 5, 4947–5947 CrossRef CAS PubMed.
- W. M. Schuette and W. E. Buhro, ACS Nano, 2013, 7, 3844–3853 CrossRef CAS PubMed.
- X. Y. Liu, A. Wang, T. Zhang and C. Y. Mou, Nano Today, 2013, 8, 403–416 CrossRef CAS.
- J. Zhang, S. A. Winget, Y. Wu, D. Su, X. Sun, Z. Xie and D. Qin, ACS Nano, 2016, 10, 2607–2616 CrossRef CAS PubMed.
- Q. F. Zhang, D. A. Blom and H. Wang, Chem. Mater., 2014, 26, 5131–5142 CrossRef CAS.
- Y. F. Huang, D. Y. Wu, H. P. Zhu, L. B. Zhao, G. K. Liu, B. Ren and Z. Q. Tian, Phys. Chem. Chem. Phys., 2012, 14, 8485–8497 RSC.
- L. L. Kang, P. Xu, B. Zhang, H. H. Tsai, X. J. Han and H. Wang, Chem. Commun., 2013, 49, 3389–3391 RSC.
- Y. F. Huang, H. P. Zhu, G. K. Liu, D. Y. Wu, B. Ren and Z. Q. Tian, J. Am. Chem. Soc., 2010, 132, 9244–9246 CrossRef CAS PubMed.
- Q. Cui, G. Shen, X. Yan, L. Li, H. Möhwald and M. Bargheer, ACS Appl. Mater. Interfaces, 2014, 6, 17075–17081 CrossRef CAS PubMed.
- M. J. Frisch, G. W. Trucks, H. B. Schlegel, G. E. Scuseria, M. A. Robb, J. R. Cheeseman, G. Scalmani, V. Barone, B. Mennucci, G. A. Petersson, H. Nakatsuji, M. Caricato, X. Li, H. P. Hratchian, A. F. Izmaylov, J. Bloino, G. Zheng, J. L. Sonnenberg, M. Hada, M. Ehara, K. Toyota, R. Fukuda, J. Hasegawa, M. Ishida, T. Nakajima, Y. Honda, O. Kitao, H. Nakai, T. Vreven, J. A. Montgomery Jr, J. E. Peralta, F. Ogliaro, M. Bearpark, J. J. Heyd, E. Brothers, K. N. Kudin, V. N. Staroverov, T. Keith, R. Kobayashi, J. Normand, K. Raghavachari, A. Rendell, J. C. Burant, S. S. Iyengar, J. Tomasi, M. Cossi, N. Rega, J. M. Millam, M. Klene, J. E. Knox, J. B. Cross, V. Bakken, C. Adamo, J. Jaramillo, R. Gomperts, R. E. Stratmann, O. Yazyev, A. J. Austin, R. Cammi, C. Pomelli, J. W. Ochterski, R. L. Martin, K. Morokuma, V. G. Zakrzewski, G. A. Voth, P. Salvador, J. J. Dannenberg, S. Dapprich, A. D. Daniels, O. Farkas, J. B. Foresman, J. V. Ortiz, J. Cioslowski and D. J. Fox, Gaussian 09, Revision E.01, Gaussian, Inc., Wallingford CT, 2013 Search PubMed.
Footnote |
| † Electronic supplementary information (ESI) available. See DOI: 10.1039/c9ra00733d |
| This journal is © The Royal Society of Chemistry 2019 |

