 Open Access Article
Ethylammonium as an alternative cation for efficient perovskite solar cells from first-principles calculations
Diwen Liu ac,
Qiaohong Li
 *a and
Kechen Wu*ab
aState Key Laboratory of Structural Chemistry, Fujian Institute of Research on the Structure of Matter, Chinese Academy of Sciences, Fuzhou 350002, P. R. China. E-mail: lqh2382@fjirsm.ac.cn; wkc@fjirsm.ac.cn; Fax: +86 591 63173138
bCenter for Advanced Marine Materials and Smart Sensors, Minjiang University, Fuzhou 350108, P. R. China
cUniversity of Chinese Academy of Sciences, Beijing 100049, P. R. China
First published on 6th March 2019
Abstract
Mixed-cation lead halide perovskites have emerged as a new class of promising photovoltaic materials for perovskite solar cells. Formamidinium (FA), methylammonium (MA), and Cs cations are widely studied in the field of mixed-cation hybrid halide perovskites. In this work, we have investigated ethylammonium (CH3CH2NH3, EA) as an alternative cation to explore the stabilities and electronic properties of mixed MA1−xEAxPbI3 perovskites. The results indicate that replacing MA with EA is a more effective way to improve the stabilities of the mixed MA1−xEAxPbI3 perovskites except for MA0.75EA0.25PbI3. The band gap of MA1-xEAxPbI3 slightly increases with x from 0.25 to 1.00, which is quite different from the MA–FA mixed-cation perovskites. The results indicate that the c axis distortion of the Pb–I–Pb bond angles can play a greater role in tuning the band gap. Moreover, the mixed MA1−xEAxPbI3 perovskites show comparable absorption abilities in the visible light region to the pure MAPbI3 structure. We hope that our study will be greatly helpful for further experiments to find more efficient perovskite materials in the future.
1. Introduction
Hybrid organic–inorganic lead halide perovskites with outstanding photovoltaic performance have been identified as desirable light absorption materials for perovskite solar cells.1–3 The power conversion efficiency of perovskite solar cells has been improved from an intial 3.8%4 to 23.7%.5 In a typical ABX3 perovskite structure, A is a monovalent cation such as methylammonium (CH3NH3+, MA), formamidinium (CH(NH2)2+, FA), and Cs+. B is a metal ion (usually Pb2+, Sn2+, or Ge2+) and X is a halide anion (usually I−, Br−, or Cl−). Recently, composition engineering on ABX3 perovskites has been carried out on the cation and halide. This has proved to be a powerful approach to tune the stability and band gap.6–11 The most popular cations for composition engineering are Cs, MA, and FA.12–16 These works have demonstrated that mixed cations have advantages in improving the stabilities and optoelectronic properties of hybrid perovskites. Therefore, there is a strong desire to explore new stable perovskites with suitable photovoltaic performances.In general, the mixed-cation composition engineering can be evaluated by the Goldschmidt tolerance factor (t), which is defined as follows:17
 | (1) |
The radius of the ethylammonium cation (CH3CH2NH3, EA) is about 2.3 Å,19 which is greater than that of MA (1.8 Å) but smaller than that of FA (2.6 Å).20 Based on the eqn (1), the tolerance factor of MA1−xEAxPbI3 ranges from 0.83 to 0.94, as shown in Fig. 1. The tolerance factors of the MA1−xEAxPbI3 perovskites are consistent with the relevant conclusions.18 This indicates that incorporating EA into MAPbI3 is a effective way to form stable mixed-cation MA1−xEAxPbI3 perovskites. However, the EAPbI3 structure was synthesized in 2012.21 Its structure was described as a 2H perovskite type with a larger band gap of 2.2 eV.21,22 The incorporation of EA cations with larger effective radius to improve material stability has been investigated experimentally.19,23,24 A small amount of EA cations (x ≤ 0.3) have been successfully incorporated into MAPbI3 to form the stable mixed MA1−xEAxPbI3 perovskites.25 Recently, a new 3D perovskite with a chemical structure of (1,3-Pr(NH3)2)0.5PbI3 was successfully synthesized based on a larger organic cation of propane-1,3-diammonium (1,3-Pr(NH3)22+).26 The results showed that this new perovskite exhibited a tetragonal structure and enhanced stability.26 These results indicate that EA as a alternative cation can form a stable 3D perovskite structure under proper experimental conditions. In this work, we have investigated the structural stabilities and electronic properties of MA–EA mixed-cation MA1−xEAxPbI3 perovskites, whose electronic properties are substantially different from the MA–FA mixed-cation perovskites.
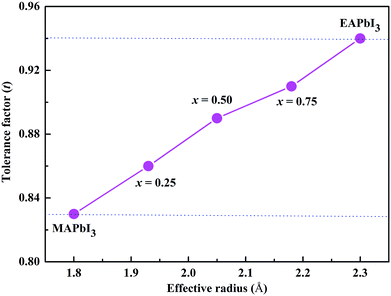 | ||
| Fig. 1 Correlations between the tolerance factor and the structures of the MA1−xEAxPbI3 perovskites. | ||
2. Computational details
All of the first-principles calculations were performed with the Vienna Ab initio Simulation Package (VASP) based on DFT.27 The projector-augmented wave method was used for the electron-ion interactions and the Perdew–Burke–Ernzerhof (PBE)28 generalized gradient approximation (GGA)29 was used to describe the exchange–correlation effect of the electrons. The cut-off energy for the plane wavefunctions was set to 550 eV. A Monkhorst–Pack 6 × 6 × 6 k-point mesh over the first Brillouin zone was used for structural optimization and a denser 8 × 8 × 8 k-point mesh was used for the electronic and optical properties. The total energy was converged to 10−5 eV. The atom coordinates were fully optimized until the residual forces were smaller than 0.01 eV Å−1. It is well known that van der Waals interactions play an important role in hybrid organic–inorganic halide perovskite materials.30,31 Thus, the DFT-D3 functional, which includes dispersion interactions, was used for the structural optimization.32It is well known that the PBE functional always underestimated the band gaps of semiconductors. In the previous DFT calculation, our calculated result shows that the band gap of MAPbI3 is 1.50 eV with PBE functional,33 which is quite close experimental value of 1.55 eV.34 Thus, the PBE functional could give the reasonable band gaps for hybrid lead iodine perovskites. Besides, the calculated optical properties of cation-doped MAPbI3 with PBE functional also can show the right results. Note that DFT-D3 method was adopted to account for van der Waals interactions in all calculations.
To evaluate the stabilities of the pure and mixed perovskites, we calculated the formation energies of the pure and EA-doped MAPbI3 perovskites. The crystal structures of MAI was taken from the ref. 35 The crystal structure of EAI was obtained from monoclinic (C2/m) CH3CH2NH2I36 with full relaxation of the structural parameters. The stable structure of hexagonal PbI2 was used. The energies of PbI2, MAI, and EAI were calculated using the same computational parameters.
3. Results and discussion
3.1 Geometric structures
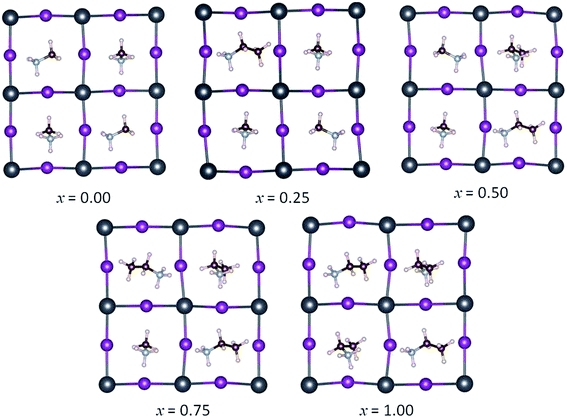
The simulated mixed MA1−xEAxPbI3 perovskites are performed by gradually reducing the percentage of MA from the starting I4cm tetragonal phase. The simulated unit cell contains four MAPbI3 units, so we can simulate three values of the MA–EA ratio, namely 3![[thin space (1/6-em)]](https://www.rsc.org/images/entities/char_2009.gif) :
:![[thin space (1/6-em)]](https://www.rsc.org/images/entities/char_2009.gif) 1 (x = 0.25), 2
1 (x = 0.25), 2![[thin space (1/6-em)]](https://www.rsc.org/images/entities/char_2009.gif) :
:![[thin space (1/6-em)]](https://www.rsc.org/images/entities/char_2009.gif) 2 (x = 0.50), 1
2 (x = 0.50), 1![[thin space (1/6-em)]](https://www.rsc.org/images/entities/char_2009.gif) :
:![[thin space (1/6-em)]](https://www.rsc.org/images/entities/char_2009.gif) 3 (x = 0.75), and the pure phase of x = 0 and 1. For x = 0.25, 0.50, and 0.75, all of the possible substitution sites are considered. The optimized structures of the mixed MA1−xEAxPbI3 perovskites are shown in Fig. 2. For the structures with x = 0.50 and x = 0.75, all the possible substitution sites are approximately equivalent with the energy differences within 0.02 eV. However, the results show that different structures with x = 0.25 have different stabilities, with calculated maximum energy differences within 0.08 eV. The most stable structures of MA1−xEAxPbI3 with x = 0.25, 0.50, and 0.75 are chosen to investigate their structural stabilities, electronic and optical properties.
3 (x = 0.75), and the pure phase of x = 0 and 1. For x = 0.25, 0.50, and 0.75, all of the possible substitution sites are considered. The optimized structures of the mixed MA1−xEAxPbI3 perovskites are shown in Fig. 2. For the structures with x = 0.50 and x = 0.75, all the possible substitution sites are approximately equivalent with the energy differences within 0.02 eV. However, the results show that different structures with x = 0.25 have different stabilities, with calculated maximum energy differences within 0.08 eV. The most stable structures of MA1−xEAxPbI3 with x = 0.25, 0.50, and 0.75 are chosen to investigate their structural stabilities, electronic and optical properties.
The optimized lattice constants of the mixed MA1−xEAxPbI3 perovskites are listed in Table 1. In the tetragonal MAPbI3 structure, the relaxed lattice constants a is 8.76 Å and c is 12.95 Å, which is good agreement with the experimental results.37 The volume slightly increases with increasing EA percentage because of large-size cation doping.
| x | a/Å | b/Å | c/Å | V/Å3 |
|---|---|---|---|---|
| 0.00 | 8.76 | 8.76 | 12.95 | 993.74 |
| 0.25 | 8.92 | 8.70 | 12.97 | 1005.76 |
| 0.50 | 9.05 | 8.67 | 12.98 | 1018.52 |
| 0.75 | 9.00 | 8.81 | 13.02 | 1031.69 |
| 1.00 | 8.97 | 8.94 | 13.04 | 1045.63 |
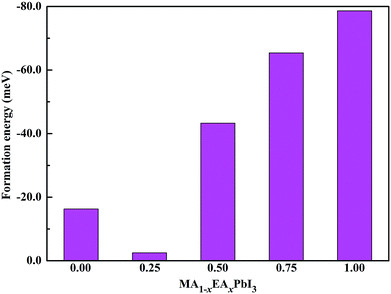
To further evaluate of the stabilities of the pure and mixed perovskites, we calculated the formation energies of the pure and EA-doped perovskites using the following equation:
| ΔH = E(MA1−xEAxPbI3) − [(1 − x)E(MAI) + xE(EAI) + E(PbI2)] | (2) |
3.2 Electronic properties
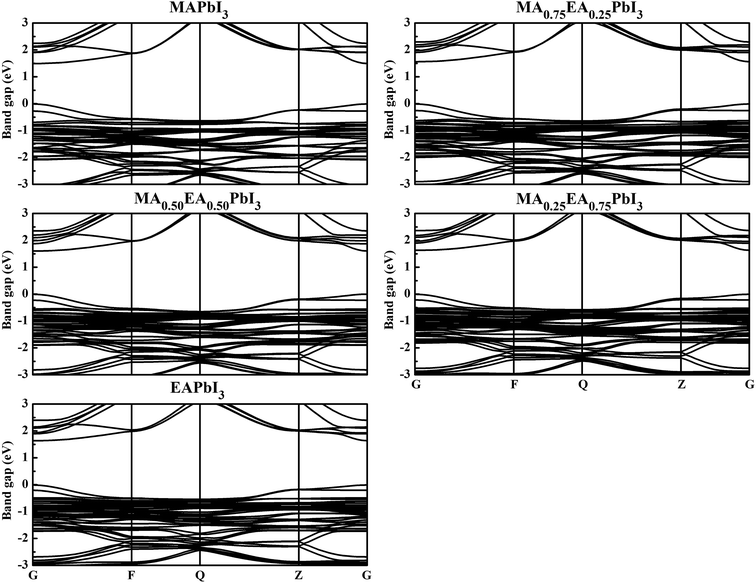
To obtain insight into the effect of EA-doped cation on the electronic properties, we performed band structure calculations for all of the structures. Fig. 4 shows the MA1−xEAxPbI3 band structures with x = 0.00, 0.25, 0.50, 0.75, 1.00. Notably, regardless of the EA percentage, the band structures of perovskites possess direct bandgaps. The band gap of MAPbI3 at the PBE level is 1.50 eV, which agrees well with a previous theoretical result of 1.53 eV (ref. 40) and the experimental value of 1.55 eV.34 The band gaps are 1.57, 1.61, 1.64, 1.65 eV for MA1−xEAxPbI3 with x = 0.25, 0.50, 0.75, and 1.00, respectively. However, the band gap of EAPbI3 is much lower than its experimental result (2.2 eV).21 In fact, an orthorhombic structure in the space group of Pmmn was found for EAPbI3.21 EAPbI3 can form a stable 3D structure according to its radius. It indicates that the radius of EA may be measured. The band gaps of the mixed MA1−xEAxPbI3 perovskites exhibit a slightly increase with EA concentration, which is in good agreement with the experimental results.25 However, the results show that the EA incorporation is significantly different from the FA incorporation although the two cations have similar radii. The (1,3-Pr(NH3)2)0.5PbI3 perovskite also showed a larger band gap (1.62 eV) than that of the MAPbI3 structure.26 These suitable band gaps of the mixed MA1−xEAxPbI3 perovskites, from 1.50 to 1.65 eV, makes them highly promising for optoelectronic applications.To understand the band structure modification, we calculated the projected density of states (PDOS) of the mixed MA1−xEAxPbI3 perovskites. Fig. 5 shows the dominant PDOS near the band edgeds of MA1−xEAxPbI3 with x = 0.00, 0.25, 0.50, 0.75, and 1.00. The results indicate that the valence band maximum (VBM) of MA1−xEAxPbI3 originates mainly from the 5p orbital of I. The contribution of the conduction band minimum (CBM) is mainly composed of the 6p orbital of Pb. The organic cation does not contribute to the band edge states because the states of organic cation are far from the Fermi level.
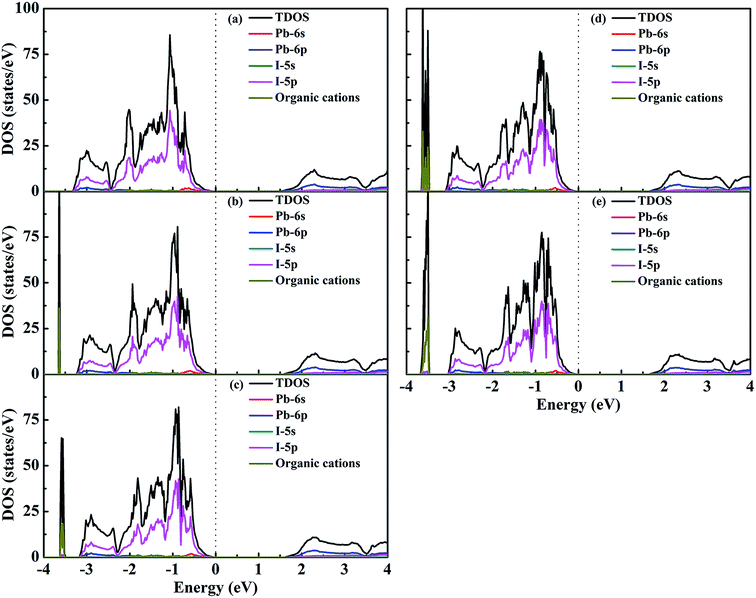 | ||
| Fig. 5 DOS structures of (a) MAPbI3, (b) MA0.75EA0.25PbI3, (c) MA0.50EA0.50PbI3, (d) MA0.25EA0.75PbI3, and (e) EAPbI3. | ||
Previous report has indicated that the electronic structures of hybrid perovskites are affected by structural distortion, and the main factor is the Pb–I–Pb bond angle.41 The Pb–I–Pb bond angles of the MA1−xEAxPbI3 perovskites are shown in Table 2. The larger distortion of the Pb–I–Pb bond angles is from ab plane. The Pb–I–Pb bond angle from ab plane has little change except for EAPbI3. MA0.75EA0.25PbI3 gives rise to an increased band gap of 1.57 eV compared with the pure MAPbI3 structure. This results indicate that the c axis distortion can play a greater role in tuning the band gap. It can be seen that the change of the Pb–I–Pb bond angles is responsible for the difference in band gaps of the MA1−xEAxPbI3 perovskites.
| x | Pb–I–Pb bond angles (°) | Eg (eV) | |
|---|---|---|---|
| In ab plane | Along c axis | ||
| 0.00 | 150.0 | 175.6 | 1.50 |
| 0.25 | 149.9 | 174.2 | 1.57 |
| 0.50 | 149.6 | 171.2 | 1.61 |
| 0.75 | 151.2 | 171.0 | 1.64 |
| 1.00 | 155.8 | 171.5 | 1.65 |
To get more insight into the electronic properties, we next examine the Bader charge analysis for the pure and mixed perovskites. The results of Bader charge analysis are shown in Table 3. Charge transfer of organic cation and I ion gradually decrease with increasing x. However, charge transfer of Pb cation gradually increases with increasing x.
| x | A | Pb | I |
|---|---|---|---|
| 0.00 | +0.727 | +0.941 | −0.556 |
| 0.25 | +0.719 | +0.944 | −0.554 |
| 0.50 | +0.714 | +0.946 | −0.553 |
| 0.75 | +0.710 | +0.947 | −0.552 |
| 1.00 | +0.707 | +0.949 | −0.552 |
3.3 Optical properties
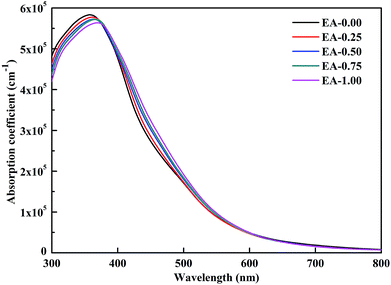
To evaluate the impact of the EA incorporation on the optical performance of MA–EA mixed-cation perovskites, we have calculated the optical absorption coefficient of each structure. The absorption coefficient I(ω) was given as below:42
 | (3) |
4. Conclusions
In summary, first-principles calculations based on DFT were carried out on structural stabilities, electronic and optical properties of the mixed MA1−xEAxPbI3 perovskites. The results indicate that incorporating EA into MAPbI3 to form mixed-cation MA1−xEAxPbI3 perovskite is a potentially effective way to improve its stability. The band gap of MA1−xEAxPbI3 slightly increases with x from 0.25 to 1.00, which is quite different from the MA–FA mixed-cation perovskites. The results indicate that the c axis distortion of the Pb–I–Pb bond angles can play a greater role in tuning the band gap. The mixed MA1−xEAxPbI3 perovskites show the comparable absorption abilities in the visible light region compared with the MAPbI3 structure. Based on the above results, we hope that our study will be helpful for further experiments to find more efficient perovskite solar cells.Conflicts of interest
There are no conflicts to declare.Acknowledgements
This work was supported by the National Natural Science Foundation of China (No. 21673240) and the Foreign Cooperation Project of Fujian Province (No. 2017I0019).References
- P. Docampo and T. Bein, Acc. Chem. Res., 2016, 49, 339–346 CrossRef CAS PubMed.
- Q. Lin, A. Armin, P. L. Burn and P. Meredith, Acc. Chem. Res., 2016, 49, 545–553 CrossRef CAS PubMed.
- H. S. Jung and N.-G. Park, Small, 2015, 11, 10–25 CrossRef CAS PubMed.
- A. Kojima, K. Teshima, Y. Shirai and T. Miyasaka, J. Am. Chem. Soc., 2009, 131, 6050–6051 CrossRef CAS PubMed.
- NREL, Best Research-Cell Efficiences chart, https://www.nrel.gov/pv/assets/pdfs/best-reserch-cell-efficiencies.pdf.
- F. Xu, T. Zhang, G. Li and Y. Zhao, J. Mater. Chem. A, 2017, 5, 11450–11461 RSC.
- T. Matsui, J.-Y. Seo, M. Saliba, S. M. Zakeeruddin and M. Grätzel, Adv. Mater., 2017, 29, 1606258 Search PubMed.
- G. Li, T. Zhang, N. Guo, F. Xu, X. Qian and Y. Zhao, Angew. Chem., Int. Ed., 2016, 55, 13460–13464 CrossRef CAS PubMed.
- Z. Shi, Y. Zhang, C. Cui, B. Li, W. Zhou, Z. Ning and Q. Mi, Adv. Mater., 2017, 29, 1701656 CrossRef PubMed.
- C. Yi, J. Luo, S. Meloni, A. Boziki, N. Ashari-Astani, C. Grätzel, S. M. Zakeeruddin, U. Röthlisberger and M. Grätzel, Energy Environ. Sci., 2016, 9, 656–662 CAS.
- M. Saliba, T. Matsui, K. Domanski, J.-Y. Seo, A. Ummadisingu, S. M. Zakeeruddin, J.-P. Correa-Baena, W. R. Tress, A. Abate, A. Hagfeldt and M. Grätzel, Science, 2016, 354, 206–209 CrossRef CAS PubMed.
- W. S. Yang, B.-W. Park, E. H. Jung, N. J. Jeon, Y. C. Kim, D. U. Lee, S. S. Shin, J. Seo, E. K. Kim, J. H. Noh and S. I. Seok, Science, 2017, 356, 1376–1379 CrossRef CAS PubMed.
- H. Bhunia, S. Chatterjee and A. J. Pal, ACS Appl. Energy Mater., 2018, 1, 4351–4358 CrossRef CAS.
- Z. Li, M. Yang, J.-S. Park, S.-H. Wei, J. J. Berry and K. Zhu, Chem. Mater., 2016, 28, 284–292 CrossRef CAS.
- D. Ghosh, A. R. Smith, A. B. Walker and M. S. Islam, Chem. Mater., 2018, 30, 5194–5204 CrossRef CAS.
- J.-W. Lee, D.-H. Kim, H.-S. Kim, S.-W. Seo, S. M. Cho and N.-G. Park, Adv. Energy Mater., 2015, 5, 1501310 CrossRef.
- H. J. Snaith, J. Phys. Chem. Lett., 2013, 4, 3623–3630 CrossRef CAS.
- Y. Zhao and K. Zhu, Chem. Soc. Rev., 2016, 45, 655–689 RSC.
- H.-L. Hsu, C.-C. Chang, C.-P. Chen, B.-H. Jiang, R.-J. Jeng and C.-H. Cheng, J. Mater. Chem. A, 2015, 3, 9271–9277 RSC.
- B. Saparov and D. B. Mitzi, Chem. Rev., 2016, 116, 4558–4596 CrossRef CAS PubMed.
- J.-H. Im, J. Chung, S.-J. Kim and N.-G. Park, Nanoscale Res. Lett., 2012, 7, 353 CrossRef PubMed.
- M. Safdari, A. Fischer, B. Xu, L. Kloo and J. M. Gardner, J. Mater. Chem. A, 2015, 3, 9201–9207 RSC.
- C. Wu, K. Chen, D. Y. Guo, S. L. Wang and P. G. Li, RSC Adv., 2018, 8, 2900–2905 RSC.
- W. Peng, X. Miao, V. Adinolfi, E. Alarousu, O. El Tall, A.-H. Emwas, C. Zhao, G. Walters, J. Liu, O. Ouellette, J. Pan, B. Murali, E. H. Sargent, O. F. Mohammed and O. M. Bakr, Angew. Chem., Int. Ed., 2016, 55, 10686–10690 CrossRef CAS PubMed.
- Y. Wang, T. Zhang, G. Li, F. Xu, T. Wang, Y. Li, Y. Yang and Y. Zhao, J. Energy Chem., 2018, 27, 215–218 CrossRef.
- C. Ma, D. Shen, M.-F. Lo and C.-S. Lee, Angew. Chem., Int. Ed., 2018, 57, 9941–9944 CrossRef CAS PubMed.
- G. Kresse and J. Furthmüller, Comput. Mater. Sci., 1996, 6, 15–50 CAS.
- P. E. Blöchl, Phys. Rev. B, 1994, 50, 17953–17979 Search PubMed.
- J. P. Perdew, K. Burke and M. Ernzerhof, Phys. Rev. Lett., 1996, 77, 3865–3868 CAS.
- D. A. Egger and L. Kronik, J. Phys. Chem. Lett., 2014, 5, 2728–2733 CrossRef CAS PubMed.
- Y. Wang, T. Gould, J. F. Dobson, H. Zhang, H. Yang, X. Yao and H. Zhao, Phys. Chem. Chem. Phys., 2014, 16, 1424–1429 CAS.
- S. Grimme, J. Antony, S. Ehrlich and H. Krieg, J. Chem. Phys., 2010, 132, 154104 CrossRef PubMed.
- D. Liu, Q. Li, J. Hu, H. Jing and K. Wu, J. Mater. Chem. C, 2019, 7, 371–379 RSC.
- G. E. Eperon, S. D. Stranks, C. Menelaou, M. B. Johnston, L. M. Herz and H. J. Snaith, Energy Environ. Sci., 2014, 7, 982–988 CAS.
- C. Zheng and O. Rubel, J. Phys. Chem. C, 2017, 121, 11977–11984 CrossRef CAS.
- K. N. Robertson, T. S. Cameron and O. Knop, Can. J. Chem., 1996, 74, 1572–1591 CrossRef CAS.
- C. C. Stoumpos, C. D. Malliakas and M. G. Kanatzidis, Inorg. Chem., 2013, 52, 9019–9038 CAS.
- R. Ali, G.-J. Hou, Z.-G. Zhu, Q.-B. Yan, Q.-R. Zheng and G. Su, Chem. Mater., 2018, 30, 718–728 CrossRef CAS.
- D. Yang, J. Lv, X. Zhao, Q. Xu, Y. Fu, Y. Zhan, A. Zunger and L. Zhang, Chem. Mater., 2017, 29, 524–538 CAS.
- P.-P. Sun, Q.-S. Li, L.-N. Yang and Z.-S. Li, Nanoscale, 2016, 8, 1503–1512 CAS.
- Z. Xiao, W. Meng, J. Wang, D. B. Mitzi and Y. Yan, Mater. Horiz., 2017, 4, 206–216 RSC.
- S. Saha, T. P. Sinha and A. Mookerjee, Phys. Rev. B: Condens. Matter Mater. Phys., 2000, 62, 8828–8834 CrossRef CAS.
| This journal is © The Royal Society of Chemistry 2019 |

