 Open Access Article
Graphitic carbon nitride (g-C3N4)/graphite nanocomposite as an extraordinarily sensitive sensor for sub-micromolar detection of oxalic acid in biological samples
Taher Alizadeh *a,
Sahar Nayerib and
Negin Hamidia
aDepartment of Analytical Chemistry, Faculty of Chemistry, University College of Science, University of Tehran, P. O. Box 14155-6455, Tehran, Iran. E-mail: talizadeh@ut.ac.ir
bDepartment of Applied Chemistry, Faculty of Science, University of Mohaghegh Ardabili, Ardabil, Iran
First published on 29th April 2019
Abstract
Nanosized graphitic carbon nitride (nano-g-C3N4) was synthesized using the thermal polymerization of melamine and utilized as a novel electrocatalyst for electrooxidation of oxalic acid (OA). The nano-g-C3N4 was characterized by Fourier transform infrared spectroscopy (FT-IR), X-ray diffraction (XRD) and field emission scanning electron microscopy (FE-SEM). The electrocatalytic performance of the g-C3N4-modified carbon paste electrode (g-C3N4/CPE) was investigated by cyclic voltammetry and electrochemical impedance spectroscopy (EIS). The modified electrode showed excellent electrocatalytic activity towards the oxidation of OA. The effects of electrode composition, pH and scan rate on the electrooxidation response of OA were studied. Under optimized conditions, the differential pulse voltammetric response of the electrode was linearly related to OA concentrations between 1 and 1000 μM, with a limit of detection (LOD) of 7.5 × 10⁻⁷ M. The electrode exhibited very high sensitivity of 1945 μA mM−1 cm−2 for OA assay. The developed method was successfully applied for the determination of OA in urine samples with satisfactory results.
Introduction
Oxalic acid is a toxic compound which exists extensively in plants, animals and microbes. Since it can easily interact with Ca2+ and Mg2+ to form less soluble oxalate salts, high levels of OA in the digestive system cause kidney stones.1 Hence, the determination of OA in food and urine has attracted much interest in the management of food quality and arrangement of a rational diet.2So far, several techniques such as gas chromatography,3 liquid chromatography,4 spectroscopy,5 and enzymatic methods6 have been developed for the determination of OA or oxalate species. However, these instrumental methods have suffered from some disadvantages such as high cost, low sensitivity and insufficient selectivity compared to electrochemical techniques.7 Nevertheless, the oxidation of OA at conventional electrodes usually requires a high overpotential.2,8 However, surface modification of the electrodes with various compounds, reduces the oxidation potential for OA and considerably increases the detection sensitivity.2,7
Graphitic carbon nitride (g-C3N4) which is a metal-free semiconductor with a graphite-like layered structure has drawn much attention as an effective photocatalyst, due to very high thermal and chemical stability, non-toxicity and convenient preparation as well as outstanding electronic properties.9–12 Generally, carbon nitride materials are fabricated by directly condensation of nitrogen-containing organic precursors for example urea,12 thiourea,13 melamine,10 dicyandiamide,14 cyanamide,15 guanidine hydrochloride.
In spite of widely application of g-C3N4 as photocatalyst material it has not been widely regarded as electrocatalyst material. Literature survey indicated that a limited number of works have been allocated to the study of electrocatalytic application of this material.16–18 Some recent reviews have summarized the various applications of g-C3N4.19 Therefore, introducing g-C3N4 as the electrocatalyst material is interesting; since, it can extend the application of this material in electrocatalysis field as a very important scientific field.
In this work, the application of g-C3N4 nanomaterial, prepared from melamine, was checked for electrocatalysis of OA which exhibited very interesting results. The carbon paste electrode, modified with g-C3N4 nanomaterial showed very fascinating analytical characteristics such as high sensitivity, low detection limit and also high selectivity, enabling use to measure OA content of urine samples.
Experimental
Apparatus and chemicals
The surface morphology of the prepared g-C3N4 was examined by means of FE-SEM (TESCAN MIRA, Czech). The crystalline structure of the nanoparticles was studied by XRD (PHILIPS PW1730, Netherlands) using Cu Kα radiation at 25 °C. FT-IR measurements were performed using a PerkinElmer spectrophotometer RXI.Voltammetric measurements were carried out using a potentiostat/galvanostat (Netherlands, Ivium VERTEX) and controlled by Ivium Soft (Version 2.422). In all voltammetric experiments, g-C3N4/CPE, saturated calomel electrode (SCE) and a platinum wire were used as the working, reference and auxiliary electrodes, respectively. All of the electrochemical experiments were performed at room temperature.
The electrodes, explained previously, were also employed in the EIS experiments. The EIS analysis were carried out in a solution, containing 0.5 mmol L−1 of OA and 50.0 mmol L−1 of ammonium acetate (pH = 4.5), at frequency range of 1000 kHz to 0.10 Hz, ΔEac = 200 mV and dc potential of 1.2 V.
Stock solutions of OA were prepared by dissolving OA in deionized water and diluting with ammonium acetate solution (pH = 4.5). Ammonium acetate solution was used as the supporting electrolyte.
All chemicals were of analytical grade and purchased from Merck (Germany). These chemicals were used without further purifications.
Synthesis of g-C3N4
The bulk g-C3N4 was synthesized by thermal polymerization of melamine. For this purpose, 5 g of melamine was placed into an alumina crucible, covered with a lid, and heated in a furnace at a heating rate of 3.3 °C min−1 up to 550 °C and left for 2 h at this temperature and then, slowly cooled down. Finally, a yellow powder was obtained.Preparation of g-C3N4-modified carbon paste electrode
For the construction of g-C3N4-modified carbon paste electrode (g-C3N4/CPE), 65 mg of graphite powder was homogenized in a mortar with 10 mg of g-C3N4 powder for 10 min. Subsequently, n-eicosane (25 mg) was melted in a dish (at 50 °C) and mixed with the graphite/g-C3N4 blend by a stainless steel spatula. The resulting paste was then packed into a hole (4.0 mm in diameter), located at the end of an electrode. The electrical contact was provided by a copper wire connected to the paste in the inner hole of the tube. Then, the excess of solidified paste was taken away by polishing of the electrode surface via a paper sheet. After each determination stage, the modified electrode could be reused, by smoothing of the electrode surface on a paper sheet.Preparation of real samples
Urine samples were taken from 2 healthy volunteers from Iran, Tehran. For analysis of OA content of urine samples, 1 mL of the described samples were diluted to 50 mL by adding 49 mL of buffer solution (ammonium acetate buffer, pH = 4.5).Results and discussion
Characterization of the synthesized g-C3N4
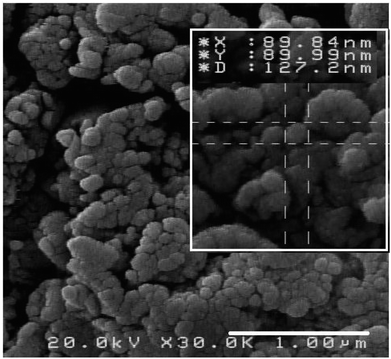
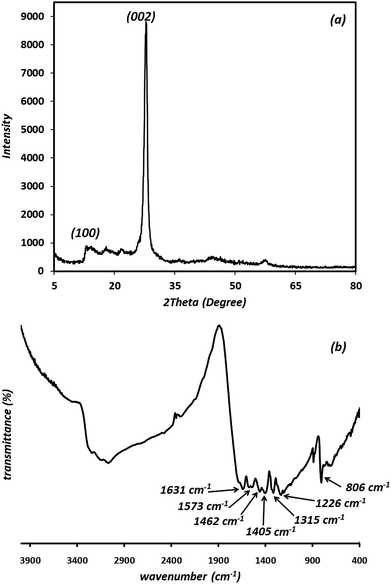
The morphology and structural properties of the synthesized g-C3N4 were investigated using an FE-SEM. As shown in Fig. 1, the g-C3N4 displays nano-sized particles-like structure.In order to study the crystalline property and phase purity of the synthesized g-C3N4, powder XRD pattern of the material was recorded in the 5–80° (2θ) range which is displayed in Fig. 2(a). As can be seen, g-C3N4 exhibits different peaks at 2θ = 13.1° and 27.3°. The weak peak (100) around 2θ = 13.1° is related to the in-plane structural packing motif of tri-s-triazine repeating units and the strong peak at 27.3°, corresponding to the (002) reflection, is a characteristic interlayer stacking reflection of conjugated aromatic systems, which can be well-indexed to the interlayer diffraction of crystal planes of the hexagonal phase of carbon nitride graphite-like structure. These data match well with the values reported by the JCPDS (no. 87-1526).20–22 Ultimately, it is apparent that no impurities peaks were observed in the XRD patterns, which confirmed the high purity of the as-prepared sample. It is generally accepted that g-C3N4 is based on tri-s-triazine building blocks. Therefore, the graphitic stacking structure is confirmed by XRD pattern.
The average crystallite size (D) of synthesized material is calculated by the Debye–Scherrer equation:23,24
 | (1) |
The results revealed that the average crystallite size is 42.9 nm for synthesized material.
The presence of functional groups and molecular structure information of the prepared g-C3N4 were further investigated using FT-IR results. As shown in Fig. 2(b), the peaks at 806 cm−1 is attributed to the breathing mode of the tri-s-triazine units (the out-of-plane skeletal bending mode of triazine, s-triazine ring modes).25–27 The prominent and broad set of peaks in the region of 1200–1650 cm−1 (1226, 1315, 1405, 1462, 1573, 1631 cm−1) are characteristic peaks of the typical stretching vibration modes of aromatic C–N heterocycles (the bands at 1226 and 1315 cm−1 are attributed to the secondary (2C–N) and tertiary (3C–N) amine fragments, respectively). The peak at 1631 cm−1 and 1226 cm−1 are attributed to C![[double bond, length as m-dash]](https://www.rsc.org/images/entities/char_e001.gif) N and C–N stretching vibration modes, respectively.28 The prominent bands in the region of 2900–3500 cm−1 originate from the stretching vibration modes for the –NH–, NH2– and hydroxyl of the adsorbed H2O.29 The residual hydrogen atoms connected to the edges of g-C3N4 sheets in the form of C–NH2 and 2C–NH bonds.25 The results described above confirm the typical chemical structure regarded usually for g-C3N4 material.
N and C–N stretching vibration modes, respectively.28 The prominent bands in the region of 2900–3500 cm−1 originate from the stretching vibration modes for the –NH–, NH2– and hydroxyl of the adsorbed H2O.29 The residual hydrogen atoms connected to the edges of g-C3N4 sheets in the form of C–NH2 and 2C–NH bonds.25 The results described above confirm the typical chemical structure regarded usually for g-C3N4 material.
Electrocatalytic oxidation of OA on the g-C3N4/CPE
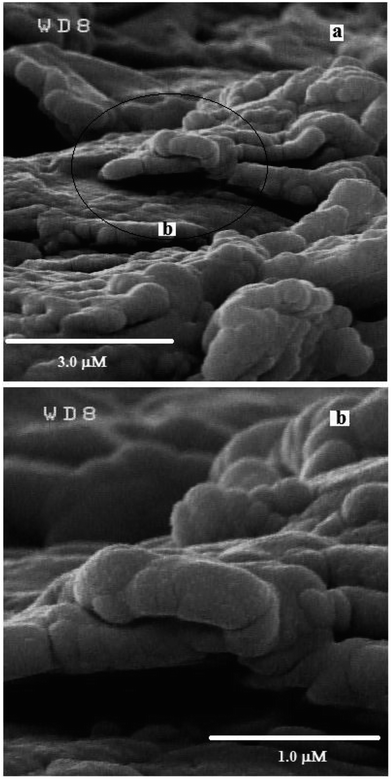
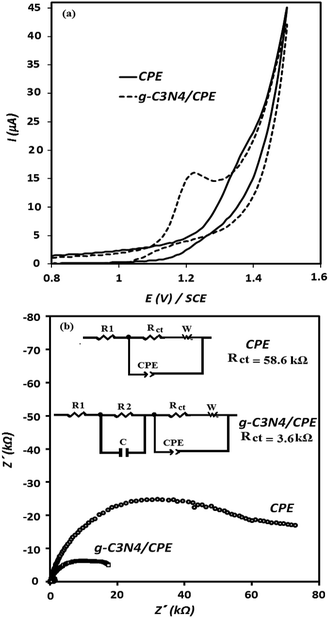
Fig. 3 represents the SEM images of the g-C3N4/graphite/n-eicosane nanocomposite, used as an electrode material for electrocatalytic oxidation of OA. As seen, the g-C3N4 nanomaterials are uniformly and tightly distributed on the graphite sheets making the g-C3N4 covered graphite sheets which also connected together, aiding binder material of n-eicosane.To investigate the electrocatalytic activity of the g-C3N4/CPE towards OA oxidation, cyclic voltammetry experiments were carried out at the bare CPE and g-C3N4/CPE in 0.05 M of ammonium acetate, containing also 0.1 mM of OA, at scan rate of 100 mV s−1 (Fig. 4(a)). According to the CV results shown, CPE exhibits a small peak around 1.4 V for OA. However, at the same experimental conditions, a distinct and sharp voltammetric signal at potential of about 1.2 V is created by the g-C3N4/CPE. This means that in the presence of g-C3N4 not only the peak current of OA is remarkably increased but also the oxidation potential of OA is noticeably decreased, suggesting that the electrooxidation of OA is facilitated when including g-C3N4 in the electrode composition. Such effect can be attributed to the electrocatalytic behaviour of g-C3N4 for electrooxidation of OA at the modified electrode.
EIS experiments was also carried out to extract impedance characteristics of the previously described paste electrodes, utilized for the electrooxidation of OA. The obtained results are depicted in Fig. 4(b) as the Nyquist plots. The diameters of the depressed semicircles are assigned to the charge transfer resistance magnitude of OA at the corresponding electrodes. As can be seen, the charge transfer resistance of OA at the electrode surface is decreased about 3-fold in the presence of g-C3N4. These results are in good accordance with the CV results shown in Fig. 4(a) (described previously).
The effect of electrode composition
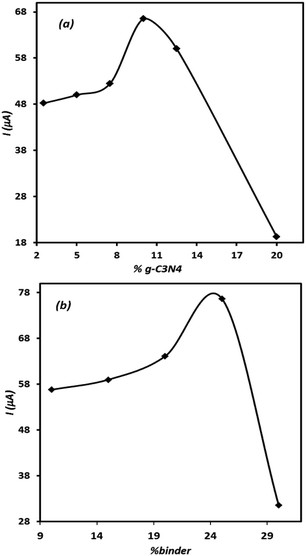
Since the composition of electrode significantly affects the electrode performance, the effect of electrode ingredients on its performance was studied. For this purpose, several electrodes containing different amounts of the modifier and binder were prepared individually and then their voltammetric signals for OA were recorded. The results are represented in Fig. 5(a) and (b). Either in the case of the modifier agent or for binder content, the related curves show optimal points. This means that the controlled amount of these materials should be included in the electrode composition to record appropriate signal for OA. As can be seen, in the case of both tested ingredients, the presence of the studied component higher than the optimal value leads to a sharp decrease in the electrode signal. This behaviour is related to the insulating characteristic of the binder and high electrical resistance of g-C3N4, which at elevated amounts results in unadoptable enhancement of the composite electrode electrical resistance. However, based on the results, depicted in Fig. 5, the modified electrode containing 10% of g-C3N4 and 25% of binder was adopted as the best electrode in this research.Evaluation of the effect of scan rate
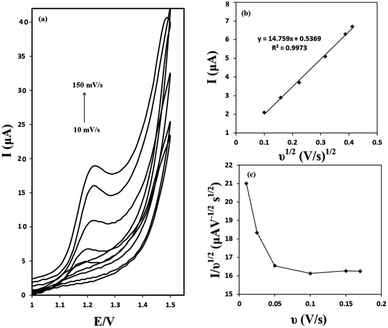
The effect of the scan rate on the voltammograms profile was evaluated. Cyclic voltammograms of 50 μM of OA at the g-C3N4/CPE at different scan rates are presented in Fig. 6(a). It can be seen that as the potential scan rate is increased, the oxidation peak currents increase gradually and at the same time the oxidation peak shift towards positive potentials. As shown in Fig. 6(b), there is a linear relationship between the oxidation peak current and the square root of scan rate in the range of 10–150 mV s−1 (correlation coefficient of 0.9973). These results suggest a mass transfer (diffusion) controlled process rather than surface controlled. Also, it can be concluded that the electrochemical reaction studied, is a totally irreversible electrochemical reaction.The electrochemical reaction of OA at g-C3N4/CPE was further studied by plotting of the scan rate normalized current (I/ν1/2) against the scan rate. This was made from the scan rate of 10 to 150 mV s−1. The obtained results are depicted in Fig. 6(c). As can be seen, the normalized current decreases as the scan rate increases up to about 100 mV s−1 and then it keeps relatively constant. This is the typical shape of an electrocatalytic mechanism.30
Evaluation of the effect of pH
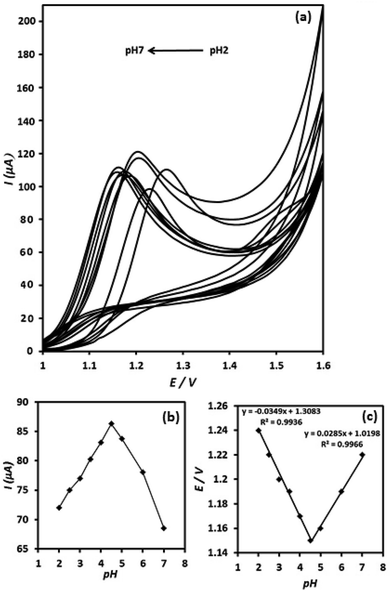
The effect of pH value on the electrooxidation of OA on the surface of g-C3N4/CPE was investigated between pH 2 to 7 in ammonium acetate buffer solution (0.05 M) (Fig. 7(a)). The current signal of OA at the g-C3N4/CPE increases, when elevating pH value from 2 to 4.5 and then it decreases at further pH values (higher than 4.5) (Fig. 7(b)). Thus, pH = 4.5 was chosen as optimum pH value for further studies.The dependence of the oxidation peak potential with pH of the supporting electrolyte is presented in (Fig. 7(c)). As can be seen, the peak potentials shift to less positive direction with increasing of the solution pH at the range of 2–4.5. However, the peak potentials shift to inverse direction (more positive potential direction) when increasing pH value from 4.5 to higher values (from pH = 4.5 to pH = 7). In the pH range of 2–4.5 a linear relationship exists between the oxidation peak potential and pH value, exhibiting linear regression equation of Ep (V) = 1.31–0.035pH (R2 = 0.9936), suggesting a curve slope of 35 mV per pH. Furthermore, between pH values of 4.5–7, the E/pH curve is linear and shows curve slope of about 28.5 mV per pH. The inflection point of the Ep versus pH in Fig. 7(c) appears at pH 4.5, which is meaningfully coincident with the pKa2 value of OA (4.2). The slope values of 35 and 28.5 mV per pH for the E/pH curve are close to the half of the theoretical value of −59/2 mV per pH−1, which suggests that the proton numbers is half the electron number, involved in the OA electrooxidation reaction. Moreover, the presence of two distinct linear curves in the E/pH curve suggests two different routes for the electrooxidation of OA at the electrode surface depending on the pH conditions of the solution.
Based on the above mentioned data as well as considering the chemical structure and characteristics of g-C3N4, the following equations (eqn (2)–(5)) are proposed as the electrooxidation mechanism of OA at the g-C3N4/CPE.
According to the mechanism proposed, g-C3N4 is oxidized to produce a radical cation compound (eqn (1)) which then interact with HC2O4− (as the dominant species of OA in pH range of 2–4.5) to give a radical species of  , carbon monoxide and an electron (eqn (2)). In this process g-C3N4 is also regenerated. The radical agent generated previously is highly unstable and decompose to give second CO2, proton and another electron. We think that the described mechanism is dominant at pH range of 2–4.5. However, at elevated pH (above 4.5) the dominant species of OA is oxalate and thus we propose eqn (4) as the electrooxidation mechanism of OA at the electrode. Herein, the radical cation species g-C3N4+˙, created via applied potential, attacks oxalate species, in the presence of water as coregent, to oxidize electrocatalytically OA.
| g-C3N4 → g-C3N4+˙ + e− | (2) |
 | (3) |
 | (4) |
| g-C3N4+˙ + C2O42− + H2O → g-C3N4 + 2CO2 + ½O2 + 2H+ + 4e− | (5) |
Electroactive surface area of the modified electrode
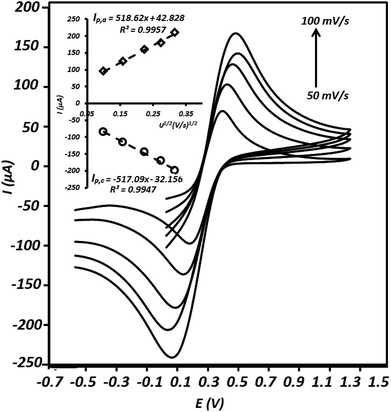
In order to study the active surface area of the g-C3N4/CPE, cyclic voltammetry experiment was executed using this electrode in the presence of Fe(CN)63−/Fe(CN)64−, as a well-known reversible redox couple. The relationship between redox peak currents and square root of scan rates (Randles–Sevcik equation) was applied to calculate the electrochemical surface areas of the electrode.31–33| Ip = 2.69 × 10⁵n3/2AD1/2Cν1/2 | (6) |
Determination of OA by SWV on the g-C3N4/CPE
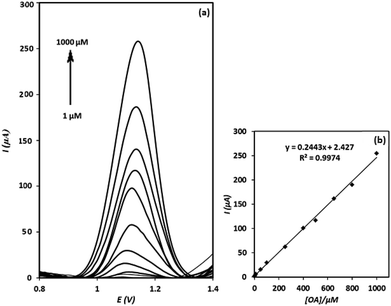
After evaluation of the electrochemical behaviour of OA at the electrode surface, square wave voltammetry technique was utilized to determine OA. As shown in Fig. 9(a), the intensities of square wave voltammograms increase linearly with increasing of OA concentration over the concentration range of 1–1000 μM (calibration Fig. 9(b)). The detection limit of the method was calculated to be 0.75 μM (based on the 3Sb/m formula, at which Sb and m stand for standard deviation of the blank and slope of the calibration curve, respectively). The relative standard deviation (RSD) of three replicated determinations of OA with a fabricated electrode was calculated to be 3.8% (n = 3), indicating a good repeatability for the sensor. Moreover, the reproducibility of four electrodes independently made, showed a RSD of 4.1% for the determination of 500 μM of OA. Meanwhile, it was found that the signal of g-C3N4/CPE was stable even after 12 months. This is interesting result and can be assigned to the stability of g-C3N4.Interference study
The interference effect of several compounds, that may be present in biological matrix were checked and studied under optimum conditions on the response of the prepared electrode to OA. The tolerance limit was defined as the maximum concentration of the interfering species that caused an error of ±5% in the determination of OA. It was found that 1000-fold molar excess of glucose, fructose and urea, 500-fold molar excess of lactic acid, 300-fold molar excess of maleic acid, 100-fold molar excess of dopamine and tartaric acid, 30-fold molar excess of ascorbic acid, 5-fold molar excess of citric acid and uric acid had no influences on the electrooxidation response of 100 μM of OA. The obtained results, presented in Table 1, indicate that the proposed electrode has acceptable selectivity and resistance against interfering agents.| Species | Interference level | Species | Interference level |
|---|---|---|---|
| Glucose | <1000 | Dopamine | <100 |
| Fructose | <1000 | Tartaric acid | <100 |
| Urea | <1000 | Ascorbic acid | <30 |
| Lactic acid | <500 | Citric acid | <5 |
| Maleic acid | <300 | Uric acid | <5 |
Determination of OA in urine samples
In order to evaluate applicability of the modified electrode, it was applied for the determination of OA in urine samples. The validity of the method was also assessed by comparing the determination results of the developed method with those obtained by HPLC as reference method. The results are listed in Table 2. Based on the results depicted the method shows good RSD and satisfactory recoveries for OA determination in urine samples. Moreover, there was no significant difference between the determination results of the method and those obtained by HPLC method (confidence level of 95%).| Samples | [OA] by HPLC | [OA] by sensor | RSD% | Recovery% |
|---|---|---|---|---|
| Urine. 1 | 1.58 × 10⁻⁴ | 1.51 × 10⁻⁴ | 3.5 | 95.57 |
| Urine. 2 | 2.88 × 10⁻⁴ | 2.79 × 10⁻⁴ | 4.1 | 96.87 |
Comparison of the sensor with some previously reported sensors
The analytical characteristics of the proposed electrode were compared to those of some electrochemical methods, reported previously for the determination of OA. The results are summarized in Table 3. This comparison shows acceptable results for the proposed electrode. More interestingly, compared to other methods represented, this sensor exhibits the highest sensitivity for OA determination.| LOD (mol L−1) | LR (mol L−1) | Sensitivity (μA mM−1 cm−2) | Ref. | |
|---|---|---|---|---|
| DPV | 2 × 10⁻⁴ | (2–130) × 10−4 | 105.45 | 2 |
| (13–45) × 10−3 | 80.02 | |||
| CV | 0.1 × 10⁻³ | (0.1–50) × 10−3 | 295.82 | 34 |
| CV | 0.2 × 10⁻⁴ | (0.03–5) × 10−3 | 295.82 | 35 |
| Amperometry | 1 × 10⁻⁶ | Up to 0.3 × 10⁻³ | 32.59 | 36 |
| CV | Down to 2 × 10⁻⁵ | N.R | N.R | 37 |
| SWV | 2.38 × 10⁻⁶ | (0.05–3.4) × 10−4 | N.R | 38 |
| SWV | 0.75 × 10⁻⁶ | (1–1000) × 10−6 | 1945 | This work |
Conclusion
In this work, a nano-sized g-C3N4-modified carbon paste electrode was synthesized and utilized for the determination of OA by square wave voltammetry. The electrode showed excellent electrocatalytic characteristics for OA electrooxidation. It was shown that the new introduced OA sensing platform is the most sensitive sensing method, compared to the previous OA electrochemical sensors. Moreover, the method exhibited very low detection limit as well as high selectivity, enabling us to use the sensor for OA determination in urine samples. Furthermore, the modified electrode can also be applied for determination of OA in urine samples with excellent sensitivity.Conflicts of interest
There are no conflicts to declare.Acknowledgements
The authors thank the University of Tehran and University of Mohaghegh Ardabili, for all supports.References
- D. J. Kim, H. Y. Kim, M. H. Kim and J. S. Lee, Food Sci. Biotechnol., 2007, 16, 650–654 CAS.
- Y. Liu, J. Huang, D. Wang, H. Hou and T. You, Anal. Methods, 2010, 2, 855–859 RSC.
- E. J. Jellum, J. Chromatogr., 1977, 143, 427–462 CrossRef CAS.
- F. W. Wu, Z. K. He, Q. Y. Luo and Y. E. Zeng, Food Chem., 1999, 65, 543–546 CrossRef CAS.
- A. A. Ensafi and A. Kazemzadeh, Fresenius. J. Anal. Chem., 2000, 367, 590–592 CrossRef CAS PubMed.
- E. F. Perez, G. De Oliveira Neto and L. T. Kubota, Sens. Actuators, B, 2001, 72, 80–85 CrossRef CAS.
- J. Raoof, F. Chekin and V. Ehsani, Sens. Actuators, B, 2015, 207, 291–296 CrossRef CAS.
- B. Sljuki, R. Baron and R. G. Compton, Electroanalysis, 2007, 19, 918–922 CrossRef.
- A. Akhundi and A. Habibi-Yangjeh, J. Colloid Interface Sci., 2017, 15, 697–710 CrossRef PubMed.
- P. C. Nagajyothi, M. Pandurangan, S. V. P. Vattikuti, C. O. Tettey, T. V. M. Sreekanth and J. Shim, Sep. Purif. Technol., 2017, 188, 228–237 CrossRef CAS.
- S. Selvarajan, A. Suganthi and M. Rajarajan, Ultrason. Sonochem., 2018, 41, 651–660 CrossRef CAS PubMed.
- S. Zhang, L. Gao, D. Fan, X. Lv, Y. Li and Z. Yan, Chem. Phys. Lett., 2017, 672, 26–30 CrossRef CAS.
- J. D. Hong, X. Y. Xia, Y. S. Wang and R. Xu, J. Mater. Chem., 2012, 22, 15006–15012 RSC.
- J. S. Zhang, M. W. Zhang, R. Q. Sun and X. C. Wang, Angew. Chem., Int. Ed., 2012, 51, 10145–10149, DOI:10.1002/anie.201205333-nss.
- K. Takanabe, K. Kamata, X. Wang, M. Antonietti, J. Kubota and K. Domen, Phys. Chem. Chem. Phys., 2010, 12, 13020–13025 RSC.
- J. Tian, Q. Liu, A. M. Asiri, K. A. Alamry and X. Sun, ChemSusChem, 2014, 7, 2125–2130 CrossRef CAS PubMed.
- J. Tian, R. Ning, Q. Liu, A. M. Asiri, A. O. Al-Youbi and X. Sun, ACS Appl. Mater. Interfaces, 2014, 6, 1011–1017 CrossRef CAS PubMed.
- T. Alizadeh, S. Nayerib and A. Habibi-Yangjeh, Sens. Actuators, B, 2019, 279, 245–254 CrossRef CAS.
- A. Wang, C. Wang, L. Fu, W. Wong-Ng and Y. Lan, Nano-Micro Lett., 2017, 9, 47–53 CrossRef PubMed.
- J. Luo, X. S. Zhou, L. Ma and X. Y. Xu, RSC Adv., 2015, 5, 68728–68735 RSC.
- Y. G. Li, X. L. Wei, X. Y. Yan, J. T. Cai, A. N. Zhou, M. R. Yang and K. Q. Liu, Phys. Chem. Chem. Phys., 2016, 18, 10255–10261 RSC.
- Z. Zhu, Z. Y. Lu, D. D. Wang, X. Tang, Y. S. Yan, W. D. Shi, Y. S. Wang, N. Gao, X. Yao and H. J. Dong, Appl. Catal., B, 2016, 182, 115–122 CrossRef CAS.
- T. Alizadeh and F. Jamshidi, J. Solid State Electrochem., 2015, 19, 1053–1062 CrossRef CAS.
- J. Langford and A. Wilson, J. Appl. Crystallogr., 1978, 11, 102–103 CrossRef CAS.
- F. T. Li, Y. Zhao, Q. Wang, X. J. Wang, Y. J. Hao and R. H. Liu, J. Hazard. Mater., 2015, 283, 371–381 CrossRef CAS PubMed.
- B. Vellaichamy and P. Periakaruppan, New J. Chem., 2017, 41, 7123–7132 RSC.
- G. Tian, Y. Chen, W. Zhou, K. Pan, Y. Dong, C. Tian and H. Fu, J. Mater. Chem., 2011, 21, 887–892 RSC.
- Y. C. Zhao, Z. Liu, W. G. Chu, L. Song, Z. X. Zhang, D. L. Yu, Y. J. Tian, S. S. Xie and L. F. Sun, Adv. Mater., 2008, 20, 1777–1781 CrossRef CAS.
- F. Guo, W. Shi, X. Lin and G. Che, J. Phys. Chem. Solids, 2014, 75, 1217–1222 CrossRef CAS.
- T. Alizadeh and S. Mirzagholipur, Biochem. Eng. J., 2015, 97, 81–91 CrossRef CAS.
- T. Alizadeh and F. Rafiei, Mater. Chem. Phys., 2019, 227, 176–183 CrossRef CAS.
- S. J. Konopka and B. McDuffie, Anal. Chem., 1970, 42, 1741–1746 CrossRef CAS.
- M. Akhoundian, T. Alizadeha, M. R. Ganjali and F. Rafiei, Biosens. Bioelectron., 2018, 111, 27–33 CrossRef CAS PubMed.
- H. Matsuura, S. Akabe, T. Kitamura, T. Takahashi and S. Uchiyama, Anal. Sci., 2015, 31, 733–735 CrossRef PubMed.
- H. Ahmar, A. R. Fakhari, M. R. Nabid, S. J. Tabatabaei Rezaei and Y. Bide, Sens. Actuators, B, 2012, 171–172, 611–618 CrossRef CAS.
- S. Yamazaki, N. Fujiwara and K. Yasuda, Electrochim. Acta, 2010, 55, 753–758 CrossRef CAS.
- L. G. Shaidarova, I. A. Chelnokova, A. V. Gedmina, G. K. Budnikov, S. A. Ziganshina, A. A. Mozhanova and A. A. Bukharaev, J. Anal. Chem., 2006, 61, 375–381 CrossRef CAS.
- X. Cai, B. Ogorevc, G. TavEur and K. Kalcher, Electroanalysis, 1995, 7, 639–643 CrossRef CAS.
| This journal is © The Royal Society of Chemistry 2019 |

