 Open Access Article
Creative Commons Attribution 3.0 Unported Licence
Magnetic entropy table-like shape and enhancement of refrigerant capacity in La1.4Ca1.6Mn2O7–La1.3Eu0.1Ca1.6Mn2O7 composite
R. M'nassri *a,
Muaffaq M. Nofalb,
P. de Rangoc and
N. Chniba-Boudjadac
aUnité de recherche Matériaux Avancés et Nanotechnologies (URMAN), Institut Supérieur des Sciences Appliquées et de Technologie de Kasserine, Kairouan University, BP 471 Kasserine 1200, Tunisia. E-mail: rafik_mnassri@yahoo.fr
bDepartment of Mathematics and General Sciences, Prince Sultan University, P. O. Box 66833, Riyadh 11586, Saudi Arabia
cInstitut NEEL, BP 166, 38042 Grenoble Cedex 09, France
First published on 14th May 2019
Abstract
In this work, we have investigated the structural, magnetic and magnetocaloric properties of La1.4Ca1.6Mn2O7 (A) and La1.3Eu0.1Ca1.6Mn2O7 (B) oxides. These compounds are synthesized by a solid-state reaction route and indexed with respect to Sr3Ti2O7-type perovskite with the I4/mmm space group. The substitution of La by 10% Eu enhances the value of magnetization and reduces the Curie temperature (TC). It is also shown that these compounds undergo a first-order ferromagnetic–paramagnetic phase transition around their respective TC. The investigated samples show large magnetic entropy change (ΔSM) produced by the sharp change of magnetization at their Curie temperatures. An asymmetric broadening of the maximum of ΔSM with increasing field is observed in both samples. This behaviour is due to the presence of metamagnetic transition. The ΔSM(T) is calculated for Ax/B1−x composites with 0 ≤ x ≤ 1. The optimum ΔSM(T) of the composite with x = 0.48 approaches a nearly constant value showing a table-like behaviour under 5 T. To test these calculations experimentally, the composite with nominal composition A0.48/B0.52 is prepared by mixing both individual samples A and B. Magnetic measurements show that the composite exhibits two successive magnetic transitions and possesses a large MCE characterized by two ΔSM(T) peaks. A table-like magnetocaloric effect is observed and the result is found to be in good agreement with the calculations. The obtained ΔSM(T) is ≈4.07 J kg−1 K−1 in a field change of 0–5 T in a wide temperature span over ΔTFWHM ∼ 68.17 K, resulting in a large refrigerant capacity value of ≈232.85 J kg−1. The MCE in the A0.48/B0.52 has demonstrated that the use of composite increases the efficiency of magnetic cooling with μ0H = 5 T by 23.16%. The large ΔTFWHM and RC values together with the table-like (−ΔSM)max feature suggest that the A0.48/B0.52 composite can meet the requirements of several magnetic cooling composites based on the Ericsson-cycle. In addition, we show that the magnetic field dependence of MCE enables a clear analysis of the order of phase transition. The exponent N presents a maximum of N > 2 for A, B and A0.48/B0.52 samples confirming a first-order paramagnetic–ferromagnetic transition according to the quantitative criterion. The negative slope observed in the Arrott plots of the three compounds corroborates this criterion.
1. Introduction
Manganese oxides exhibiting colossal magnetoresistance (CMR) and large magnetocaloric effect (MCE) are a very hot topic in materials science, not only because of the interest they have generated in basic research but also for their potential technological applications in spintronics and magnetic refrigeration (MR).1,2 In addition, their adjustable phase transition temperatures, low-price and wear and corrosion resistance provide an additional advantage for the choice of manganese oxides as magnetic refrigerant materials for designing a “green” cooling refrigerator.3–5 Magnetic refrigerators are considered an ecologically friendly technology because of several advantages they have compared to traditional refrigerators. High efficiency, small volume, and being free of harmful gas leakage are among these advantages.6 The latter machines work on the principle of the MCE,7,8 which describes the adiabatic temperature change of magnetic substance produced by the magnetic entropy change (ΔSM) upon magnetization and demagnetization.9 When magnetics stimulus in an adiabatic process is applied, the entropy of the spin subsystem is diminished and the transfer of energy to the lattice produces heating of the magnetic substance. Conversely, removing magnetics stimulus of the substance causes it to cool down.10,11 The exploration of new refrigerant materials with large MCE at both ambient and cryogenic temperatures is strongly desired and is vital in accelerating the progress of magnetic cooling technology. Nevertheless, large MCE and negligible thermal and magnetic-field hysteresis losses are required for MR. Considering the various requirements for applying magnetic cooling, La2−2xCa1+2xMn2O7 Ruddlesden–Popper phases (n = 2) possess high magnetic moments and have a giant magnetocaloric effect. A giant peak value of ΔSM (16.8 J kg−1 K−1) originating from the abrupt change of magnetization observed at 5 T in La1.4Ca1.6Mn2O7 system.12 This value is mostly close to that of systems undergoing a first order magnetic phase transition (FOMT) such as Gd5GeSi2 (18.5 J kg−1 K−1) and MnFeP1−xAsx (18 J kg−1 K−1) alloys under the same field change.13 Generally, the ΔSM is adopted as an important index to demonstrate the refrigerant ability. Moreover, for a sample exhibiting FOMT, the value of ΔSM is highest near the magnetic transition temperature and falls rapidly with temperature, making its usage limited over a narrow temperature range.10 Even though the change in magnetic entropy is large in such type of materials, they exhibit large thermal and field hysteresis on variation of magnetization with temperature and magnetic field, respectively. However, a considerable refrigerant capacity (RC), besides a giant peak entropy change, is also essential to obtain an excellent refrigeration efficiency. In this context, FOMT compounds do not seem to be the best choices, as their large hysteresis losses and limited temperature spans lead to significant decreases in refrigerant capacities. From the practical application point of view, materials with a large MCE over a broad temperature range are desired. However, it is therefore interesting to search for new FOMT materials with low-level hysteresis, high performance and excellent functional stability. Among the presently known MCE materials with a first-order magnetic transition (FOMT) the La1.4Ca1.6Mn2O7 compounds fulfill most of the requirements for practical applications of magnetic refrigeration. First, it has a limited thermal hysteresis at the FOMT.14 Second, it is easy to tune the operating temperature by varying the La/Ca ratio or by substituting the Mn ion by various transition metal. Furthermore, the composition of this compound is low priced, have good chemical stability, easy to prepare, and does not contain any toxic or expensive elements such as arsenic and germanium, respectively.It is well known that the structure of La1.4Ca1.6Mn2O7 is constructed from ferromagnetic metal bilayer slices of MnO2 sheets taken from the cubic perovskite, each slice being separated by a nonmagnetic insulating spacer layer which serves to isolate the bilayers (La, Ca)2O2 stacked along the c-axis. The anisotropy and the reduced dimensionality of these compounds play a crucial role in their special properties different from those shown by the cubic perovskites.15–17 Basically, the simultaneous ferromagnetic and metallic states observed in the Mn-based perovskite are explained using the double exchange mechanism (DE) caused by charge disproportionation.18–20 The DE interaction in the Mn–O–Mn network in the case of bilayer manganite is expected to be much weaker along the stacking c-axis direction because of the intervening rock salt layer that disrupts the interaction between the [MnO2] layers. Members of this perovskite family are very responsive to small changes in composition and structure because of their layered structure. An inherent anisotropy modifies the thermomagnetic properties of the layered materials.
In the context of magnetic cooling, the La1.4Ca1.6Mn2O7 compound shows an abrupt change in the magnetization ((∂M/∂T)H) and illustrates his magnetic entropy (ΔSM(T)) with particularly peak at Curie temperature. However, in regenerative Ericsson cycle, the entropy change of the refrigerant ΔSM(T) should be constant (table-like MCE) over the operating temperature range of about 30 K. For this, there are number of publications21–23 in which the authors have proposed different solutions to improve the cooling capacity at larger spans. Therefore, a solution is to work with a multiphase or sandwich materials. These materials extend the temperature range in which the magnetic entropy changes significantly increase the possibility of improving performance through layering. Another simple way that increases the efficiency of magnetic cooling of bilayer manganites is the creation of the composite by a succession of magnetocaloric refrigerant samples with similar values of ΔSM and refrigerant capacity (RC).24,25 In this work, an optimum molar fraction of La1.4Ca1.6Mn2O7 (A) and La1.3Eu0.1Ca1.6Mn2O7 (B) is determined for the assembling of a composite to be used as refrigerant material in solid-state magnetic cooling. A physical mixture of La1.4Ca1.6Mn2O7 and La1.3Eu0.1Ca1.6Mn2O7 is introduced to extend the operating temperature window because TC of La1.4Ca1.6Mn2O7 can be modified by small addition of Eu in La site. In addition, to extend the range of refrigeration, a composite magnetic refrigerant can be also used to increase or to optimize the refrigeration capacity (RC). This represents approximately the total thermal energy transferred from the hot to cold reservoirs over the active temperature range. Therefore, it was demonstrated that mixing of La1.4Ca1.6Mn2O7 (A) and La1.3Eu0.1Ca1.6Mn2O7 (B) provides an extra material design tool such that the optimal magnetic refrigerant material can be developed for a specific temperature range. The experimental results agree well with those calculated and discussed in the framework of an optimum regeneration Ericsson cycle. The MCE and RC of a prepared composite have been compared with those of individual bilayer manganites.
2. Experimental details
In this work, standard ceramic process is used to prepare two samples: La1.4Ca1.6Mn2O7 (sample A) and La1.3Eu0.1Ca1.6Mn2O7 (sample B). Well-grounded stoichiometric mixture of La2O3, MnO2, CaCO3 and Eu2O3 with a purity of (99.9%) is prepared. These contents are mixed and grounded, then sintered for 12 h at 1200 °C. Subsequently pressed into pellets, which and sintered again for 12 h at 1200 °C. After grinding, the annealed powders are then pressed into disks and sintered at 1400 °C for 12 h with intermittent grinding and slow cooling in a furnace. The obtained disk-shaped samples are well grounded again, then pelletized and sintered at 1400 °C for 24 h. Finally, the sintered ceramic samples are slowly cooled to room temperature in air. As the sample have been elaborated in air, it is consequently stoichiometric in oxygen.26,27 The composite sample is made by thoroughly mixing 48%![[thin space (1/6-em)]](https://www.rsc.org/images/entities/char_2009.gif) :
:![[thin space (1/6-em)]](https://www.rsc.org/images/entities/char_2009.gif) 52% (by weight) of polycrystalline powders of La1.4Ca1.6Mn2O7 and La1.3Eu0.1Ca1.6Mn2O7 in an agate mortar for 30 min. The obtained compound will be referred as A0.48/B0.52. The samples are characterized using X-ray powder-diffraction measurements at room temperature in the 2θ range of 20° to 80° with CuKα radiation (λ = 1.5406 Å). The structural parameters are refined by Rietveld's profile-fitting method using Fullprof software. The temperature-dependence and the magnetic-field-dependence of the magnetization, M(T) and M(μ0H), are performed around the Curie temperature (TC) using vibrating sample magnetometer developed at NEEL Institute.
52% (by weight) of polycrystalline powders of La1.4Ca1.6Mn2O7 and La1.3Eu0.1Ca1.6Mn2O7 in an agate mortar for 30 min. The obtained compound will be referred as A0.48/B0.52. The samples are characterized using X-ray powder-diffraction measurements at room temperature in the 2θ range of 20° to 80° with CuKα radiation (λ = 1.5406 Å). The structural parameters are refined by Rietveld's profile-fitting method using Fullprof software. The temperature-dependence and the magnetic-field-dependence of the magnetization, M(T) and M(μ0H), are performed around the Curie temperature (TC) using vibrating sample magnetometer developed at NEEL Institute.
3. Results and discussions
The XRD patterns of La1.4Ca1.6Mn2O7 (A) and La1.3Eu0.1Ca1.6Mn2O7 (B) samples registered at 300 K and the structural refinement patterns showing the observed, calculated, and difference profiles for the final fit for the A and B samples, are depicted in Fig. 1(a) and (b). The phase identification and structural analysis of both samples are performed using the FullProf software.28,29 It is found that all diffraction peaks can be indexed with respect to Sr3Ti2O7-type perovskite with I4/mmm space group. As a La-bilayer-structured perovskite, these compounds are generally formed of the bilayers MnO2 (magnetic conducting layer) separated by a monolayer rock-salt-type (La, Ca)2O2 (non-magnetic insulating layer) along the c axis. Meanwhile, some small secondary phases attributed to the presence of CaO impurity with space group Fm![[3 with combining macron]](https://www.rsc.org/images/entities/char_0033_0304.gif) m and a fraction of with La0.67Ca0.33MnO3 type orthorhombic structure with space group Pbnm are observed in both samples. Both impurities are identified with X'Pert HighScore Plus software. For both compounds, the positions of the La1.4Ca1.6Mn2O7 for A sample (La1.3Eu0.1Ca1.6Mn2O7 for B sample), La0.67Ca0.33MnO3, and CaO peaks are denoted by the three sets of vertical bars (green color online), the top row corresponding to La1.4Sr1.6Mn2O7 (La1.3Eu0.1Ca1.6Mn2O7), etc. The Rietveld refinement of the XRD data indicates that the replacement of 10% lanthanum with europium in the system does not affect the tetragonal structure but causes a decrease in the cellular parameters a = b, c and the unit cell volume V. The lattice parameters of these compounds are found to be a = 3.870 Å, c = 19.302 Å and V = 289.059 Å3 for La1.4Ca1.6Mn2O7 (A) and a = 3.866 Å, c = 19.281 Å and V = 288.219 Å3 for La1.3Eu0.1Ca1.6Mn2O7 (B). The quality of the refinement is evaluated through the goodness of the fit indicator χ2, which is 1.32% for A sample and 1.43% for B sample. This confirms that the refinement is acceptable. The profile factor is found to be Rp = 19.3% (19.3%), weighed profile factor Rwp = 20.2% (20.6%) and Bragg R-factor RBragg = 7.57% (4.98%) for A sample (for B sample). The amounts of all phases present in the sample are quantified simultaneously using the Rietveld method. The phase quantification procedure involves the identification of major and minor phases. Here, quantitative phase analysis obtained by Rietveld refinement shows that the La1.4Ca1.6Mn2O7 (La1.3Eu0.1Ca1.6Mn2O7) is the dominant phase, constituting 89.7% (87.4%) of the weight. The La0.67Ca0.33MnO3 and the CaO phases account for only 6.1% (7.9%) and 4.2% (4.7%), respectively. The latter phase is frequently encountered after the final step of the synthesis of LaCa-bilayer manganites. Given the small concentration of the impurities, we assume that the secondary phase does not have any significant effect on the subsequent measurements of physical properties.
m and a fraction of with La0.67Ca0.33MnO3 type orthorhombic structure with space group Pbnm are observed in both samples. Both impurities are identified with X'Pert HighScore Plus software. For both compounds, the positions of the La1.4Ca1.6Mn2O7 for A sample (La1.3Eu0.1Ca1.6Mn2O7 for B sample), La0.67Ca0.33MnO3, and CaO peaks are denoted by the three sets of vertical bars (green color online), the top row corresponding to La1.4Sr1.6Mn2O7 (La1.3Eu0.1Ca1.6Mn2O7), etc. The Rietveld refinement of the XRD data indicates that the replacement of 10% lanthanum with europium in the system does not affect the tetragonal structure but causes a decrease in the cellular parameters a = b, c and the unit cell volume V. The lattice parameters of these compounds are found to be a = 3.870 Å, c = 19.302 Å and V = 289.059 Å3 for La1.4Ca1.6Mn2O7 (A) and a = 3.866 Å, c = 19.281 Å and V = 288.219 Å3 for La1.3Eu0.1Ca1.6Mn2O7 (B). The quality of the refinement is evaluated through the goodness of the fit indicator χ2, which is 1.32% for A sample and 1.43% for B sample. This confirms that the refinement is acceptable. The profile factor is found to be Rp = 19.3% (19.3%), weighed profile factor Rwp = 20.2% (20.6%) and Bragg R-factor RBragg = 7.57% (4.98%) for A sample (for B sample). The amounts of all phases present in the sample are quantified simultaneously using the Rietveld method. The phase quantification procedure involves the identification of major and minor phases. Here, quantitative phase analysis obtained by Rietveld refinement shows that the La1.4Ca1.6Mn2O7 (La1.3Eu0.1Ca1.6Mn2O7) is the dominant phase, constituting 89.7% (87.4%) of the weight. The La0.67Ca0.33MnO3 and the CaO phases account for only 6.1% (7.9%) and 4.2% (4.7%), respectively. The latter phase is frequently encountered after the final step of the synthesis of LaCa-bilayer manganites. Given the small concentration of the impurities, we assume that the secondary phase does not have any significant effect on the subsequent measurements of physical properties.
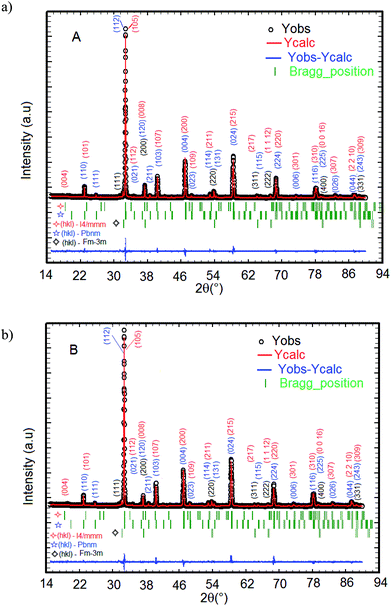 | ||
| Fig. 1 The XRD patterns for A and B samples performed at room temperature. (a) La1.4Ca1.6Mn2O7 and (b) La1.3Eu0.1Ca1.6Mn2O7. | ||
Fig. 2 depicts the temperature dependence of magnetization M(T) for both A and B samples under an applied magnetic field of 0.05 T in field cooled mode (FC). It is clear from Fig. 2 that the M(T) curves do not reveal secondary magnetic phases, which in turn suggests that the presence of small amount of impurities does not have any significant effect on the thermomagnetic properties. The M(T) curves show rapid decrease of magnetization at Curie temperature which is the signature of the transition from ferromagnetic to paramagnetic state.
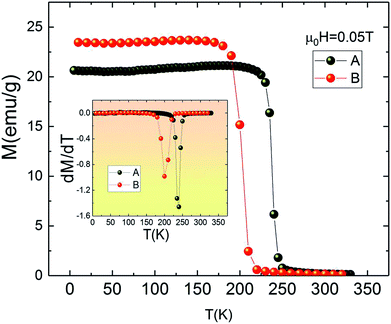 | ||
| Fig. 2 Magnetization measurements as a function of temperature for La1.4Ca1.6Mn2O7 and La1.3Eu0.1Ca1.6Mn2O7 samples under 0.05 T. Insets: dM/dT as a function of temperature. | ||
Furthermore, it can be seen from Fig. 2 that replacing La by Eu causes the value of TC to shift from 240 K for La1.4Ca1.6Mn2O7 (A) to 200 K for La1.3Eu0.1Ca1.6Mn2O7 (B). The Curie temperature TC is defined as the inflection point of dM/dT (see inset Fig. 2). It is clear that the pristine compound La1.4Ca1.6Mn2O7 is ferromagnetic below TC = 240 K. This value is higher than TC = 235 K given by ref. 30 and smaller than TC = 270 K observed in the same sample provided by ref. 31. This dissimilarity may be explained by the sensitivity of Curie temperature to the preparation conditions and the temperature of sintering32,33 which leads to the conclusion that the preparation processes have enormous impacts on the performance of magnetic materials.
Fig. 3(a) shows the magnetic hysteresis loops of both A and B samples taken at 10 K. Both loops show nearly zero coercivity, high magnetization saturation and negligible hysteresis which means that A and B bilayer manganites exhibit perfect magnetic reversibility or soft ferromagnetic nature. These observed outstanding soft-magnetic properties are beneficial for the application as bulk magnetic refrigerants. Furthermore, it can be seen that they display scarcely any hysteresis loss, although the two compounds exhibit the nature of first-order phase transition. This point is very attractive for magnetic refrigeration.
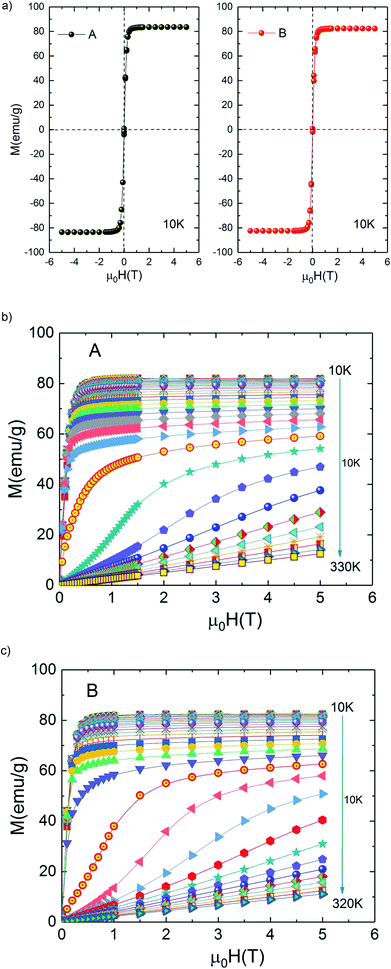 | ||
| Fig. 3 (a) Hysteresis loops for La1.4Ca1.6Mn2O7 and La1.3Eu0.1Ca1.6Mn2O7 samples at 10 K. Isothermal magnetization curves at various temperatures (b) La1.4Ca1.6Mn2O7 and (c) La1.3Eu0.1Ca1.6Mn2O7. | ||
Isothermal magnetization M(μ0H) curves are performed around transition temperature for each sample. Fig. 3(b) and (c) represents the recorded M(μ0H) curves of samples A and B over a wide range of the magnetic field ranging from 0 T to 5 T. At temperatures above 270 K for A sample (250 K for B sample) M(μ0H) curves show a linear behaviour as expected in the paramagnetic state. Below 220 K for A sample (190 K for B sample) M(μ0H) curves show an expected rapid increase at field values less than 0.4 T followed by the tendency to saturation at higher fields, which indicate the existence of a ferromagnetic state in the samples.
However, it can be clearly seen that the magnetization initially increases gradually with increasing μ0H for temperatures between 220 and 270 K for A sample (190 and 250 K for B sample). A sudden change appears above a critical magnetic field followed by a rapid increase of magnetization thus exhibiting an ‘S’ shaped M(μ0H) plot. This is a signature of a metamagnetic behaviour observed in the both samples. The latter phenomenon indicates the possibility of a large magnetic entropy change around Curie temperature. This point is very enticing for magnetic refrigeration. Motivated by our previous result of a large magnetocaloric effect (−ΔSM(T, μ0H) = 7.23 J kg−1 K−1 at 5 T (ref. 27)) observed in Pr0.8K0.2MnO3 sample which showed a similar metamagnetic behavior, we investigated the MCE in both aforementioned compounds.26
In the present work, it is interesting to evaluate the magnetocaloric effect of the A and B compounds. For this reason, we used the isothermal magnetisations measured at discrete temperatures to determine the MCE for each compound. Using Maxwell relation and magnetization curves (M–μ0H) we obtained the value of magnetic entropy changes ΔSM(T, μ0H) as a function of temperature in the magnetic field range of 0 to 5 T for both A and B samples. Fig. 4(a) and (b) depicts the behaviour of ΔSM(T, μ0H) for both compounds. The negative sign of the ΔSM(T, μ0H) seen in the latter figures is referred as the normal MCE and confirms the ferromagnetic nature of these samples.34–36 As one can see, the aforementioned materials illustrate significant values of the magnetic entropy changes and show that the magnitudes of ΔSM increases with an increase in the applied magnetic field. For μ0H = 5 T, the entropy change ΔSM exhibits a maximum value of 6.6 J kg−1 K−1 around Tpeak ∼ 245 K for A sample (6.25 J kg−1 K−1 around Tpeak ∼ 215 K for B sample) and it decreases on either side. However, the magnitude of ΔSM increases and the peak of ΔSM becomes asymmetrical with the rise of magnetic field. While ΔSM diminishes abruptly with lowering temperature below the peak, it gradually falls with the rise of temperature above the peak. We can also remark that ΔSM curves for the both samples present higher peak values and are quite similar in the temperature range of ΔT = TCA − TCB ≈ 40 K. Due to the remarkable similarities in the results, the two materials provide an opportunity to manufacture a composite with high performance in the context of magnetic refrigeration.
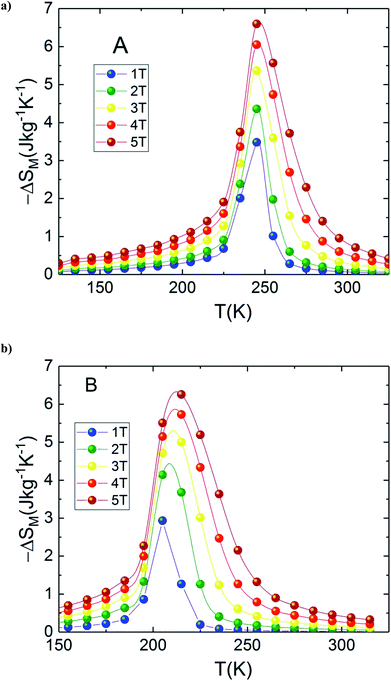 | ||
| Fig. 4 Magnetic entropy change, (ΔSM) vs. temperature for (a) La1.4Ca1.6Mn2O7 and (b) La1.3Eu0.1Ca1.6Mn2O7. | ||
In this context, magnetic properties for La1.4Ca1.6Mn2O7 (A) and La1.3Eu0.1Ca1.6Mn2O7 (B) are described in more detail by means of simulation of ΔSM(T, μ0H = 5 T) of individual compounds La1.4Ca1.6Mn2O7 (A) and La1.3Eu0.1Ca1.6Mn2O7 (B) (see Fig. 5(a)). A numerical method is used to determine the optimum mass ratios of x refrigerant samples and the resulting entropy change ΔSM(T, μ0H = 5 T) of the composite.37 Fig. 5(b) illustrates the numerical calculations for ΔSM(T, μ0H = 5 T) curves in the vicinity of the magnetic transition temperatures for the investigated materials and their composite. The ΔSM(T, x) for (La1.4Ca1.6Mn2O7)1−x/(La1.3Eu0.1Ca1.6Mn2O7)x composites produced by combining a (1 − x) × (La1.4Ca1.6Mn2O7) and a x × (La1.3Eu0.1Ca1.6Mn2O7) were obtained from their respective ΔSM(T) according to the following equation:
 | (1) |
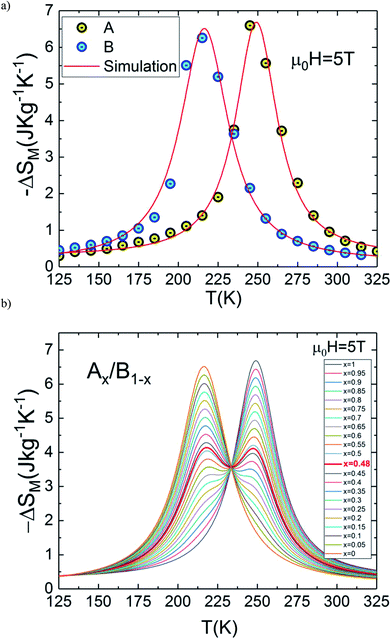 | ||
| Fig. 5 (a) ΔSM(T, μ0H = 5 T) for La1.4Ca1.6Mn2O7 and La1.3Eu0.1Ca1.6Mn2O7. (b) ΔSM(T) curves for the composite (La1.4Ca1.6Mn2O7)1−x/(La1.3Eu0.1Ca1.6Mn2O7)x for μ0H = 5 T. | ||
To explore the performance of this composite, we have calculated the refrigerant capacity (RC) which is another decisive parameter for evaluating and approving cooling efficiency.38 The RC parameter measures the amount of heat convey between the cold and hot reservoirs in the thermodynamic cycle. Thus, it has been suggested as a more suitable indicator of magnetic substances utility for solid-state refrigeration. For practical cooling systems, the RC with a broad temperature range is suitable for the active magnetic refrigeration cycle.39–41 The refrigerant capacity depends not only on the maximum of −ΔSM(T), but also on the overall profile of −ΔSM(T). RC is obtained by numerical integration of the area under the −ΔSM(T) curve. The limits of the temperature integration are set by the half-maximum of the ΔSM(T) peak, where THot and TCold correspond to the two temperatures at which the |ΔSM(T)| value is half of the peak value:42
 | (2) |
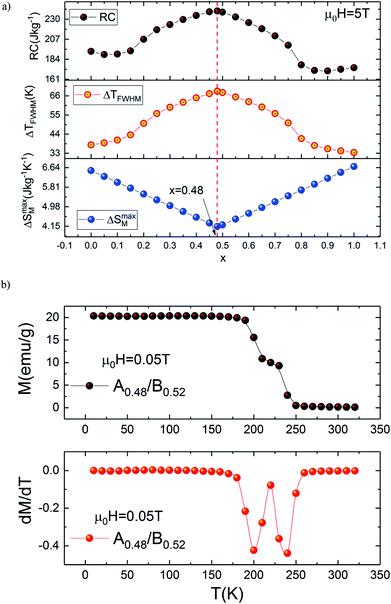
Accordingly, we report a detailed investigation of the MCE response as a function of the composite ratio; we present in Fig. 6(a) the x dependence of ΔSM, ΔTFWHM and the RC values for the composite system Ax/B1−x at μ0H = 5 T. This figure confirms that the important value of ΔTFWHM correspond to x = 0.48. The existence of the table-like behaviour could give rise to the maximum values of ΔTFWHM and RC, which allows the A0.48/B0.52 composite to become a promising compound for different thermodynamic cycles used in magnetic cooling technology.
Based on these calculations and in order to produce a composite with table-like MCE for a magnetic cooling system using the Ericsson thermodynamic cycle, powdered specimen of the La1.4Ca1.6Mn2O7–La1.3Eu0.1Ca1.6Mn2O7 composite is made by repetitive grinding and mixing of the two compositions in the desired ratio of 48–52% (A0.48/B0.52). After preparing the composite, the temperature (T) dependence of the magnetization (M) is measured in field-cooled mode (FC) under an applied field of 0.05 T. The results are depicted in Fig. 6(b) for our new compound. This curve clearly shows that the investigated composite specimen exhibits two magnetic transitions because of its heterogeneous composition. It is also observed in Fig. 6(b) that the pronounced two minima in the dM/dT versus T curve confirm that the composite contains two magnetic phase transitions compared with individual A and B bilayer manganites. The later successive minima correspond exactly to TC for each of the constituent phases A and B used to prepare the A0.48/B0.52 composite. It is worthwhile to mention that the magnetization magnitude of the studied composite shows a small decrease at low temperatures as compared with that of A and B bilayer manganites. The existence of two transition temperatures originating from different phases can certainly have an important effect on the MCE characteristics because the shape and behaviour of the magnetic entropy change are highly sensitive to the character of the magnetic phase transition.
It is demonstrated that the presence of two magnetic phases in the refrigerant material ensure that the material has a large MCE with a broad refrigeration temperature range and enhanced RC. In this investigation, we used the presence of two magnetic transitions to confirm our above calculation and for generating a broad range of MCE with a significant increase in RC.
To get deeper insight into the magnetocaloric response of the prepared composite upon changing the magnetic field from 0 to 5 T, isothermal magnetization curves of A0.48/B0.52 are measured as a function of the applied field recorded at different temperatures.
The measured M(μ0H) plots are shown in Fig. 7(a). In Fig. 7(b) we compare the selected isothermal M–μ0H curves plotted with applied fields between 0 and 5 T at T = 10, 220, 250 and 320 K for the individual samples and the A0.48/B0.52 composite. It is observed from this figure that the A0.48/B0.52 sample has similar values of magnetization at 10 K and 320 K as compared to A and B samples. In addition, the M(μ0H) curves are typical for a ferromagnetic state at 10 K and for a paramagnetic state at 320 K. On the other side, at 220 K and 250 K, the three compounds present different shapes in M(μ0H) and the composite system shows the intermediate values of magnetization compared to that of the constituent phases A and B. In this temperature range, the slightly jump in the M(μ0H) curves may be attributed to strong domain wall pinning in the ferromagnetic state.
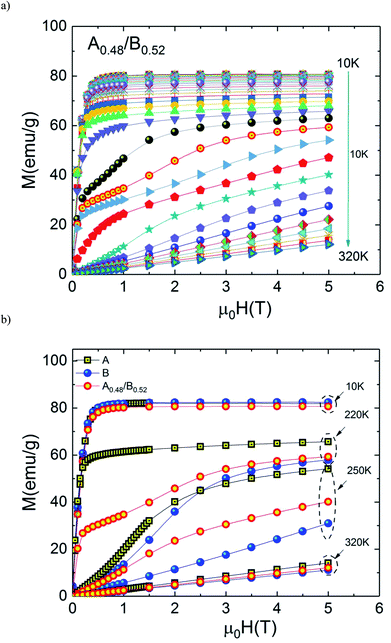 | ||
| Fig. 7 (a) Isothermal magnetization curves at various temperatures for the composite and (b) M(μ0H) at 10, 220, 250 and 320 for all samples. | ||
The temperature dependences of magnetic entropy changes, −ΔSM(T), taken at 1, 2, 3, 4 and 5 T for the A0.48/B0.52 composite is presented in Fig. 8(a). All the curves of −ΔSM(T) have a clear double-peak shape (two ΔSM values), resulting from the disparity in Curie temperature of both phases A and B. The latter double-peak shape is very noticeable at low μ0H and begins to flatten gradually in favor of the table-like behaviour occurring at higher magnetic fields. This behaviour could give rise to the maximum values of ΔTFWHM and the RC refrigerant capacity strongly required for the ideal Ericsson cycle magnetic refrigeration over a broad temperature range.43
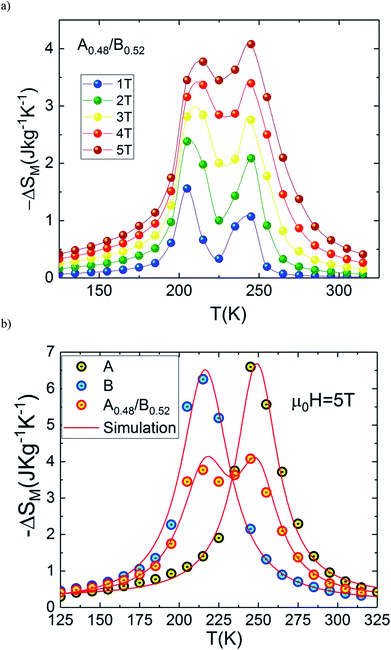 | ||
| Fig. 8 (a) Magnetic entropy change, ΔSM vs. temperature for the composite system and (b) comparison between experimental and simulation. | ||
Fig. 8(b) depicts experimental and theoretical entropy change curves for μ0H = 5 T of phases A and B that make up the composite with TC,A = 200 K and TC,B = 240 K, along with ΔSM(T) in the composite x = 0.48. Latest figure demonstrates that the agreement between the experimental curves ΔSM(T) and that predicted by eqn (1) is excellent. According to this agreement, we can conclude that the numerical calculations are valid in the choice of MCE composite and can thus be used as means of designing magnetic refrigerant materials with an improved magnetocaloric response for the desired magnetic fields. The maximum value of −ΔSM(T) is found to be 4.07 J kg−1 K−1 for A0.48/B0.52 in a wide temperature range. The magnitude of −ΔSM(T) is reduced in the A0.48/B0.52 composite which gives a broad table-like behaviour with a wide temperature range compared to that of the pure constituent phases. Basically, in an ideal Ericsson cycle, the entropy conveyed between two heat reservoirs (THot and Tcold) should be as constant as possible to avoid the generation of irreversible work.44 For this reason, the flattening of −ΔSM(T, x = 0.48) curve can be able to meet the latter requirements for the use of A0.48/B0.52 as a composite for Ericsson-cycle-based magnetic refrigerators.43
From eqn (2), the obtained value of RC is ∼205.92 J kg−1 at 5 T in B sample while it does not exceed ∼178.92 J kg−1 in A sample which indicate that the Eu-substitution increase the refrigerant capacity. Fig. 9(a) shows ΔSmaxM, ΔTFWHM and RC plots as a function of the applied magnetic field. As displayed in Fig. 9(b), the obtained values of ΔSmaxM, ΔTFWHM and RC are strongly related to the magnetic field. It is clearly observed that the A material has smaller values of ΔTFWHM than the B sample. Compared to gadolinium, which is considered as the typical ferromagnetic material for magnetic refrigeration, the RC values of the A and the B samples represents about ∼56.13% and ∼64.6% of the RC estimated for Gd (the value of RC is around 25% lower than that of the relative refrigerant capacity RCP for the ΔSM(T),42 from ref. 45 RCPGd = 425 J kg−1 then RCGd = ¾ × RCPGd = ¾ × 425 ∼ 319 J kg−1). According to the obtained result, the Eu-doped sample is still valuable for magnetic refrigeration at low temperatures. These values are much larger than that of several manganites46,47 and are high enough for magnetic cooling. Refrigerants with wide working temperatures and high RC are in fact very beneficial to magnetic cooling applications48 and suggests that compounds can thus be used as an active magnetic refrigeration materials suggested by Barclay.39 However, in this case the maximum values of ΔTTFWHM for all three samples A, B and A0.48/B0.52 are equal to ∼35.7 K, ∼41.54 K and ∼68.16 K respectively for a field of 5 T. It can be observed that the highest value of ΔTTFWHM is revealed for the A0.48/B0.52 composite and an increment of ∼47.63% and ∼39.05% in ΔTFWHM compared with the individual La1.4Ca1.6Mn2O7 and La1.3Eu0.1Ca1.6Mn2O7 samples are observed. This enhancement in ΔTFWHM is an outcome of the augmentation of RC despite the diminution of the maximum value of ΔSM. However, it follows that a compromise is necessary between the value of the ΔTFWHM and the energy losses and the efficiency of machine (due to an increase of cycles in the heat exchange medium). The investigated A0.48/B0.52 composite exhibit nearly constant value of ΔSM(T) with width of ∼68.16 K. The present results confirm that the field and the temperature range used in the numerical calculation are analogous to those explored experimentally and ensure that the large ΔTFWHM observed in the prepared composite have a great importance for cooling capacity.
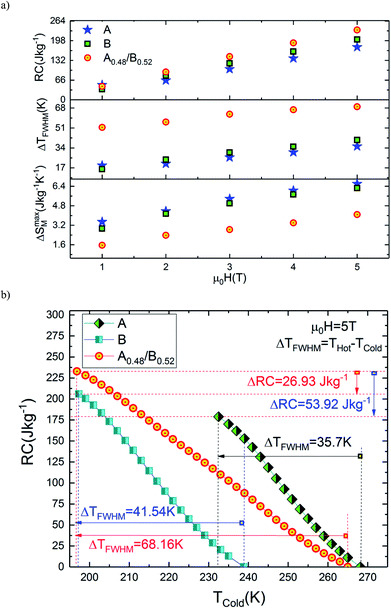 | ||
| Fig. 9 (a) Variation of ΔSmaxM, ΔTFWHM and RC with magnetic field for all samples. (b) RC versus Tcold for all samples. | ||
The broadening width of ΔSM(T) is expected to make an increase of RC in the composite as predicted by eqn (2). In this study, it should be noted that the used TCold and THot are defined as temperatures fulfilling ΔSM(TCold) = ΔSM(THot) = ΔSmaxM/2. In order to visualize RC (TCold) and obtain the RC values at different values of TCold, the integrand is evaluated from high temperature (THot) to low temperature (TCold) as depicted in eqn (2). Fig. 9(b) shows the calculated values of RC as a function of TCold under 5 T magnetic field of A, B and A0.48/B0.52 compounds. It is found that the RC increases as TCold is separate from the ΔSM peak temperature (Tpeak), at which RC is zero due to eqn (2). In the temperature span of THot − TCold = ΔTFWHM, the estimated RC values correspond to A, B and A0.48/B0.52 samples are 178.92 J kg−1, 205.92 J kg−1 and 232.85 J kg−1 respectively. These values show that the RC of the composite A0.48/B0.52 is improved by 23.16% and 11.56% when compared with those of A and B samples. This proves the superior cooling power of the A0.48/B0.52 sample and refers to a possible way to optimize RC of refrigerant magnetic materials. This result reveals that the A0.48/B0.52 is a promising compound to be used as a refrigerant material in solid-state refrigeration with the Ericsson cycle. Similar reinforcement in RC responses are observed in many composite systems like La1.4Ca1.6Mn2O7/(La0.08Gd0.02)1.4Ca1.6Mn2O7,49 FeZrB(Cu),50 and La0.7Ca0.3Mn16O3/La0.7Ca0.3Mn18O3.51
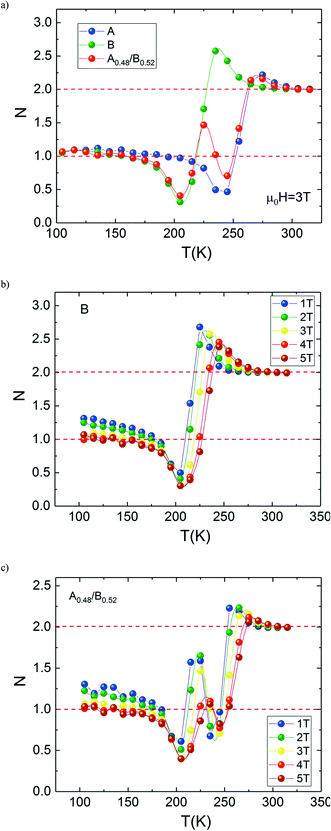
To make our analysis more complete, we are concerned with the nature of the magnetic phase transition in our bilayer manganites. For that reason, we have investigated the field dependence of MCE in A, B and A0.48/B0.52 samples by using the relation expressed as ΔSM ≈ a(μ0H)N. The latter relationship makes it possible to determine the nature of the magnetic phase transition observed in the aforementioned samples. Recently, J. Y. Law et al. proposed a quantitative criterion to identify the order of magnetic phase transitions using the field dependence of magnetocaloric effect. For materials with the first-order magnetic phase transition (FOPT), ΔSM depends on the field with exponent N > 2.52 Particularly, for magnetic samples, the local exponent N(T,μ0H) can be calculated from the logarithmic derivative of the experimental ΔSM(T, μ0H):53
 | (3) |
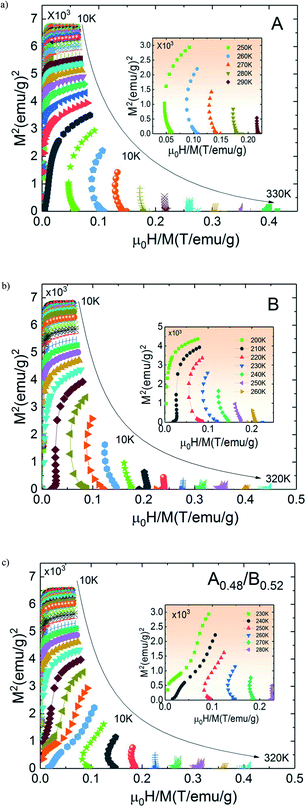
The temperature dependence of N is illustrated in Fig. 10(a) for A, B and A0.48/B0.52 samples. The exponent N, for A and B samples has a minimum value at TC. However, for A0.48/B0.52, the N(T) curves exhibits two minima whose positions are related to the critical temperatures of the existing phases (A and B) in this composite. On the one hand, it is observed in Fig. 10 that the exponent N is sensitive to the magnetic field in the entire studied temperature range and the magnetic entropy changes, ΔSM. The value of N(TC) < 0.4 at high magnetic fields indicates that our samples undergo first order magnetic transition temperature.54,55 In the other hand and under critical temperatures, the N(T) curves increase gradually with the temperature drop and approaches 1 for higher magnetic fields. Far above TC, the N(T) values overshoots 2 (N > 2) in the paramagnetic region (near magnetic transitions) of all three samples. This overshoot is more pronounced in sample B compared to sample A and the composite A0.48/B0.52. The observed behaviour shows that the quantitative criterion of N > 2 near the transition is valid for monophasic and biphasic materials which indicates that our samples exhibit a first-order transition. This is in agreement with the previous observations in N(TC) values. A similar behaviour is reported in other magnetic materials with first-order transition.56 However, the order of magnetic phase transition is usually revealed by the Arrott plots (M2 vs. H/M). For more confirmation of the nature of the magnetic phase transition of A, B and A0.48/A0.52 samples, the curves of M2 vs. H/M plotted at different temperatures are exhibited in Fig. 11. The Arrott plots for the aforementioned materials just above the respective TC are displayed in the inset of the Fig. 11. According to the Banerjee criterion, the obviously negative slopes of Arrott plots verify the first-order nature of the three samples,57,58 which is consistent with the quantitative criterion.
4. Conclusion
In summary, we have first investigated the structural, magnetic and magnetocaloric properties of La1.4Ca1.6Mn2O7 and La1.3Eu0.1Ca1.6Mn2O7 samples prepared by the standard solid-state reaction method. The magnetic study showed that our investigated samples exhibit a PM–FM transition and present large magnetocaloric properties. Secondly, we have prepared a composite using the aforementioned samples with weight ratio of 48–52%. The latter ratio is determined numerically to obtained high magnetocaloric performances. Compared with the main polycrystalline phases, the magnetic entropy change of the prepared composite was found to be smaller. The prepared composite is characterized by important values of ΔTFWHM (68.16 K under 5 T) and RC (232.85 J kg−1 under 5 T). The refrigeration capacity of the composite is enhanced by 23.16% and 11.56% when compared with those of the individual La1.4Ca1.6Mn2O7 and La1.3Eu0.1Ca1.6Mn2O7 samples. Hence, the results of the A0.48/B0.52 composite represent a significant motivation to search for new suitable magnetic material with several reversible magnetic transitions originating from two different phases in order to expand working temperature with the same sign of successive magnetic entropy changes. These observations corroborate that the magnetic refrigerant compound with the more competitive characteristics may be developed in a form of a composite material that can lead to a future cheaper, more efficient and green refrigerator. In addition, our magnetocaloric investigation shows that the first order phase transition is observed on our compounds. We showed that using the field dependence of magnetocaloric effect, the order of the phase transition can be unambiguously determined using a quantitative criterion even for N > 2 near the transition of monophasic and biphasic magnetocaloric materials. The order of the magnetic phase transition of the three samples is corroborate by using the Banerjee criterion.Conflicts of interest
There are no conflicts of interest to declare.Acknowledgements
The authors would like to acknowledge the support of the National Center for Scientific Research (CNRS) (Contract No.: 707925 Agent No.: 162577 No. INSEE: 1 83 01 99 993 519) which is part of the French Council for Strategic Research and the Neel Institute.References
- M. H. Phan, S. B. Tian, D. Q. Hoang, S. C. Yu, C. Nguyen and A. N. Ulyanov, Large magnetic-entropy change above 300 K in CMR materials, J. Magn. Magn. Mater., 2008, 258, 309–311 Search PubMed.
- S. Jin, T. H. Tiefel, M. McCormack, R. A. Fastnacht, R. Ramesh and L. H. Chen, Thousandfold change in resistivity in magnetoresistive La-Ca-Mn-O films, Science, 1994, 264, 413–415 CrossRef CAS PubMed.
- M.-H. Phan and S.-C. Yu, Review of the magnetocaloric effect in manganite materials, J. Magn. Magn. Mater., 2007, 308, 325 CrossRef CAS.
- R. M'nassri, M. Khelifi, H. Rahmouni, A. Selmi, K. Khirouni, N. Chniba-Boudjada and A. Cheikhrouhou, Study of physical properties of cobalt substituted Pr0.7Ca0.3MnO3 ceramics, Ceram. Int., 2016, 42, 6145–6153 CrossRef.
- S. Choura-Maatar, R. M'nassri, W. Cheikhrouhou-Koubaa, M. Koubaa, A. Cheikhrouhou and E. K. Hlil, Sodium – deficiency effects on the structural, magnetic and magnetocaloric properties of La0.8Na0.2−xxMnO3 (0 ≤ x ≤ 0.15), J. Magn. Magn. Mater., 2017, 433, 239–247 CrossRef CAS.
- E. Brück, Developments in magnetocaloric refrigeration, J. Phys. D: Appl. Phys., 2005, 38, R381 CrossRef.
- K. A. Gschneidner Jr, V. K. Pecharsky and A. O. Tsokol, Recent developments in magnetocaloric materials, Rep. Prog. Phys., 2005, 68, 1479 CrossRef.
- H. B. Callen, Thermodynamics, Wiley, New York, 1981, ch. 14 Search PubMed.
- C. Zimm, A. Jastrab, A. Sternberg, V. Pecharsky, K. Gschneidner, M. Osborne and I. Anderson, Description and performance of a near-room temperature magnetic refrigerator, Adv. Cryog. Eng., 1998, 43, 1759–1766 Search PubMed.
- A. M. Tishin and Y. I. Spichkin, The Magnetocaloric Effect and its Applications, Institute of Physics Publishing, Bristol, 2003 Search PubMed.
- A. Sakka, R. M'nassri, N. Chniba-Boudjada, M. Ommezzine and A. Cheikhrouhou, Effect of trivalent rare earth doping on magnetic and magnetocaloric properties of Pr0.5(Ce,Eu,Y)0.1Sr0.4MnO3 manganites, Appl. Phys. A, 2016, 122(6), 603 CrossRef.
- H. Zhu, H. Song and Y. H. Zhang, Magnetocaloric effect in layered perovskite manganese oxide La1.4Sr1.6Mn2O7, Appl. Phys. Lett., 2002, 81, 3416 CrossRef CAS.
- L. Han, J. Yang, H. Yang, T. Zhang and C. Chen, Structural and magnetocaloric properties of bilayered manganite Nd1.4Sr1.6Mn2O7, J. Alloys Compd., 2017, 695, 1854–1858 CrossRef CAS.
- Y. Ma, Q. Y. Dong, Y. J. Ke, Y. D. Wu, X. Q. Zhang, L. C. Wang, B. G. Shen, J. R. Sun and Z. H. Cheng, Eu doping-induced enhancement of magnetocaloric effect in manganite La1.4Ca1.6Mn2O7, Solid State Commun., 2015, 208, 25–28 CrossRef CAS.
- H. Zhu, X. Liu, K. Ruan and Y. Zhang, Magnetic inhomogeneity and variable-range hopping transport at temperatures above the ferromagnetic transition in La1.4Sr1.6Mn2−yTiyO7 system, Phys. Rev. B: Condens. Matter Mater. Phys., 2002, 65, 104424 CrossRef.
- M. Zhou, H. Y. Wu, H. J. Wang, L. Zheng, J. J. Zhao, R. Xing and Y. Lu, Influence of Tb substitution for La on the structure, magnetic and magneto-transport properties of La1.2Sr1.8Mn2O7, Phys. B, 2012, 407, 2219 CrossRef CAS.
- W. Zhong, X. S. Liu, H. Y. Jiang, L. J. Zhao, Y. W. Du and N. Zhang, Synthesis and the magnetoresistance effect of layered-perovskite La2.5−xK0.5+xMn2O7+δ (0 < x < 0.5) polycrystals, Appl. Phys. A, 2004, 78, 575 CrossRef CAS.
- C. Zener, Interaction between the d-Shells in the Transition Metals. II. Ferromagnetic Compounds of Manganese with Perovskite Structure, Phys. Rev., 1951, 82, 403 CrossRef CAS.
- J. B. Goodenough, Theory of the Role of Covalence in the Perovskite-Type Manganites [La, M(II)]MnO3, Phys. Rev., 1955, 100, 564 CrossRef CAS.
- P. W. Anderson and H. Hasegawa, Considerations on double exchange, Phys. Rev., 1955, 100, 675 CrossRef CAS.
- A. Smaıli and R. Chahine, Composite magnetic refrigerants for an Ericsson cycle: new method of selection using a numerical approach, Adv. Cryog. Eng., 1996, 42, 445 Search PubMed.
- R. Caballero-Flores, V. Franco, A. Conde, K. E. Knipling and M. A. Willard, Optimization of the refrigerant capacity in multiphase magnetocaloric materials, Appl. Phys. Lett., 2011, 98, 102505 CrossRef.
- R. M'nassri, Searching the conditions for a table-like shape of the magnetic entropy in the magnetocaloric LBMO2.98/LBMO2.95 composite, Eur. Phys. J. Plus, 2016, 131(11), 392 CrossRef.
- R. M'nassri, Table-like magnetocaloric effect involving the enhancement of refrigerant capacity in (AMn0.9Ti0.1O3)1−x/(AMn0.85Ti0.15O3)x composite, Phase Transitions, 2016, 90, 687–694 CrossRef.
- R. M'nassri, Enhancement of Refrigeration Capacity and Table-Like Magnetocaloric Effect in LaFe10.7Co0.8Si1.5/La0.6Pr0.4Fe10.7Co0.8Si1.5 Composite, J. Supercond. Novel Magn., 2015, 29, 207–213 CrossRef.
- J. H. Kuo, H. U. Anderson and D. M. Sparlin, Oxidation-reduction behavior of undoped and Sr-doped LaMnO3 nonstoichiometry and defect structure, J. Solid State Chem., 1989, 83(1), 52–60 CrossRef CAS.
- H. Ben Khlifa, R. M'nassri, W. Cheikhrouhou-Koubaa, E. K. Hlil and A. Cheikhrouhou, Effects of synthesis route on the structural, magnetic and magnetocaloric properties of Pr0.8K0.2MnO3, Ceram. Int., 2017, 43(2), 1853–1861 CrossRef CAS.
- H. M. Rietveld, A profile refinement method for nuclear and magnetic structures, J. Appl. Crystallogr., 1969, 2, 65 CrossRef CAS.
- T. Roisnel and J. Rodriguez-Carvajal, Computer ProgramFULLPROF, LLB-LCSIM, 2003 Search PubMed.
- Y. Ma, Q. Y. Dong, Y. J. Ke, Y. D. Wu, X. Q. Zhang, L. C. Wang, B. G. Shen, J. R. Sun and Z. H. Cheng, Eu doping-induced enhancement of magnetocaloric effect in manganite La1.4Ca1.6Mn2O7, Solid State Commun., 2015, 208, 25–28 CrossRef CAS.
- H. Zhu, H. Song and Y. H. Zhang, Magnetocaloric effect in layered perovskite manganese oxide La1.4Ca1.6Mn2O7, Appl. Phys. Lett., 2002, 3416, 3416 CrossRef.
- J. Makni-Chakroun, R. M'nassri, W. Cheikhrouhou-Koubaa, M. Koubaa, N. Chniba-Boudjada and A. Cheikhrouhou, Effect of A-site deficiency on investigation of structural, magnetic and magnetocaloric behaviors for (LaSr)-lacunar manganites, Chem. Phys. Lett., 2018, 707, 61–70 CrossRef CAS.
- R. M'nassri, N. C. Boudjada and A. Cheikhrouhou, Impact of Sintering Temperature on the Magnetic and Magnetocaloric Properties in Pr0.5Eu0.1Sr0.4MnO3 Manganites, J. Alloys Compd., 2015, 626, 20 CrossRef.
- M. H. Phan, N. A. Frey, M. Angst, J. de Groot, B. C. Sales, D. G. Mandrus and H. Srikanth, Complex magnetic phases in LuFe2O4, Solid State Commun., 2010, 150, 341 CrossRef CAS.
- A. Bettaibi, R. M'nassri, A. Selmi, H. Rahmouni, N. Chniba-Boudjada, A. Cheikhrouhou and K. Khirouni, Effect of chromium concentration on the structural, magnetic and electrical properties of praseodymium-calcium manganite, J. Alloys Compd., 2015, 650, 268 CrossRef CAS.
- J. Shen, B. Gao, Q.-Y. Dong, Y.-X. Li, F.-X. Hu, J.-R. Sun and B.-G. Shen, Magnetocaloric effect in La1−xPrxFe10.7 Co0.8 Si1.5 compounds near room temperature, J. Phys. D: Appl. Phys., 2008, 41, 245005 CrossRef.
- A. Smaili and R. Chahine, Thermodynamic investigations of optimum active magnetic regenerators, Cryogenics, 1998, 38, 247 CrossRef CAS.
- P. Gorria, J. L. Sánchez Llamazares, P. Álvarez, M. J. Pérez, J. Sánchez Marcos and J. A. Blanco, Relative cooling power enhancement in magneto-caloric nanostructured Pr2Fe17, J. Phys. D: Appl. Phys., 2008, 41, 192003 CrossRef.
- J. A. Barclay, Active and passive magnetic regenerators in gas/magnetic refrigerator, J. Alloys Compd., 1994, 207–208, 355 CrossRef CAS.
- R. M'nassri, N. Chniba Boudjada and A. Cheikhrouhou, 3D-Ising ferromagnetic characteristics and magnetocaloric study in Pr0.4Eu0.2Sr0.4MnO3 manganite, J. Alloys Compd., 2015, 640, 183 CrossRef.
- A. Selmi, R. M'nassri, W. Cheikhrouhou-Koubaa, N. Chniba Boudjada and A. Cheikhrouhou, Effects of partial Mn-substitution on magnetic and magnetocaloric properties in Pr0.7Ca0.3Mn0.95X0.05O3 (Cr, Ni, Co and Fe) manganites, J. Alloys Compd., 2015, 619, 627–633 CrossRef CAS.
- L.-W. Li, Review of magnetic properties and magnetocaloric effect in the intermetallic compounds of rare earth with low boiling point metals, Chin. Phys. B, 2016, 25(3), 037502 CrossRef.
- R. M'nassri, N. ChnibaBoudjada and A. Cheikhrouhou, Nearly constant magnetic entropy change involving the enhancement of refrigerant capacity in (La0.6Ba0.2Sr 0.2MnO3)1−x/(Co2O3)x composite, Ceram. Int., 2016, 42, 7447 CrossRef.
- H. Takeya, V. K. Pecharsky, K. A. Gschneidner and J. O. Moorman, New type of magnetocaloric effect: Implications on low-temperature magnetic refrigeration using an Ericsson cycle, Appl. Phys. Lett., 1994, 64, 2739 CrossRef CAS.
- K. A. Gschneidner Jr and V. K. Pecharsky, Magnetocaloric Materials, Annu. Rev. Mater. Sci., 2000, 30, 387 CrossRef.
- S. Hcini, M. Boudard, S. Zemni and M. Oumezzine, Effect of Fe-doping on structural, magnetic and magnetocaloric properties of Nd0.67Ba0.33Mn1−xFexO3 manganites, Ceram. Int., 2014, 40, 16041–16050 CrossRef CAS.
- A. Bettaibi, R. M'nassri, A. Selmi, H. Rahmouni, K. Khirouni, N. C. Boudjada and A. Cheikhrouhou, Effect of small quantity of chromium on the electrical, magnetic and magnetocaloric properties of Pr0. 7Ca0. 3Mn0. 98Cr0. 02O3 manganite, Appl. Phys. A, 2016, 122(3), 1–6 CrossRef CAS.
- V. K Pecharsky and K. A. Gschneidner Jr, Giant Magnetocaloric Effect in Gd5(Si2Ge 2), Phys. Rev. Lett., 1997, 78, 4494 CrossRef.
- J. J. Wang, Z. D. Han, Q. Tao, B. Qian, P. Zhang and X. F. Jiang, Constant magnetothermal response in two-layered perovskite (La1−xGdx)1.4Ca1.6Mn2O7, Phys. B, 2013, 416, 76–80 CrossRef CAS.
- P. Alvarez, J. L. Sanchez, L. lamazares, P. Gorria and J. A. Blanco, Enhanced refrigerant capacity and magnetic entropy flattening using a two-amorphous FeZrB(Cu) composite, Appl. Phys. Lett., 2011, 99, 232501 CrossRef.
- A. M. Aliev, A. G. Gamzatov, K. I. Kamilov, A. R. Kaul and N. A. Babushkina, Magnetocaloric properties of La0.7Ca0.3Mn16O3 and La0.7Ca0.3Mn18O3 manganites and their “sandwich”, Appl. Phys. Lett., 2012, 101, 172401 CrossRef.
- J. Y. Law, V. Franco, L. M. Moreno-Ramirez, A. Conde, D. Y. Karpenkov, I. Radulov, K. P. Skokov and O. Gutfleisch, A quantitative criterion for determining the order of magnetic phase transitions using the magnetocaloric effect, Nat. Commun., 2018, 9, 2680 CrossRef PubMed.
- V. Franco, J. S. Blázquez and A. Conde, The influence of Co addition on the magnetocaloric effect of Nanoperm-type amorphous alloys, Appl. Phys. Lett., 2006, 100, 064307 Search PubMed.
- K. Huang, Statistical Mechanics, John Wiley & Sons, 2nd edn, 1987 Search PubMed.
- L. M. Moreno-Ramírez, C. Romero-Muñiz, J. Y. Law, V. Franco, A. CondeaIliy, A. Radulov, F. M. Konstantin, P. Skokovc and O. Gutfleischc, The role of Ni in modifying the order of the phase transition of La(Fe,Ni,Si)13, Acta Mater., 2018, 160, 137–146 CrossRef.
- L. M. Moreno-Ramírez, C. R. Muñiz, J. Y. Law, V. Franco, A. CondeaIliy, A. Radulov, F. M. Konstantin, P. Skokov and O. Gutfleisch, The role of Ni in modifying the order of the phase transition of La(Fe,Ni,Si)13, Acta Mater., 2018, 160, 137–146 CrossRef.
- B. K. Banerjee, On a generalised approach to first and second order magnetic transitions, Appl. Phys. Lett., 1964, 12, 16 CrossRef.
- B. R. Dahal, K. Schroeder, M. M. Allyn, R. J. Tackett, Y. Huh and P. Kharel, Near-room-temperature magnetocaloric properties of La1−xSrxMnO3 (x = 0.11, 0.17, and 0.19) nanoparticles, Mater. Res. Express, 2018, 5, 106103 CrossRef.
| This journal is © The Royal Society of Chemistry 2019 |

