DOI:
10.1039/C9RA01118H
(Paper)
RSC Adv., 2019,
9, 10670-10678
Temperature and initial composition dependence of pattern formation and dynamic behavior in phase separation under deep-quenched conditions
Received
13th February 2019
, Accepted 23rd March 2019
First published on 5th April 2019
Abstract
Phase separation of SCN-H2O ([CH2CN]2–H2O) transparent solutions is simulated in two dimensions and the effects of quenching temperature and initial composition on the pattern formation and dynamic behavior of the second phase are examined via Minkowski functionals. The simulation is based on model H where the molar free energy of the SCN-H2O solution is obtained by the CALPHAD approach. We find that the composition and temperature do not affect the exponent in the domain growth law, where the average domain size with time yields R(t)–tn. However, they influence the pattern formation and dynamic behavior of the second phase in phase separation. Lower temperature leads to a finer bicontinuous structure in spinodal decomposition and promotes the nucleation rate, which accelerates the phase separation and results in more liquid droplets with smaller size. As the initial composition diverges from the critical value, the spatial patterns change gradually from bicontinuous into a droplet-like structure. When the initial composition is closer to the critical value, for spinodal decomposition, the diffusion-driven growth lasts for a longer time and the average domain size of liquid droplets is larger. For nucleation-driven growth, in contrast, the single phase separates more quickly and the average size of liquid droplets is smaller.
1 Introduction
Liquid–liquid phase separation exists widely in binary alloys, colloids, polymer solutions, and other condensed matter.1–4 When an initially homogeneous single-phase mixture is quenched inside the miscibility gap, it separates into two coexisting phases via nucleation-growth (NG) or spinodal decomposition (SD). NG is an activated process, which needs to overcome a free energy barrier. The concentration of the nucleated phase changes abruptly from that of the matrix in a localized area, then spherical droplets form and grow gradually. In contrast, SD occurs spontaneously when the system is in the unstable state, where any slight concentration fluctuation causes the free energy of the system to decrease. The concentration of the separated phase changes gradually by up-hill diffusion throughout the whole system and the bicontinuous structure forms at an early stage. Then the structure breaks up due to the surface tension and evolves slowly into numerous spherical droplets.
Most experiments and simulations on phase separation via SD have focused on the growth law5–8 where the average domain size R(t) grows time-dependently as tn. In the early stage, diffusion is the main mechanism of solute transport, leading to n = 1/3, whereas when domain growth is dominated by convection-driven coalescence at later stages, n equals 1. As time passes further, there is also a crossover from n = 1 to n = 2/3 when the fluid inertia is no longer negligible compared to viscosity.9,10 It is also found that the exponent n seems to be influenced by the viscosity of the fluid, such that n = 2/3 for low viscosities, n = 1/2 for intermediate values, and n = 1/3 for high viscosities.9,11–13 Although the scaling law for SD has been discussed, those studies have mainly focused on systems with a critical composition near the binodal temperature. This raises several questions: (1) when the quenching depth is large and the system is far from an equilibrium state, would the exponent n change? (2) The patterns of SD usually present a bicontinuous structure near the critical temperature. What is the effect of quenching temperature on variations in structure, which is hard to observe directly in experiments? (3) SD can also occur at off-critical compositions if the system is quenched into the unstable region. In this case, the volume fraction of the second phase would be smaller compared with that in the critical composition. How does this influence the domain growth and patterns of the system?
In systems far from the critical composition near the binodal temperature, phase separation proceeds via NG. In this case, Lifshitz and Slyozov (LS)14 also derived a t1/3 growth law, in which the physical mechanism is the evaporation of material from small droplets and condensation onto larger droplets, called Ostwald ripening.15,16 Clearly, the LS theory only describes the coarsening process in the later stage of NG. The domain growth law in the early stage, where all of the droplets continue to grow by diffusion, has received little attention, let alone the differences between systems with different compositions and temperatures. Moreover, according to the classical nucleation theory,17,18 lowering the temperature could promote the nucleation rate and accelerate the phase separation. However, the effect of initial composition on nucleation rate is also unclear.
In this paper, the effects of temperature and initial composition on phase separation will be investigated and the pattern formation and growth laws at large quenching depth will be determined. Since the time evolution of the patterns and domain growth in phase separation in the very early stage are hard to observe and measure directly by experiments, a computational approach is adopted. The transparent SCN-H2O solution19,20 is chosen as the research object as its physical parameters are fully known. The model H21–24 is applied to solutions with different compositions and quenching temperatures. Via Minkowski functionals,11,13,25 which are introduced in Section 2, the differences in phase separation under different conditions will be examined by the quantitative measurement of morphological characteristics to determine patterns of phase separation. We will also define conveniently the mean domain size R(t) to measure the kinetic characteristics of the second phase through Minkowski functionals.
2 Numerical methods
2.1 Governing equations in model H
For phase separation in a binary solution, the separated phases can be clearly distinguished by their solute concentration. Thus, we adopt the concentration of H2O, c(r,t), as the order parameter of the phase field. According to the gradient thermodynamics,21,26 the total free energy, including contributions from non-uniformities of such binary fluids, can be described as:| |
 | (1) |
where g(c,∇c,T) represents the free energy density, T the temperature, ∇c the concentration gradient, κ the gradient energy coefficient related to interfacial tension, Vm the molar volume of the liquid, and f(c,T) the molar Gibbs free energy.
Usually, the regular solution model11,16,27 is adopted to determine f(c,T), in which the binodal line is symmetric about 0.5. However, real fluid mixtures, such as the SCN-H2O solution whose phase diagram20 is shown in Fig. 1, break the symmetry of the miscibility curve, and the critical composition no longer equals 0.5. This means the regular solution model may not accurately describe the phase separation in the SCN-H2O system. Therefore, to facilitate comparison with experiments, we adopt the results from the CALPHAD approach, in which the liquid phase is modeled as a sub-regular solution and the molar Gibbs energy can be expressed as28,29
| |
 | (2) |
where
R is the gas constant,
gi the molar Gibbs energy of the pure substance i,
ci and
cj denote the concentrations of pure substances i and j,

is the
kth binary interaction parameter between i and j and depends on the temperature as a function of
A +
BT, in which
A and
B are model parameters. For the SCN-H
2O system,

are given as follows (
k = 0, 1, 2, 3)
28| |
 | (3) |
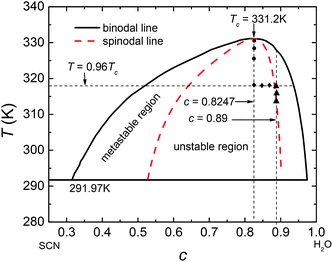 |
| | Fig. 1 Phase diagram of SCN-H2O solution where c represents the concentration of H2O. The dash curve is the spinodal line. | |
To describe the process of phase separation in the liquid state, an additional convection term, ∇(cv), is introduced into the Cahn–Hilliard (C–H) equation:21,23,27
| |
 | (4) |
where
v is velocity and
M is the chemical mobility given by
| |
 | (5) |
where
D is the chemical diffusivity. The factor
c(1 −
c) is assumed to be a constant given by
c0(1 −
c0), where
c0 is the initial composition of the system. The chemical potential
μ can be calculated as
26| |
 | (6) |
An incompressible, viscous system is considered and the mass density is assumed to be independent of composition and phases. Therefore, a general set of Navier–Stokes (N–S) equations in two dimensions can be written as:21
| |
 | (8) |
where
ρ is the mass density of the fluid,
τ =
η[∇
v + ∇
vT] is the viscous stress tensor with
η being the dynamic viscosity, and
p is the thermodynamic pressure. The additional interfacial tension tensor
θ can be expressed as
| |
 | (9) |
where
I is a second rank unit tensor. The three coupled equations (
eqn (4),
(7), and
(8)) constitute a complete set of kinetic equations that describe the liquid–liquid phase separation.
The free-energy-based multiphase lattice Boltzmann method8,30–32 is adopted as a numerical algorithm to solve the coupled equations. Simulations were performed on lattices with 256 × 256 nodes, using no-slip boundary conditions.31 We set the grid size Δx = Δy = 1 and the time step Δt = 0.1. The other dimensionless model parameters are  Tc = 1, κ = 0.1, η = 0.9, D = 0.1. For simplicity's sake, the system is initialized with ρ = 1.0, v = 0. To determine the effects of temperature on phase separation, we choose SCN-82.47 at% H2O and SCN-89 at% H2O solutions to quench to different temperatures, marked by the circular (SD cases) and triangle symbols (NG cases) respectively in Fig. 1. Meanwhile, the differences in phase separation between solutions with different compositions, marked by diamond symbols, are also examined at the temperature of 0.96Tc. The other physical parameters used in the simulations are listed in Table 1.
Table 1 Physical parameters of SCN-H2O solution19,20,28
| Physical parameter |
Value |
| Critical temperature Tc (K) |
331.2 |
| Critical concentration of H2O cc (at%) |
82.47% |
| Viscosity of H2O ηH2O (10−3 Pa s) |
1.01 |
| Viscosity of SCN ηSCN (10−3 Pa s) |
2.6 |
| Density of H2O ρH2O (103 kg m−3) |
1.0 |
| Density of SCN ρSCN (103 kg m−3) |
0.998 |
| Diffusion coefficient D (10−9 m2 s−1) |
2.0 |
2.2 Morphological characterization of patterns of phase separation
The usual approaches to characterize the evolution of single phase domains are mainly based on the time dependent mean domain size R(t), which is calculated from the first moment of the structure factor.2,11 However, the mean domain size alone cannot account for the rich variety of geometrical shapes of single phase domains and their connectivity. Therefore, to characterize quantitatively the time evolution of phase separation patterns, we adopt three Minkowski functionals,11,13,25 which correspond geometrically to the fractional area A of the second phase domains, the boundary length L between two phases, and the Euler characteristic χ characterizing the connectivity of the spatial pattern and the number of isolated second phase domains. They also provide a convenient way to define the average domain size R(t), which is introduced in Section 3.
For calculation, we define a threshold value cth. When c(r,t) is above cth, a pixel of the square lattice is regarded as a white pixel; otherwise, as a black one. The white and black pixels distinguish the separated phases. c(r,t) of a pixel can be calculated by averaging its four vertices. Therefore, for a given a threshold value cth, the two-valued field P(r,cth) is defined as
| |
 | (10) |
Based on that, the Minkowski functionals A, L, and χ can be calculated as
| |
 | (11) |
| |
 | (12) |
| | |
χ(cth) = (Nb − Nw)/N,
| (13) |
where
Nth is the number of black pixels,
N is the total number of pixels.
Nb and
Nw represent the number of black and white finite single domains, respectively.
3 Simulation results and discussions
3.1 The effects of temperature on spinodal decomposition
SD occurs without any energy barrier at the critical composition as long as the temperature is below Tc. We simulate the pattern formation of this process in the SCN-82.47 at% H2O solution at three temperatures: 0.995Tc, 0.99Tc, and 0.98Tc, marked by circular symbols in Fig. 1. The results are shown in Fig. 2. For the three temperatures, on one hand, the phase separation behaviors are similar. In the very initial stage, the bicontinuous structure forms throughout the whole region and the concentrations of the two separated phases deviate slightly so that the interface is unclear. As time goes on, the difference in the concentration of the two phases increases gradually and the interface becomes progressively more distinct. Accompanying this, the bicontinuous structure starts to break up and gradually form spherical droplets due to surface tension. Then the neighboring droplets collide and coalesce. Some larger liquid droplets also continue to grow while some smaller droplets dissolve, revealing that Ostwald ripening occurs. On the other hand, the lower the temperature, the less time is needed for forming the interface, indicating that the phases separate more quickly. Moreover, the bicontinuous structure becomes finer and easier to break up at lower temperature, which produces more liquid droplets with smaller radius.
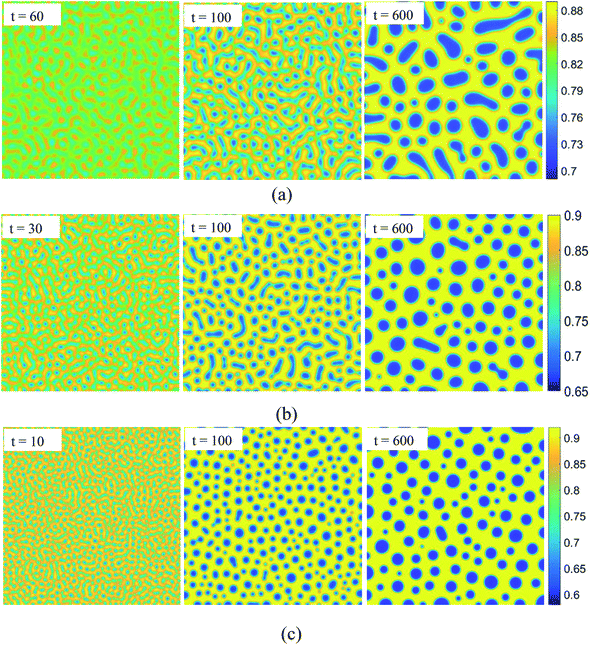 |
| | Fig. 2 Evolution of patterns in spinodal decomposition with dimensionless time for SCN-82.47 at% H2O solution. The temperature is fixed at (a) T = 0.995Tc, (b) T = 0.99Tc, and (c) T = 0.98Tc. | |
To describe quantitatively the process of SD under different temperatures, the three Minkowski functionals have been calculated at the selected threshold cth value of 0.81, as shown in Fig. 3. With the passing of time, the values of A, L, and χ all increase at first, after which A remains essentially constant whereas L and χ decrease rapidly. Thus, the complete process of phase separation can be divided into two stages: the early stage of SD and the later stage of domain growth. The maximum values ![[L with combining macron]](https://www.rsc.org/images/entities/i_char_004c_0304.gif) and
and ![[small chi, Greek, macron]](https://www.rsc.org/images/entities/i_char_e0d8.gif) mark the transition and their positions t(
mark the transition and their positions t(![[L with combining macron]](https://www.rsc.org/images/entities/i_char_004c_0304.gif) ) and t(
) and t(![[small chi, Greek, macron]](https://www.rsc.org/images/entities/i_char_e0d8.gif) ) can be used to define the transition time
) can be used to define the transition time ![[t with combining macron]](https://www.rsc.org/images/entities/i_char_0074_0304.gif) .
.
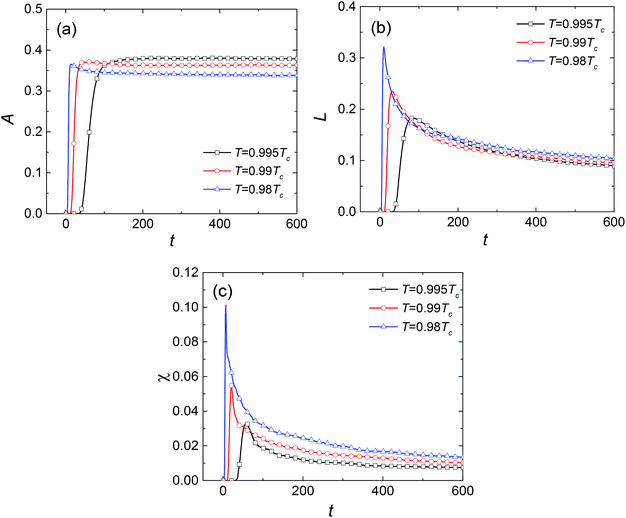 |
| | Fig. 3 Variations in the Minkowski measures (a) A, (b) L, and (c) χ with dimensionless time at different temperatures for SCN-82.47 at% H2O solution. | |
In the SD stage, the increasing concentration fluctuation leads to the formation of an interface between the two coexisting phases accompanied by the increase of A, L, and χ. For A, its maximum value is decided by the lever rule of the phase diagram and is irrelevant to the dynamic process. As for L and χ, their maximum values are larger at lower temperature, suggesting that more single domains form. Furthermore, the transition time ![[t with combining macron]](https://www.rsc.org/images/entities/i_char_0074_0304.gif) decreases with the decrease of temperature, revealing that the SD proceeds much faster at lower temperature. In the domain growth stage, the irregular shaped second phase begins to shrink and evolves into spherical droplets due to the surface tension, which reduces the total boundary length between the two phases. After that, the coalescence between droplets and the process of Ostwald ripening reduce the number of liquid droplets and the total boundary length. Thus, L and χ decrease significantly with time. Fig. 3(b) and (c) show that the coalescence and Ostwald ripening are intense at the beginning of the domain growth stage but decay rapidly with time. Moreover, the curves are steeper at lower temperature, indicating that the coalescence and the Ostwald ripening are intense.
decreases with the decrease of temperature, revealing that the SD proceeds much faster at lower temperature. In the domain growth stage, the irregular shaped second phase begins to shrink and evolves into spherical droplets due to the surface tension, which reduces the total boundary length between the two phases. After that, the coalescence between droplets and the process of Ostwald ripening reduce the number of liquid droplets and the total boundary length. Thus, L and χ decrease significantly with time. Fig. 3(b) and (c) show that the coalescence and Ostwald ripening are intense at the beginning of the domain growth stage but decay rapidly with time. Moreover, the curves are steeper at lower temperature, indicating that the coalescence and the Ostwald ripening are intense.
As a quantitative measure of the domain growth kinetics, we calculate the average domain size R(t) = A(t)/L(t) as a function of time,33 as shown in Fig. 4. Evidently, there is a crossover in the relationship between R and t for all three temperatures, as the arrows denote. At the early times, diffusion is the main mechanism for solute transport so that domain growth obeys R–t1/3. At later times, the concentrations of the two phases are close to the respective equilibrium values so that diffusion of the solute is quite slow. During this phase, droplets coalescence and Ostwald ripening dominates the domain growth as R–t. The transition from R–t1/3 to R–t has been reported to occur when the phase transition occurs near the binodal temperature,8 and our simulation results indicate that this growth law still holds at large quenching depth. However, the temperature still influences the dynamic process of phase separation. Lower temperature leads to a shorter duration of the diffusion process, indicating that the single phase separates into two coexisting phases more quickly. Furthermore, the average domain size is smaller at lower temperature, corresponding to a finer bicontinuous structure in the early stage and smaller liquid droplets in the later stage, which is in agreement with the results in Fig. 2.
 |
| | Fig. 4 Average domain size R versus dimensionless time t at different temperatures for SCN-82.47 at% H2O solution. The arrows denote the scaling behaviors as the domain size changes into ∼t from ∼t1/3. | |
3.2 The effects of temperature on nucleation-growth
We choose the SCN-89 at% H2O solution to simulate the NG process at different temperatures: 0.96Tc, 0.95Tc, and 0.94Tc, marked by triangle symbols in Fig. 1, and the pattern formations are shown in Fig. 5. Unlike SD, the change of composition in the NG process is abrupt and the minority second phase forms with spherical shape. The concentrations of the second phase and matrix phase around the droplets are close to the equilibrium value while the concentration in the other region keeps initial value. Therefore, the interface between the two phases is clear at the beginning of phase separation. Moreover, lower temperature significantly promotes the nucleation rate, resulting in greater number and smaller size of liquid droplets in solution.
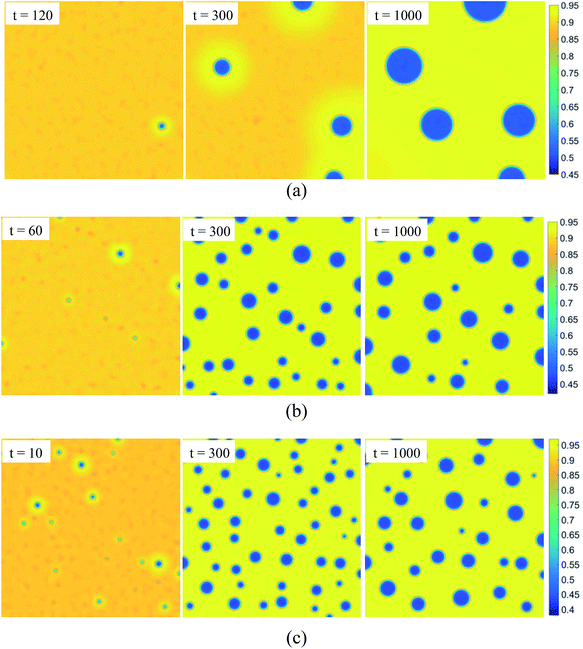 |
| | Fig. 5 Evolution of patterns in nucleation-growth with dimensionless time for SCN-89 at% H2O solution. The temperature is fixed at (a) T = 0.96Tc, (b) T = 0.95Tc, and (c) T = 0.94Tc. | |
The values of the three Minkowski functionals are also calculated, as shown in Fig. 6, in which the threshold value cth is selected as 0.8. Similar to the behavior observed for SD, the “increase-then-decrease” transition tendency also exists in the curves of L and χ at 0.95Tc and 0.94Tc. However, the Minkowski functionals increase monotonously with time at 0.96Tc, presumably because the process of phase separation at this temperature is quite slow. It is expected that the transition would also appear at 0.96Tc if sufficient time were allowed. Actually, such a transition connects two growth mechanisms of liquid droplets. In the early stage, the core of the second phase forms and the solution is supersaturated for all liquid droplets, so that all of them keep on growing. In the later stage, the single phase has separated into two coexisting phases and the system is close to the equilibrium state. Furthermore, the maximum values of L and χ increase with the decrease of temperature, suggesting a higher nucleation rate. This results in the easier and quicker overlap of diffusion zones of the solute. Therefore, the growth of droplets enters the next stage after a shorter time, which also causes the radius of droplets to be smaller at lower temperature. Compared with Fig. 3, 6(b) and (c) show that L and χ decrease more gently, indicating that the growth mechanism of NG may be different from that of SD in the later stage. In fact, the liquid droplets are widely separated from each other due to the small volume fraction, so that the collision and coalescence between droplets rarely occurs.
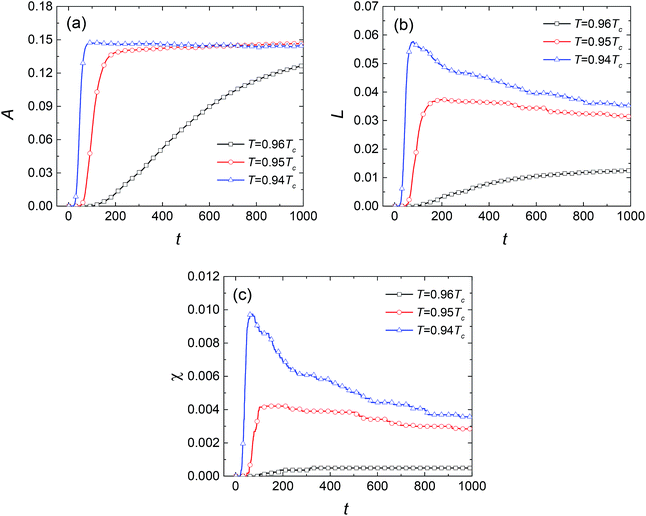 |
| | Fig. 6 Variations in the Minkowski measures (a) A, (b) L, and (c) χ with dimensionless time at different temperatures for SCN-89 at% H2O solution. | |
Fig. 7 presents the calculated results of the time dependent domain size. The average domain size, which corresponds to the mean radius of liquid droplets in this case, satisfies R = K(t − t0)1/2, in which K is a constant as given by Zener34 in theory. The values of coefficient K at the three temperatures are very close in our simulations, indicating that the growth speed of liquid droplets is nearly temperature-independent. In the later stage after the transition point of L and χ, due to the overlap of the diffusion zones, the Ostwald ripening becomes the main mechanism of coarsening. In this case, the domain grows slowly as R–t1/3. Clearly, the crossover from t1/2 to t1/3 holds not only near the binodal temperature, but also at temperatures of quenching to a certain degree.
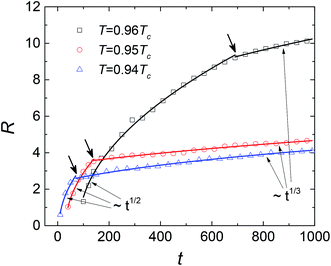 |
| | Fig. 7 Average domain size R versus dimensionless time t at different temperatures for SCN-89 at% H2O solution. The arrows denote the scaling behaviors as the domain size changes into ∼t1/3 from ∼t1/2. | |
3.3 Phase separation with different initial concentrations at same temperature
To examine the influence of initial composition, we simulate the phase separation of solutions with different initial compositions at the same temperature of 0.96Tc, marked by diamond symbols in Fig. 1. The results are presented in Fig. 8. It shows that with the changing composition, the patterns in the early stage of phase separation evolve gradually from a bicontinuous structure into a droplet-like structure, suggesting that the phases separate by SD in Fig. 8(a) and (b) but by nucleation in Fig. 8(d). There are some spherical droplets with clear interfaces in Fig. 8(c), similar to the case of nucleation. However, many fuzzy and irregularly shaped domains can be distinguished in the background, which do not appear in Fig. 8(d). Moreover, the phase separation in Fig. 8(c) starts much earlier than that in Fig. 8(d), indicating that the solution of c = 0.87 should separate by SD at 0.96Tc. The Minkowski values for phase separation in this situation are given in Fig. 9. Fig. 9(a) shows that the volume fraction of the second phase is smaller at off-critical compositions, which is the main reason for the droplet-like structure in the early stage of SD. One striking feature in Fig. 9(b) and (c) is that although the solutions of c = 0.87 and c = 0.88 are similar in terms of patterns and composition, their L and χ are significantly different. This characterizes the essential distinction between SD and nucleation, that is, a spontaneous process for the former and an activated process for the latter.
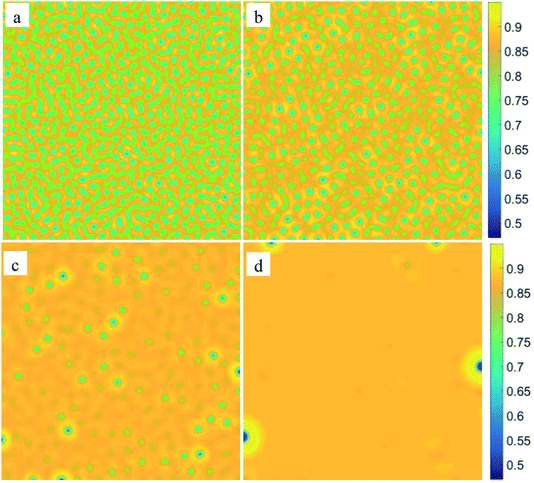 |
| | Fig. 8 The patterns at the very beginning of phase separation for different initial composition: (a) c = 0.824, t = 9, (b) c = 0.85, t = 13, (c) c = 0.87, t = 35, and (d) c = 0.88, t = 180. The morphology of the system changes gradually from a bicontinuous structure into a droplet-like structure. | |
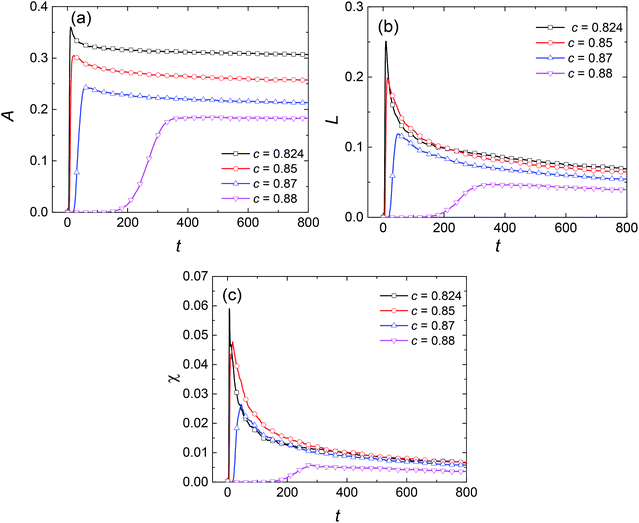 |
| | Fig. 9 Variations in the Minkowski measures (a) A, (b) L, and (c) χ with dimensionless time at temperature of 0.96Tc for different initial compositions. | |
The evolutions of the R–t relationships are presented in Fig. 10. It shows that the domain growth law is related to the mechanism of phase separation instead of the initial composition. For SD at off-critical compositions, the average domain size still obeys R–t1/3 at early times and R–t at later times. However, the duration of diffusion-driven growth is shorter at off-critical compositions, indicating that the single phase separates into two coexisting phases in a shorter time. The reason could be that this initial composition is closer to the equilibrium value of the matrix phase so that the diffusion process lasts for a shorter time. Furthermore, this also causes the size of single domains to be smaller at off-critical compositions. For NG, the crossover from R–t1/2 to R–t1/3 still holds for the solution of c = 0.88, indicating the initial composition does not influence the exponent in the growth law. However, in the cases plotted in Fig. 6(c) and 9(c), the nucleation rate is larger than the case of c = 0.88 at the temperature of 0.96Tc. Hence, the effect of composition on NG and SD is different. In NG, if the initial composition is closer to the critical value, the single phase separates more quickly and the average size of liquid droplets is smaller, as shown in Fig. 7 and 10.
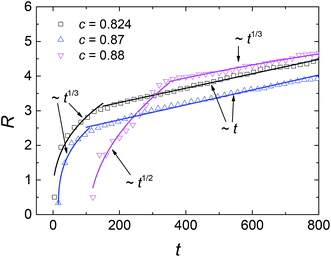 |
| | Fig. 10 Average domain size R versus dimensionless time t at temperature of 0.96Tc for different initial compositions. The scaling behaviors are solely related to the mechanism of phase separation, i.e. spinodal decomposition (c = 0.824 and c = 0.87) or nucleation-growth (c = 0.88). | |
4 Conclusions
We discuss and analyze the effects of initial composition and temperature on phase separation by using a simulation method. It is found that the domain growth law is solely related to the mechanism of phase separation. The average domain size yields R(t)–tn where n = 1/3 in the early stage and n = 1 in the later stage for SD while n = 1/2 and n = 1/3 respectively for NG. In general, lower temperature causes the domain growth in the early stage to last for a shorter time, indicating that the single phase separates more quickly into two coexisting phases. For SD, the bicontinuous structure in the early stage is finer at lower temperature, which produces more liquid droplets with smaller size and further causes the processes of droplet coalescence and Ostwald ripening in the later stage to be more intense. For NG, the temperature also does not influence the growth rate of single liquid droplets in the early stage. However, the nucleation rate increases significantly with the decrease of temperature while the size of liquid droplets decreases.
We also show that the spatial patterns in the early stage of SD change gradually into a droplet-like structure from a bicontinuous structure as the initial composition diverges from the critical value. The composition affects the mechanism of phase separation, i.e. spinodal or nucleation-driven, but does not change the exponent in the domain growth law as mentioned above. For SD, when the initial composition is closer to the critical value, diffusion-driven growth lasts for a longer time and the average size of liquid droplets is larger. In contrast, for nucleation, the single phase separates more quickly and the average size of liquid droplets is smaller. Finally, comparing SD and nucleation at the same temperature, if their patterns and composition are close, the phase separation by the former still proceeds more quickly.
Conflicts of interest
There are no conflicts of interest to declare.
Acknowledgements
This work was supported by the National Natural Science Foundation of China (Grant No. 51671160) and the Fund of the Innovation Base of Graduate Students of NPU.
References
- L. Ratke and S. Diefenbach, Mater. Sci. Eng. R Rep., 1995, 15, 263–347 CrossRef
 .
. - P. de Castro and P. Sollich, Phys. Chem. Chem. Phys., 2017, 19, 22509–22527 RSC
 .
. - Y. Ren and M. Müller, J. Chem. Phys., 2018, 148, 204908 CrossRef PubMed
 .
. - K. Binder and P. Virnau, J. Chem. Phys., 2016, 145, 211701 CrossRef PubMed
 .
. - E. D. Siggia, Phys. Rev. A, 1979, 20, 595–605 CrossRef CAS
 .
. - S. Puri and K. Binder, Phys. Rev. Lett., 2001, 86, 1797–1800 CrossRef CAS PubMed
 .
. - D. A. Huse, Phys. Rev. B, 1986, 34, 7845–7850 CrossRef
 .
. - S. Puri and V. Wadhawan, Kinetics of Phase Transitions, CRC Press, 2009 Search PubMed
 .
. - W. R. Osborn, E. Orlandini, M. R. Swift, J. M. Yeomans and J. R. Banavar, Phys. Rev. Lett., 1995, 75, 4031–4034 CrossRef CAS PubMed
 .
. - V. M. Kendon, J. C. Desplat, P. Bladon and M. E. Cates, Phys. Rev. Lett., 1999, 83, 576–579 CrossRef CAS
 .
. - Y. Gan, A. Xu, G. Zhang, Y. Li and H. Li, Phys. Rev. E: Stat., Nonlinear, Soft Matter Phys., 2011, 84, 046715 CrossRef PubMed
 .
. - K. R. Mecke and V. Sofonea, Phys. Rev. E, 1997, 56, R3761–R3764 CrossRef CAS
 .
. - V. Sofonea and K. R. Mecke, Eur. Phys. J. B, 1999, 8, 99–112 CrossRef CAS
 .
. - I. M. Lifshitz and V. V. Slyozov, J. Phys. Chem. Solids, 1961, 19, 35–50 CrossRef
 .
. - P. W. Voorhees, J. Stat. Phys., 1985, 38, 231–252 CrossRef
 .
. - J. A. Marqusee and J. Ross, J. Chem. Phys., 1983, 79, 373–378 CrossRef CAS
 .
. - A. S. Abyzov and J. W. Schmelzer, J. Chem. Phys., 2007, 127, 114504 CrossRef PubMed
 .
. - M. C. Weinberg, W. H. Pois and L. Granas, C. R. Chim., 2002, 5, 765–771 CrossRef CAS
 .
. - Y. L. Peng, L. Zhang, L. Wang, X. W. Lei, W. J. Yao and N. Wang, Mater. Lett., 2018, 216, 70–72 CrossRef CAS
 .
. - G. Hansen, S. Liu, S. Z. Lu and A. Hellawell, J. Cryst. Growth, 2002, 234, 731–739 CrossRef CAS
 .
. - R. P. Shi, C. P. Wang, D. Wheeler, X. J. Liu and Y. Wang, Acta Mater., 2013, 61, 1229–1243 CrossRef CAS
 .
. - B. C. Luo, X. R. Liu and B. Wei, J. Appl. Phys., 2009, 106, 035302 Search PubMed
 .
. - P. C. Hohenberg and B. I. Halperin, Rev. Mod. Phys., 1977, 49, 435–479 CrossRef CAS
 .
. - A. G. Lamorgese and R. Mauri, Phys. Fluids, 2005, 17, 105–115 Search PubMed
 .
. - K. R. Mecke, Phys. Rev. E: Stat. Phys., Plasmas, Fluids, Relat. Interdiscip. Top., 1996, 53, 4794–4800 CrossRef CAS
 .
. - J. W. Cahn, Acta Metall., 1961, 9, 795–801 CrossRef CAS
 .
. - Y. H. Wu, W. L. Wang, Z. C. Xia and B. Wei, Comput. Mater. Sci., 2015, 103, 179–188 CrossRef CAS
 .
. - S. Zhang, Z.-K. Liu and Q. Han, J. Phase Equilib. Diffus., 2008, 29, 247–251 CrossRef CAS
 .
. - K. C. Kumar, P. Wollants and L. Delaey, CALPHAD, 1996, 20, 139–149 CrossRef
 .
. - A. Xu, G. Gonnella and A. Lamura, Phys. A, 2004, 331, 10–22 CrossRef
 .
. - H. P. Wang, X. G. Geng, X. G. Li and D. Y. Zang, Eur. Phys. J. E, 2016, 39, 102 CrossRef PubMed
 .
. - M. R. Swift, E. Orlandini, W. R. Osborn and J. M. Yeomans, Phys. Rev. E, 1996, 54, 5041–5052 CrossRef CAS
 .
. - M. Haataja, J. Mahon, N. Provatas and F. Léonard, Appl. Phys. Lett., 2005, 87, 081201 CrossRef
 .
. - C. Zener, J. Appl. Phys., 1949, 20, 950–953 CrossRef CAS
 .
.
|
| This journal is © The Royal Society of Chemistry 2019 |
Click here to see how this site uses Cookies. View our privacy policy here.  Open Access Article
 *a
*a


 is the kth binary interaction parameter between i and j and depends on the temperature as a function of A + BT, in which A and B are model parameters. For the SCN-H2O system,
  are given as follows (k = 0, 1, 2, 3)28


 Tc = 1, κ = 0.1, η = 0.9, D = 0.1. For simplicity's sake, the system is initialized with ρ = 1.0, v = 0. To determine the effects of temperature on phase separation, we choose SCN-82.47 at% H2O and SCN-89 at% H2O solutions to quench to different temperatures, marked by the circular (SD cases) and triangle symbols (NG cases) respectively in Fig. 1. Meanwhile, the differences in phase separation between solutions with different compositions, marked by diamond symbols, are also examined at the temperature of 0.96Tc. The other physical parameters used in the simulations are listed in Table 1.


![[L with combining macron]](https://www.rsc.org/images/entities/i_char_004c_0304.gif) and
and ![[small chi, Greek, macron]](https://www.rsc.org/images/entities/i_char_e0d8.gif) mark the transition and their positions t(
mark the transition and their positions t(![[L with combining macron]](https://www.rsc.org/images/entities/i_char_004c_0304.gif) ) and t(
) and t(![[small chi, Greek, macron]](https://www.rsc.org/images/entities/i_char_e0d8.gif) ) can be used to define the transition time
) can be used to define the transition time ![[t with combining macron]](https://www.rsc.org/images/entities/i_char_0074_0304.gif) .
.
![[t with combining macron]](https://www.rsc.org/images/entities/i_char_0074_0304.gif) decreases with the decrease of temperature, revealing that the SD proceeds much faster at lower temperature. In the domain growth stage, the irregular shaped second phase begins to shrink and evolves into spherical droplets due to the surface tension, which reduces the total boundary length between the two phases. After that, the coalescence between droplets and the process of Ostwald ripening reduce the number of liquid droplets and the total boundary length. Thus, L and χ decrease significantly with time. Fig. 3(b) and (c) show that the coalescence and Ostwald ripening are intense at the beginning of the domain growth stage but decay rapidly with time. Moreover, the curves are steeper at lower temperature, indicating that the coalescence and the Ostwald ripening are intense.
decreases with the decrease of temperature, revealing that the SD proceeds much faster at lower temperature. In the domain growth stage, the irregular shaped second phase begins to shrink and evolves into spherical droplets due to the surface tension, which reduces the total boundary length between the two phases. After that, the coalescence between droplets and the process of Ostwald ripening reduce the number of liquid droplets and the total boundary length. Thus, L and χ decrease significantly with time. Fig. 3(b) and (c) show that the coalescence and Ostwald ripening are intense at the beginning of the domain growth stage but decay rapidly with time. Moreover, the curves are steeper at lower temperature, indicating that the coalescence and the Ostwald ripening are intense.


.
.
.
.
.
.
.
.
.
.
.
.
.
.
.
.
.
.
.
.
.
.
.
.
.
.
.
.
.
.
.
.
.
.


