 Open Access Article
High pairing rate Janus-structured microfibers and array: high-efficiency conjugate electrospinning fabrication, structure analysis and co-instantaneous multifunctionality of anisotropic conduction, magnetism and enhanced red fluorescence†
Jiao Tian,
Qianli Ma,
Wensheng Yu,
Dan Li,
Xiangting Dong *,
Guixia Liu
 and
Jinxian Wang
Key Laboratory of Applied Chemistry and Nanotechnology at Universities of Jilin Province, Changchun University of Science and Technology, Changchun 130022, China. E-mail: dongxiangting888@163.com; maqianlimail@163.com; Fax: +86 0431 85383815; Tel: +86 0431 85582575
First published on 5th April 2019
Abstract
A highly efficient and convenient conjugate electrospinning technique is employed to obtain high pairing rate Janus-structured microfibers in electrospun products by optimizing the spinning conditions. In addition, a Janus-structured microfiber array rendering tri-functional performance of tunable magnetism, electrically anisotropic conduction and increased fluorescence is prepared via the same technique using a rotating device as a fiber collector. The array is composed of an ordered arrangement of Janus-structured microfibers. The extraordinary Janus structure and oriented arrangement endow the Janus-structured microfibers with excellent fluorescence. The fluorescence intensity of the Janus-structured microfiber array is, respectively, 1.21, 14.3 and 20.3 times higher than that of the Janus-structured microfiber non-array, the composite microfiber array and the composite microfiber non-array. The Janus-structured microfiber array has a similar saturation magnetization to the contradistinctive specimens. Additionally, the magnetism of the Janus-structured microfiber array can be modulated with different mass ratios of Fe3O4 nanoparticles (NPs), and the conductance ratio between the length direction and diameter direction of the Janus-structured microfibers for the array can be tuned from 103 to 106 by adding a higher percentage of polyaniline (PANI). Our new findings have established a highly efficient conjugate electrospinning technique to prepare Janus-structured microfibers of high pairing rate, and complete isolation of fluorescent material from magnetic nanoparticles and conductive material is accomplished in the Janus-structured microfibers to ensure high fluorescence intensity without a notably disadvantageous influence of dark-colored substances. More importantly, the fabrication technique for the Janus-structured microfibers can be generalized to manufacture other Janus-structured multifunctional materials.
Introduction
Recently, multifunctional materials have replaced the singleness of utilization of their counterpart monofunctional materials to achieve multifunctionality under the condition of specific size, which has attracted attention from scientific research.1–3 The special anisotropy of multifunctional materials in terms of electrical conductance or thermal conductivity has aroused much attention due to potential applications in electronic devices and in thermal management.4,5 As the science and technology develops, electronic systems become more and more smart (or intelligent) and electrically anisotropic materials with multifunctionality can be used widely in electronic devices, such as flip-chip packaging, because of their small size.6,7 It is noteworthy that electrically anisotropic conductive–fluorescent–magnetic (defined as E–F–M) multifunctional materials with enhanced characteristics have great potential for future applications in the fields of photoelectric devices, drug targeting and delivery, and electromagnetic interference shielding.8–10 At present, polyaniline (PANI), rare earth complexes and Fe3O4 nanoparticles (NPs) are commonly used as conductive polymer materials, luminescent materials and magnetic substances, respectively,11 to construct E–F–M multifunctional materials. For example, Xi and co-workers12 prepared [(Fe3O4/PVP)@(Eu(BA)3phen/PVP)]∥[PANI/PVP] (PVP, polyvinyl pyrrolidone) tri-functional Janus nanofibers by a modified electrospinning method. The results of experimental and theoretical studies have proven that the emissions of rare earth ions are affected by light-absorbing substances (such as electrical and magnetic materials).13,14 Therefore, in the preparation of E–F–M tri-functional materials, the adverse effects of conductive materials and magnetic materials on luminescent substances should be minimized as far as possible, which is an essential factor that must be considered.Fibrous materials are part of many significant natural systems and modern technologies and the reason why the preparation, characterization and application of fibers has become a research hotspot.15–17 Micro- and nanofibers can be synthesized by various methods. Electrospinning, in particular, has gained more and more attention as an applicable and effective method to fabricate nano- and micro-structured fiber-shaped materials, by applying an intensity-controllable electric field to a polymer solution or melt.18–23 In general, microfibers24,25 with higher mechanical strength and torsion resistance have important applications in sensors and wearable devices,26 and microfibers with different structures have potential applications in some advanced materials and in biomedicine.27 Conjugate electrospinning, as a novel modified electrospinning technology, has gradually attracted the attention of researchers due to its superiority for the ordered structure of products, wide applicability, continuous spinning (rarely appearing plugging of spinneret), etc.28–30 It is more effective and simpler for the fabrication of aligned fibers and yarns, although few Janus-structured fibers have been produced. Song and co-workers31 fabricated continuous mullite nanofibers via conjugate electrospinning and a sol–gel method. The final specimens have highly aligned structures and unique mechanical properties. In another study, Zhou and co-workers32 used conjugate electrospinning technology and then heat-stabilized and carbonized the specimens to prepare carbon-composite nanofiber yarns. The nanofibers in the yarns were well oriented along the cable axis. In our previous work,33 we have successfully manufactured tri-functional hetero-structured nanofiber yarns by conjugate electrospinning methods that not only have well-ordered structures, but also possess excellent fluorescence, electrical conductivity and magnetism. Janus-structured materials have become a research hotspot in the field of materials science because of their asymmetric structure and unique properties, which can effectively separate two or more substances, thereby improving the functionality of the materials.34,35 Commonly, Janus-structured fibers are obtained by parallel electrospinning technology.36–38 However, Yu et al.39 reported that the pairing rate of Janus-structured nanofibers prepared by parallel electrospinning technology using two parallel needles is not very high, so they improved the pairing rate by transforming the style of the needles. This is a subject that deserves further investigation to further improve the pairing rate of Janus-structured fibers by conjugate electrospinning.
In theory, conjugate electrospinning technology is capable of producing two strands of fibers with opposite charges due to two spinnerets connected to positive high voltage and negative high voltage, respectively. This is suitable for preparation of Janus-structured fibers, with the two strands of oppositely charged fibers attracting each other to form a Janus structure. In practice, on the basis of the current literature and some of our own experiments, the jets produced by the conjugate electrospinning technology are split. So, when the oppositely charged fibers are encountered they can cross each other rather than form a parallel Janus structure. We have tried to fabricate Janus-structured fibers by conjugate electrospinning utilizing polyvinyl pyrrolidone (PVP) as the template. The detailed spinning process is displayed in Video 1.† Multiple nanofibers ejected from the two spinnerets are divergent and combine to cause product fibers with fewer Janus structures. Based on this, we speculate that if a high pairing rate of Janus-structured fibers is acquired by conjugate electrospinning, the jets at the nozzles of the two relatively placed spinnerets cannot split.
In this article, poly(methyl methacrylate) (PMMA) is used to manufacture Janus-structured fibers, as the jet containing PMMA is difficult to split on account of the high rigidity of the PMMA molecular chain. [Fe3O4/PANI/PMMA]∥[Eu(TTA)3(TPPO)2/PMMA] Janus-structured microfibers and their array, with tri-functionality for anisotropic conduction, magnetism and fluorescence, were fabricated by a facile conjugate electrospinning technology with a rotating metal rod as a collecting device. Each Janus-structured microfiber in the array consists of Fe3O4/PANI/PMMA as a conductive–magnetic section and Eu(TTA)3(TPPO)2/PMMA as an insulating–luminescent section. This Janus structure shows that rare earth complexes, Fe3O4 NPs and PANI only appear in their respective specified regions, which helps to reduce adverse influences from dark-colored materials on the luminescent materials. For the sake of showing the advantageous properties of the Janus-structured microfibers array, we also construct the composite microfibers array and non-array and the Janus-structured microfibers non-array as contradistinctive specimens under the same experimental conditions. Finally, the morphology, internal structure and properties of the specimens are characterized using a series of modern techniques and some new and significant results are obtained.
Experimental section
Chemical reagents
Methylmethacrylate (MMA), aniline (ANI), (1S)-(+)-camphor-10 sulfonic acid (CSA) and ammonium persulfate (APS) were bought from Aladdin Chemistry Co., Ltd. Benzoylperoxide (BPO), triphenylphosphine oxide (TPPO), 2-thenoyltrifluoroacetone (HTTA), N,N-dimethylformamide (DMF), trichloromethane (CHCl3) and anhydrous ethanol were purchased from Beijing Chemical Works. Europium oxide (Eu2O3, 99.99%), nitric acid (HNO3), ammonia (NH3·H2O), FeCl3·6H2O, FeSO4·7H2O, oleic acid, NH4NO3 and polyethylene glycol (PEG, Mw = 20![[thin space (1/6-em)]](https://www.rsc.org/images/entities/char_2009.gif) 000) were purchased from Sinopharm Chemical Reagent Co., Ltd. All reagents were of analytical grade and used as received. Deionized water was home-made.
000) were purchased from Sinopharm Chemical Reagent Co., Ltd. All reagents were of analytical grade and used as received. Deionized water was home-made.
Fabrication of E–F–M tri-functional the Janus-structured microfibers array via conjugate electrospinning
Eu(TTA)3(TPPO)2 complexes, Fe3O4 NPs and poly(methyl methacrylate) (PMMA) were prepared as in our previous work.40,41 Two diverse spinnable liquids were fabricated for preparation of the E–F–M tri-functional Janus-structured microfibers array. The spinnable liquid containing PANI, Fe3O4 NPs, PMMA, DMF and CHCl3 was marked as spinnable liquid 1. The manufacturing process for liquid 1 is as follows. First, a certain mass of Fe3O4 NPs was dispersed ultrasonically in 13.2000 g of CHCl3 for 45 min, then CSA, ANI, PMMA and 0.2000 g of DMF were added into the solution with magnetic stirring for 48 h. This was named as liquid a. A certain amount of APS was dispersed in 1.6000 g of DMF for 2 h to form liquid b. Then, liquids a and b were placed in the refrigerator at 0 °C for 60 min. After this, liquid b was slowly decanted into liquid a in an ice–water bath with magnetic stirring for 3 h. Finally, the above liquid mixture was placed in the refrigerator at 0 °C for 24 h, and liquid 1 for fabricating the conductive–magnetic section of the Janus-structured microfibers was acquired.Eu(TTA)3(TPPO)2 complex, PMMA, DMF and CHCl3 constituted the other spinnable liquid, which was defined as spinnable liquid 2. In order to prepare spinnable liquid 2, PMMA and diverse mass percentages of Eu(TTA)3(TPPO)2 were added into the mixture of DMF and CHCl3, and then the solution was placed on a magnetic stirring apparatus at 25 °C for 48 h. The specific doses of the materials in spinnable liquid 1 and spinnable liquid 2 are presented in Tables 1 and 2, respectively. The Janus-structured microfibers prepared by S1-a∥S2-a, S1-a∥S2-b, S1-a∥S2-c, S1-a∥S2-d, S1-a∥S2-e, S1-b∥S2-c, S1-c∥S2-c, S1-d∥S2-c, S1-e∥S2-c and S1-f∥S2-c were labeled as S1–S10, respectively.
| Spinnable liquid 1 | ANI/g | CSA/g | APS/g | Fe3O4/g | PMMA/g | DMF/g | CHCl3/g |
|---|---|---|---|---|---|---|---|
| S1-a | 0.36 | 1.4400 | 0.7063 | 0.4000 | 1.2000 | 1.8000 | 13.2000 |
| S1-b | 0.48 | 1.9200 | 0.9369 | 0.4000 | 1.2000 | 1.8000 | 13.2000 |
| S1-c | 0.60 | 2.4000 | 1.1712 | 0.4000 | 1.2000 | 1.8000 | 13.2000 |
| S1-d | 0.72 | 2.8800 | 1.4064 | 0.4000 | 1.2000 | 1.8000 | 13.2000 |
| S1-e | 0.36 | 1.4400 | 0.7063 | 1.2000 | 1.2000 | 1.8000 | 13.2000 |
| S1-f | 0.36 | 1.4400 | 0.7063 | 3.6000 | 1.2000 | 1.8000 | 13.2000 |
| Spinnable liquid 2 | Eu(TTA)3(TPPO)2/g | PMMA/g | DMF/g | CHCl3/g |
|---|---|---|---|---|
| S2-a | 0.0600 | 1.2000 | 1.8000 | 13.2000 |
| S2-b | 0.1800 | 1.2000 | 1.8000 | 13.2000 |
| S2-c | 0.3000 | 1.2000 | 1.8000 | 13.2000 |
| S2-d | 0.4200 | 1.2000 | 1.8000 | 13.2000 |
| S2-e | 0.5400 | 1.2000 | 1.8000 | 13.2000 |
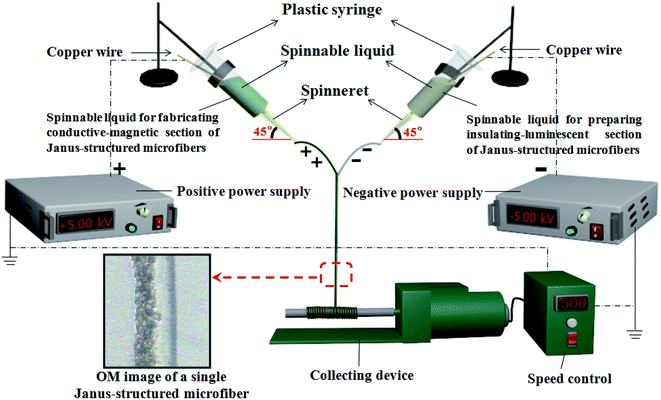
A conjugate electrospinning setup for the fabrication of the Janus-structured microfibers is presented in Fig. 1. Two high-voltage, direct current power supplies outputting positive and negative voltages, respectively, were used in the conjugate electrospinning system. The two spinnable liquids were separately injected into two 5 mL plastic syringes, which were installed in opposite directions at a distance of about 10 cm, and both were placed at an angle of about 45° from the horizontal. Two plastic needles were used as the spinnerets. Two pieces of copper wire were separately plunged into the spinnable liquids and used as the electrodes. A rotating metal rod covered with aluminum foil, with a diameter of 1 cm, was used as a collection device. The distance between the tips of the two spinnerets was 12 cm and the applied voltages were +5 kV and −5 kV, respectively. The nozzle-to-collector distance was kept at about 18 cm and the rotation rate of the metal rod was 500 revolutions per minute. Environmental temperature and relative humidity were 20 ± 2 °C and 20–40%, respectively.
When the high-voltage power supplies began to work, the two kinds of spinnable liquids in the spinnerets were ejected under the action of the electric field. The Janus-structured fibers were obtained because of the interaction of opposite charges in the two kinds of fibers. Subsequently, the lower end of the Janus-structured microfiber was pulled slowly towards the metal rod and then was coiled around the metal rod using a metal wire. After that, the motor speed was tuned from 0 to 500 revolutions per minute, stage by stage. Eventually, the Janus-structured microfibers array was collected. The dynamic electrospinning process is vividly shown in Video 2.† To guarantee comparability, the two plastic syringes were equipped with 3 mL of spinnable liquids in all of the electrospinning processes for fabricating different specimens. After the liquids were completely exhausted, the experiment was stopped.
Fabrication of counterpart contradistinctive specimens
To underline the preponderance of the fabricated Janus-structured microfibers array in displaying diverse properties, the composite microfibers array (coded as S11), Janus-structured microfibers non-array (named as S12) and composite microfibers non-array (termed as S13), as contradistinctive specimens, were fabricated by conjugate electrospinning utilizing the rotating metal rod and wire mesh for array and non-array specimens as collecting devices, respectively. The composite microfibers array and non-array were prepared by isopycnic blending of spinnable liquid 1 (S1-a) and spinnable liquid 2 (S2-c). Both the Janus-structured microfibers array (S3) and non-array (S12) were fabricated by employing S1-a∥S2-c. Other conditions were the same as for fabrication of the Janus-structured microfibers array.Characterization methods
The phase compositions of the as-obtained specimens were identified by an X-ray powder diffractometer (XRD) with Cu Kα radiation. A thermogravimetric analyzer and differential scanning calorimeter (TG and DSC) were utilized to measure the thermal stability of the Janus-structured microfibers array (S3) under air atmosphere, and the heating rate was kept at 10 °C min−1. Optical microscopy (OM) and scanning electron microscopy (SEM) were used to observe the morphology and microstructure of the specimens. Electrical properties of the specimens were measured via the Hall effect measurement system. UV-visible spectra of PANI and Fe3O4 were measured using a UV-vis spectrophotometer. The magnetic and fluorescence performances of the specimens were analyzed using a vibrating sample magnetometer and fluorescence spectrophotometer, respectively. All of the above measurements were performed at room temperature.Results and discussion
X-ray diffraction analysis
The results of the XRD analysis of Fe3O4 NPs, the Janus-structured microfibers array (S3) and three contradistinctive specimens are shown in Fig. 2. The reflection peaks of the as-prepared Fe3O4 NPs can be readily indexed to the cubic phase of Fe3O4 (PDF#65-3107). No other characteristic diffraction peaks for impurities were found. XRD patterns of the Janus-structured microfibers array and non-array and of the composite microfibers array and non-array, reveal that all of them contain Fe3O4 NPs but the peak intensities are relatively weak due to the presence of amorphous Eu(TTA)3(TPPO)2, PANI and PMMA.Thermal analysis
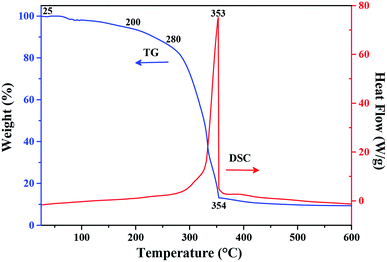
TG and DSC curves of the Janus-structured microfibers array (S3) were measured, as indicated in Fig. 3. When the temperature rises from 25 °C to 200 °C, the weight loss of Janus-structured microfiber arrays is 8.77% in initial heating owing to volatilization of residual solvents and adsorbed water on the surface of the specimen. As the temperature continues to rise from 200 to 280 °C, Eu(TTA)3(TPPO)2, PANI and PMMA begin to decompose, and the TG curve shows a slow weight loss of 11.34% until 280 °C. With further increase in temperature, rapid combustion and decomposition of these organics occurs, between 280 °C and 354 °C, accompanied by an intense and sharp exothermic peak in the DSC curve. The weight loss of the specimen is 69.09% from 280 to 354 °C. When the temperature exceeds 354 °C, no obvious weight loss from the TG curve and no thermal peak from the DSC curve are found, and the total weight loss of the specimen is 91.36%. The above results show that the safe operating temperature of the Janus-structured microfibers array is lower than 200 °C.Morphology and structure of the specimens
Fig. 4A reveals the SEM image of the Janus-structured microfibers array (S3), in which it can be clearly observed that the microfibers are arranged in the same orientation. Fig. 4B is a histogram of the diameter distribution of the Janus-structured microfibers, and the diameter is 10.92 ± 0.11 μm. Optical microscopy was used to more clearly observe the internal structure of the Janus-structured microfibers, as indicated in Fig. 4C. One side of the Janus-structured microfiber is composed of Eu(TTA)3(TPPO)2/PMMA as an insulating–luminescent section and the other side is formed with PANI/Fe3O4/PMMA as a conductive–magnetic section. In order to further investigate the structure of the Janus-structured microfibers in the array, EDS line scanning was also performed. As shown in Fig. 4D, the S and Fe elements represent PANI and Fe3O4, which only exist in the conductive–magnetic section of a Janus-structured microfiber, while the Eu element, only discovered in the insulating–luminescent section of a Janus-structured microfiber, represents Eu(TTA)3(TPPO)2. The above analyses further ascertain the Janus structure of the microfibers. | ||
| Fig. 4 (A) SEM image and (B) histogram of diameter of the Janus-structured microfibers array (S3). (C) OM image and (D) EDS line scan analysis of a single Janus-structured microfiber. | ||
The morphology of the composite microfibers array, Janus-structured microfibers non-array and composite microfibers non-array was also observed, as shown in Fig. S1a, S1d and S1g,† respectively. It can be seen that most of the composite fibers are directionally orientated, the Janus-structured microfibers have distinguishable Janus structure and the composite microfibers are disorderly stacked together. Fig. S1b, S1e and S1h† shows the histograms of the fiber diameters in the composite microfibers array, Janus-structured microfibers non-array and composite microfibers non-array, respectively, the diameters being 10.75 ± 0.07 μm, 11.79 ± 0.13 μm and 10.57 ± 0.05 μm, respectively. These values are very close to that of the Janus-structured microfibers in array. The OM image of a composite microfiber is shown in Fig. S1c,† and it can be clearly seen that the Eu(TTA)3(TPPO)2, PANI and Fe3O4 NPs are dispersed throughout the whole composite microfiber. EDS line scanning of the Janus-structured microfibers in the non-array was also carried out, as shown in Fig. S1f,† which is further proof of the Janus structure of the microfibers in the non-array.
Fig. 5A–C shows digital photographs of the real situation for the flexibility of the Janus-structured microfibers array. It can be seen that the bent Janus-structured microfibers array can be restored to its original shape without damage or breakage, which indicates that the fabricated Janus-structured microfibers array has good flexibility. The picture in Fig. 5D shows the red fluorescence emitted from the Janus-structured microfibers array under 362 nm excitation in darkness.
In order to study the mechanical stability of the prepared specimen, the breaking strength test along the length direction and diameter direction of the Janus-structured microfibers was measured, as illustrated in Fig. 6A and B, respectively. First, the specimen was cut into 4 cm × 4 cm pieces, then two ends of the specimen were fixed using two clamps, and the contact area between the clamp and the specimen was 0.5 cm × 4 cm. The test results show that the specimen is stable and did not break while the load weight in the length direction of the Janus-structured microfibers is less than 12.8994 g. However, the specimen is broken when the load weight of the diameter orientation of the Janus-structured microfibers exceeds 2.2550 g. Consequently, the Janus-structured microfibers array can bear bigger tensile force in the length orientation than in the diameter orientation.
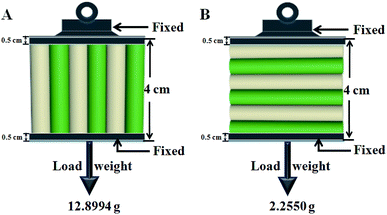 | ||
| Fig. 6 Breaking strength test along (A) the length direction and (B) the diameter direction of Janus-structured microfibers for the array. | ||
Fluorescence performance
In order to investigate the fluorescence performance of the Janus-structured microfibers array, a series of arrays including different percentages of Eu(TTA)3(TPPO)2 complex were prepared. The mass percentage of PANI to PMMA, and the mass fraction of Fe3O4 to PMMA were separately fixed at 30% and 0.3![[thin space (1/6-em)]](https://www.rsc.org/images/entities/char_2009.gif) :
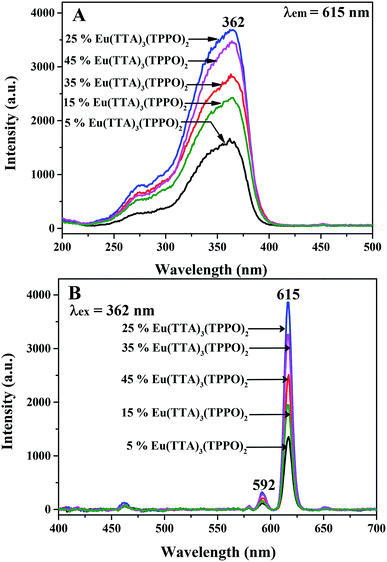
:![[thin space (1/6-em)]](https://www.rsc.org/images/entities/char_2009.gif) 1. The fluorescence spectra of Janus-structured microfiber arrays (S1–S5) with various mass ratios of Eu(TTA)3(TPPO)2 (5%, 15%, 25%, 35%, 45%, respectively) were obtained as depicted in Fig. 7A and B. As shown in Fig. 7A, there is a wide excitation band extending from 250 nm to 400 nm when the monitoring wavelength is 615 nm. The π → π* electron transition of the ligands produces the strongest peaks at 362 nm. The excitation intensities of the Janus-structured microfiber arrays increase with addition of more Eu(TTA)3(TPPO)2 when the mass ratios are 5%, 15% and 25%. Then, as the amount of Eu(TTA)3(TPPO)2 complex continues to increase, the excitation intensities of the Janus-structured microfiber arrays decrease. The reason for this is the occurrence of fluorescence quenching owing to the introduction of too much rare earth complex in the polymeric matrix.40 The emission peaks of the Janus-structured microfiber arrays were acquired under excitation with 362 nm ultraviolet light, as illustrated in Fig. 7B. Two major characteristic emission peaks for Eu3+ are identified at 592 and 615 nm, which result from the energy level transitions 5D0 → 7F1 and 5D0 → 7F2, respectively. It can also be seen that the variation in the regularity of the emission intensities is similar to that of the excitation intensities of the Janus-structured microfiber arrays with different mass ratios of Eu(TTA)3(TPPO)2. Thus, 25% Eu(TTA)3(TPPO)2 is chosen as the optimum percentage to prepare other Janus-structured microfiber arrays for further study.
1. The fluorescence spectra of Janus-structured microfiber arrays (S1–S5) with various mass ratios of Eu(TTA)3(TPPO)2 (5%, 15%, 25%, 35%, 45%, respectively) were obtained as depicted in Fig. 7A and B. As shown in Fig. 7A, there is a wide excitation band extending from 250 nm to 400 nm when the monitoring wavelength is 615 nm. The π → π* electron transition of the ligands produces the strongest peaks at 362 nm. The excitation intensities of the Janus-structured microfiber arrays increase with addition of more Eu(TTA)3(TPPO)2 when the mass ratios are 5%, 15% and 25%. Then, as the amount of Eu(TTA)3(TPPO)2 complex continues to increase, the excitation intensities of the Janus-structured microfiber arrays decrease. The reason for this is the occurrence of fluorescence quenching owing to the introduction of too much rare earth complex in the polymeric matrix.40 The emission peaks of the Janus-structured microfiber arrays were acquired under excitation with 362 nm ultraviolet light, as illustrated in Fig. 7B. Two major characteristic emission peaks for Eu3+ are identified at 592 and 615 nm, which result from the energy level transitions 5D0 → 7F1 and 5D0 → 7F2, respectively. It can also be seen that the variation in the regularity of the emission intensities is similar to that of the excitation intensities of the Janus-structured microfiber arrays with different mass ratios of Eu(TTA)3(TPPO)2. Thus, 25% Eu(TTA)3(TPPO)2 is chosen as the optimum percentage to prepare other Janus-structured microfiber arrays for further study.
Fig. 8 indicates the fluorescence decay curves of E–F–M Janus-structured microfiber arrays with different mass ratios of Eu(TTA)3(TPPO)2, which can be utilized to count the lifetime and study the fluorescence dynamics of the specimens. The specimens were excited at 362 nm and monitored at 615 nm, and the curves follow a single exponential decay:
It = I0![[thin space (1/6-em)]](https://www.rsc.org/images/entities/char_2009.gif) exp(−t/τ) exp(−t/τ) |
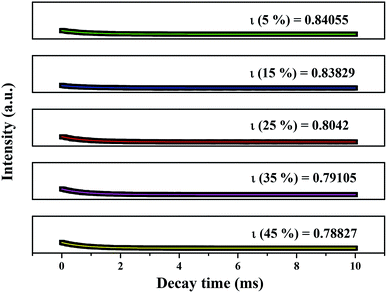 | ||
| Fig. 8 Fluorescence decay dynamics of the 5D0 → 7F2 transitions (λem = 615 nm) in the Janus-structured microfibers array with different mass percentages of Eu(TTA)3(TPPO)2. | ||
The fluorescence properties of the Janus-structured microfibers arrays doped with differing percentages of PANI (S3, S6, S7 and S8) were investigated, with the percentage of Eu(TTA)3(TPPO)2 and Fe3O4 to PMMA fixed at 25% and 0.3![[thin space (1/6-em)]](https://www.rsc.org/images/entities/char_2009.gif) :
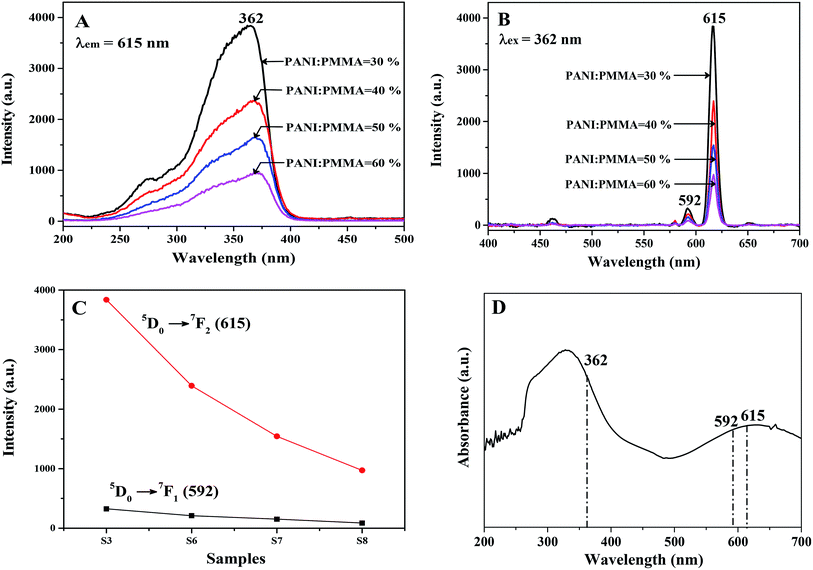
:![[thin space (1/6-em)]](https://www.rsc.org/images/entities/char_2009.gif) 1, respectively, as displayed in Fig. 9. It can be seen that the fluorescence intensities of the Janus-structured microfibers array decrease with addition of more PANI. Thus, the intensity of the characteristic emission peaks for each specimen is plotted to further observe the trend in the intensity of the characteristic peaks of Eu3+ with increasing PANI content, as shown in Fig. 9C. It can be clearly seen that the intensities of the two emission peaks (5D0 → 7F1 and 5D0 → 7F2) are reduced with the increase in PANI content. The reason for this is that PANI incorporated in the Janus-structured microfibers array has strong absorption of both the excitation and emission light, as shown in Fig. 9D, which shows the ultraviolet–visible absorbance spectrum of PANI. Thus, both ultraviolet light and visible light can be absorbed by PANI. In order to more intuitively observe the influence of PANI content on the fluorescence intensity of the Janus-structured microfibers array, a schematic diagram of the situation with exciting and emitting light in the array with diverse percentages of PANI is presented in Fig. S2.† As PANI content increases, the color of the as-prepared Janus-structured microfibers array gradually deepens, and the absorption of the excitation and emission light by PANI becomes stronger. This eventually leads to the decrease in fluorescence intensity of the specimens. Fig. 10 shows the CIE (Commission Internationale de l'Eclairage) chromaticity coordinates diagram of Janus-structured microfiber arrays with various percentages of PANI. It demonstrates that the emission colors of Janus-structured microfiber arrays shift a little with the introduction of more PANI, due to the stronger absorption of light at lower wavelength by PANI.
1, respectively, as displayed in Fig. 9. It can be seen that the fluorescence intensities of the Janus-structured microfibers array decrease with addition of more PANI. Thus, the intensity of the characteristic emission peaks for each specimen is plotted to further observe the trend in the intensity of the characteristic peaks of Eu3+ with increasing PANI content, as shown in Fig. 9C. It can be clearly seen that the intensities of the two emission peaks (5D0 → 7F1 and 5D0 → 7F2) are reduced with the increase in PANI content. The reason for this is that PANI incorporated in the Janus-structured microfibers array has strong absorption of both the excitation and emission light, as shown in Fig. 9D, which shows the ultraviolet–visible absorbance spectrum of PANI. Thus, both ultraviolet light and visible light can be absorbed by PANI. In order to more intuitively observe the influence of PANI content on the fluorescence intensity of the Janus-structured microfibers array, a schematic diagram of the situation with exciting and emitting light in the array with diverse percentages of PANI is presented in Fig. S2.† As PANI content increases, the color of the as-prepared Janus-structured microfibers array gradually deepens, and the absorption of the excitation and emission light by PANI becomes stronger. This eventually leads to the decrease in fluorescence intensity of the specimens. Fig. 10 shows the CIE (Commission Internationale de l'Eclairage) chromaticity coordinates diagram of Janus-structured microfiber arrays with various percentages of PANI. It demonstrates that the emission colors of Janus-structured microfiber arrays shift a little with the introduction of more PANI, due to the stronger absorption of light at lower wavelength by PANI.
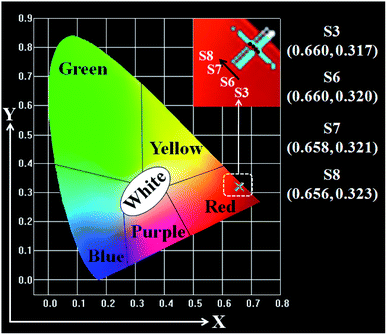 | ||
| Fig. 10 CIE chromaticity coordinates diagram of Janus-structured microfiber arrays with differing percentages of PANI. | ||
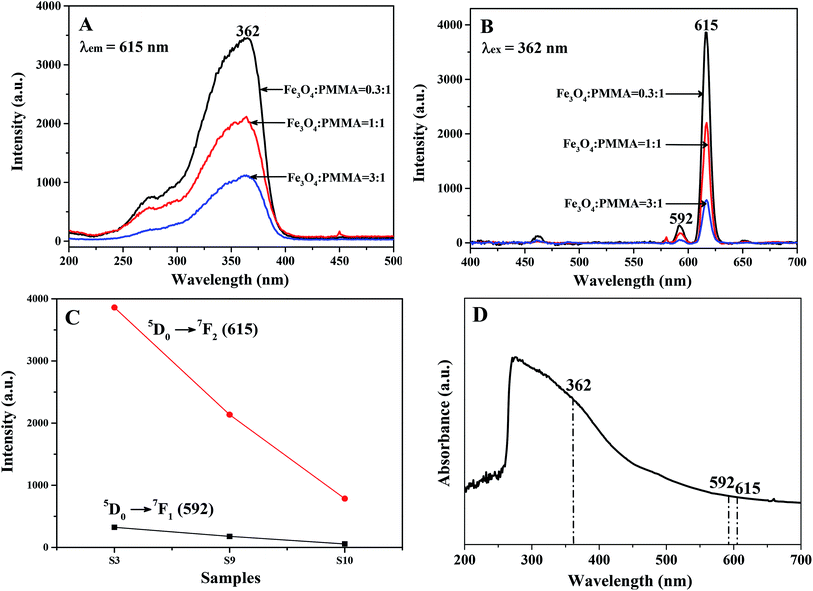
In addition, the Janus-structured microfiber arrays containing disparate mass ratios of Fe3O4 NPs (S3, S9 and S10), with the percentages of Eu(TTA)3(TPPO)2 and PANI to PMMA fixed at 25% and 30%, respectively, were prepared to investigate the effect of different contents of Fe3O4 NPs on the fluorescence intensity of the Janus-structured microfibers array. Fig. 11A and B show excitation spectra monitored at 615 nm and emission spectra excited by 362 nm light, respectively, for Janus-structured microfiber arrays containing different mass ratios of Fe3O4 NPs. The fluorescence intensities of the Janus-structured microfiber arrays decrease with addition of more Fe3O4 NPs. To clearly observe the trend in intensity of the characteristic peaks of Eu3+ with introduction of more Fe3O4 NPs, the intensity of the characteristic emission peaks for each specimen are plotted in Fig. 11C. The intensity of the two emission peaks (5D0 → 7F1 and 5D0 → 7F2) decreases upon adding more Fe3O4 NPs. The reason for this is that the black Fe3O4 NPs in the Janus-structured microfiber arrays have strong absorption of the excitation and emission light. Fig. 11D shows the ultraviolet-visible absorbance spectrum of Fe3O4 NPs and both ultraviolet and visible light can be absorbed by the Fe3O4 NPs. A schematic diagram of the situation with regard to the exciting light and emitting light in Janus-structured microfiber arrays with various mass fractions of Fe3O4 NPs is shown in Fig. S3,† further illustrating the effect of Fe3O4 content on fluorescence intensity. When the quantity of Fe3O4 NPs increases, the colors of the as-prepared specimens are gradually deepened and absorption of the excitation and emission light by the Fe3O4 NPs becomes stronger, resulting in a decrease in the fluorescence intensity of the specimens. The CIE chromaticity coordinates diagram for Janus-structured microfiber arrays with different mass fractions of Fe3O4 is given in Fig. 12. It shows that the emission colors of the Janus-structured microfibers array changes a little in the wake of adding more Fe3O4 NPs, owing to the stronger absorption of light at lower wavelengths by the Fe3O4 NPs.
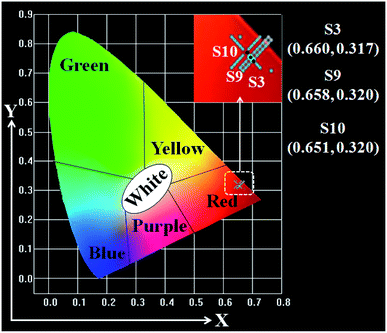 | ||
| Fig. 12 CIE chromaticity coordinates diagram of Janus-structured microfiber arrays with various mass fractions of Fe3O4 NPs. | ||
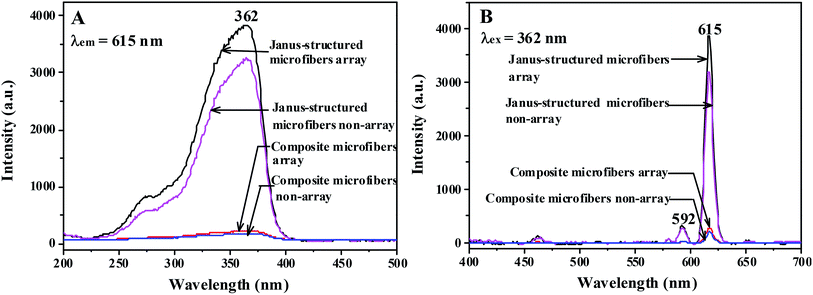
The fluorescence of the as-prepared Janus-structured microfiber arrays was compared with that of three contradistinctive specimens in order to illustrate the merits of the fluorescence performance of the arrays. As shown in Fig. 13, the intensities of both the excitation and emission peaks of the Janus-structured microfibers array are higher than those of the contradistinctive specimens. The emission intensity of the Janus-structured microfibers array is 1.21, 14.3 and 20.3 times higher than that of the Janus-structured microfibers non-array, the composite microfibers array and the composite microfibers non-array, respectively. This is a result of the strong absorption of light from the introduction of PANI and Fe3O4 NPs. Fig. S4† shows a schematic diagram for the exciting and emitting light in the Janus-structured microfibers array and three contradistinctive specimens. As depicted in Fig. S4A,† the Janus-structured microfibers array consists of tightly connected and oriented microfibers. It is hard for the exciting light to pass through the upper layer to the lower layer in these arrays. Thus, the emitting light is mainly derived from the upper Janus-structured microfibers. The Janus-structured microfibers non-array is composed of microfibers that are arranged irregularly and stacked together loosely, as shown in Fig. S4B.† In general, sectional exciting light traverses the gaps among the upper Janus-structured microfibers to the lower Janus-structured microfibers, resulting in weakening of the exciting light because of absorption by the upper Janus-structured microfibers. Similarly, the emitting light is also decreased. As a consequence, the fluorescence intensity of the Janus-structured microfibers non-array is a little weaker than that of the Janus-structured microfibers array. For this same reason, the fluorescence intensity of the composite microfibers array is slightly higher than that of the composite microfibers non-array. As indicated in Fig. S4C and D,† Eu(TTA)3(TPPO)2 complexes, PANI and Fe3O4 NPs are randomly dispersed in the microfibers, leading to decrease in the intensities of the exciting and emitting light in the composite microfibers array and non-array owing to the strong light absorption by PANI and Fe3O4 NPs. For the Janus-structured microfibers array and non-array, the extraordinary Janus structure can assist in greatly weakening the effect of PANI and Fe3O4 NPs on the fluorescence performance due to efficacious isolation of deep-colored materials from the rare earth complexes. Therefore, the Janus-structured microfibers array and non-array have a much stronger fluorescence intensity than the composite microfibers array and non-array. These new discoveries clearly demonstrate that Janus-structured microfibers possess superior features to composite microfibers for construction of multifunctional materials.
Magnetic analysis
The hysteresis loops for Fe3O4 NPs, Janus-structured microfiber arrays with various mass ratios of Fe3O4 NPs and contradistinctive specimens are revealed in Fig. S5,† and their saturation magnetizations are listed in Table 3. As can be seen from Table 3, with the introduction of more Fe3O4 NPs, the saturation magnetization of the Janus-structured microfibers array is increased from 1.52 emu g−1 to 15.44 emu g−1, showing that the Janus-structured microfibers array has adjustable magnetism. It is also observed that the Janus-structured microfibers array (S3) has a similar magnetic property to the contradistinctive specimens, owing to their identical components.| Specimen | Saturation magnetization (Ms)/(emu g−1) |
|---|---|
| Fe3O4 NPs | 46.8 |
Janus-structured microfibers array, (Fe3O4![[thin space (1/6-em)]](https://www.rsc.org/images/entities/char_2009.gif) : :![[thin space (1/6-em)]](https://www.rsc.org/images/entities/char_2009.gif) PMMA = 0.3 PMMA = 0.3![[thin space (1/6-em)]](https://www.rsc.org/images/entities/char_2009.gif) : :![[thin space (1/6-em)]](https://www.rsc.org/images/entities/char_2009.gif) 1, S3) 1, S3) |
1.52 |
Janus-structured microfibers array, (Fe3O4![[thin space (1/6-em)]](https://www.rsc.org/images/entities/char_2009.gif) : :![[thin space (1/6-em)]](https://www.rsc.org/images/entities/char_2009.gif) PMMA = 1 PMMA = 1![[thin space (1/6-em)]](https://www.rsc.org/images/entities/char_2009.gif) : :![[thin space (1/6-em)]](https://www.rsc.org/images/entities/char_2009.gif) 1, S9) 1, S9) |
6.24 |
Janus-structured microfibers array, (Fe3O4![[thin space (1/6-em)]](https://www.rsc.org/images/entities/char_2009.gif) : :![[thin space (1/6-em)]](https://www.rsc.org/images/entities/char_2009.gif) PMMA = 3 PMMA = 3![[thin space (1/6-em)]](https://www.rsc.org/images/entities/char_2009.gif) : :![[thin space (1/6-em)]](https://www.rsc.org/images/entities/char_2009.gif) 1, S10) 1, S10) |
15.44 |
Janus-structured microfibers non-array, (Fe3O4![[thin space (1/6-em)]](https://www.rsc.org/images/entities/char_2009.gif) : :![[thin space (1/6-em)]](https://www.rsc.org/images/entities/char_2009.gif) PMMA = 0.3 PMMA = 0.3![[thin space (1/6-em)]](https://www.rsc.org/images/entities/char_2009.gif) : :![[thin space (1/6-em)]](https://www.rsc.org/images/entities/char_2009.gif) 1, S12) 1, S12) |
1.47 |
Composite microfibers array, (Fe3O4![[thin space (1/6-em)]](https://www.rsc.org/images/entities/char_2009.gif) : :![[thin space (1/6-em)]](https://www.rsc.org/images/entities/char_2009.gif) PMMA = 0.3 PMMA = 0.3![[thin space (1/6-em)]](https://www.rsc.org/images/entities/char_2009.gif) : :![[thin space (1/6-em)]](https://www.rsc.org/images/entities/char_2009.gif) 1, S11) 1, S11) |
1.39 |
Composite microfibers non-array, (Fe3O4![[thin space (1/6-em)]](https://www.rsc.org/images/entities/char_2009.gif) : :![[thin space (1/6-em)]](https://www.rsc.org/images/entities/char_2009.gif) PMMA = 0.3 PMMA = 0.3![[thin space (1/6-em)]](https://www.rsc.org/images/entities/char_2009.gif) : :![[thin space (1/6-em)]](https://www.rsc.org/images/entities/char_2009.gif) 1, S13) 1, S13) |
1.40 |
Electrical conductance analysis
The electrical conductance of Janus-structured microfiber arrays containing disparate percentages of PANI and contradistinctive specimens was measured by the Hall effect system, and the test method for measuring electrical conductance along the X direction and Y direction of the microfibers in the array is depicted in Fig. 14, along with the length direction and diameter direction of the Janus-structured microfibers. As shown in Fig. 14, the specimen is cut into a square measuring 1 cm × 1 cm and two pieces of tin sheet with an area of 0.4 cm × 1 cm are pressed and fixed onto the specimen using conducting resin. Then, the two stylets of the measurement system are pressed against the two tin sheets. The conductances in the X and Y directions of the Janus-structured microfiber arrays containing different percentages of PANI and the contradistinctive specimens are listed in Table 4. These are calculated with the formula: G = I/U, where G, I and U represent the conductance, electric current and voltage, respectively. As we know, the key factor for the electrical conduction of PANI is the charge transport through the conductive network.42,43 It can be seen from Table 4 that the conductance of the Janus-structured microfibers array in the X direction increases with addition of more PANI, but there is little change in conductance in the Y direction. It is evident that the anisotropic conduction can be modulated by introducing more PANI, and the conductance in the X direction of the Janus-structured microfiber arrays containing different percentages of PANI (S3, S6, S7, S8) is ca. 103, 104, 105, 106 higher than that in the Y direction. The ratio of conductance in the X direction to that in the Y direction for the composite microfibers array is 9.4, showing weak anisotropy. The conductance ratios of the X direction to the Y direction for the Janus-structured microfibers non-array and composite microfibers non-array are 0.65 and 0.83, respectively, which is ca. 1, meaning that no anisotropy is found.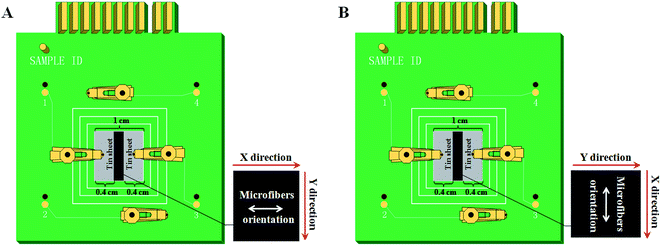 | ||
| Fig. 14 Test methods for electrical conductance along the (A) X direction and (B) Y direction of the microfibers in array. | ||
| Specimen | X (S) | Y (S) | X/Y | Anisotropic level |
|---|---|---|---|---|
| Janus-structured microfibers array | ||||
(S3, PANI![[thin space (1/6-em)]](https://www.rsc.org/images/entities/char_2009.gif) : :![[thin space (1/6-em)]](https://www.rsc.org/images/entities/char_2009.gif) PMMA = 30%) PMMA = 30%) |
1.71 × 10⁻⁶ | 5.75 × 10⁻¹⁰ | 2.97 × 10³ | Medium |
(S6, PANI![[thin space (1/6-em)]](https://www.rsc.org/images/entities/char_2009.gif) : :![[thin space (1/6-em)]](https://www.rsc.org/images/entities/char_2009.gif) PMMA = 40%) PMMA = 40%) |
4.91 × 10⁻⁶ | 1.37 × 10⁻¹⁰ | 3.58 × 10⁴ | Medium |
(S7, PANI![[thin space (1/6-em)]](https://www.rsc.org/images/entities/char_2009.gif) : :![[thin space (1/6-em)]](https://www.rsc.org/images/entities/char_2009.gif) PMMA = 50%) PMMA = 50%) |
2.08 × 10⁻⁵ | 1.69 × 10⁻¹⁰ | 1.65 × 10⁵ | Strong |
(S8, PANI![[thin space (1/6-em)]](https://www.rsc.org/images/entities/char_2009.gif) : :![[thin space (1/6-em)]](https://www.rsc.org/images/entities/char_2009.gif) PMMA = 60%) PMMA = 60%) |
3.37 × 10⁻⁴ | 2.04 × 10⁻¹⁰ | 2.61 × 10⁶ | Very strong |
![[thin space (1/6-em)]](https://www.rsc.org/images/entities/char_2009.gif) |
||||
| Composite microfibers array | ||||
(S11, PANI![[thin space (1/6-em)]](https://www.rsc.org/images/entities/char_2009.gif) : :![[thin space (1/6-em)]](https://www.rsc.org/images/entities/char_2009.gif) PMMA = 30%) PMMA = 30%) |
1.42 × 10⁻⁸ | 1.51 × 10⁻⁹ | 9.40 | Weak |
![[thin space (1/6-em)]](https://www.rsc.org/images/entities/char_2009.gif) |
||||
| Janus-structured microfibers non-array | ||||
(S12, PANI![[thin space (1/6-em)]](https://www.rsc.org/images/entities/char_2009.gif) : :![[thin space (1/6-em)]](https://www.rsc.org/images/entities/char_2009.gif) PMMA = 30%) PMMA = 30%) |
1.38 × 10⁻⁶ | 2.11 × 10⁻⁶ | 0.65 | None |
![[thin space (1/6-em)]](https://www.rsc.org/images/entities/char_2009.gif) |
||||
| Composite microfibers non-array | ||||
(S13, PANI![[thin space (1/6-em)]](https://www.rsc.org/images/entities/char_2009.gif) : :![[thin space (1/6-em)]](https://www.rsc.org/images/entities/char_2009.gif) PMMA = 30%) PMMA = 30%) |
1.59 × 10⁻¹⁰ | 1.91 × 10⁻¹⁰ | 0.83 | None |
It is known from the literature that the anisotropic conduction of the prepared specimens is due to the fact that the electrons can move unrestrained and unobstructed in the X direction of the Janus-structured microfibers array, but that the movement of electrons in the Y direction is blocked due to the presence of many interfaces in the array.8 As indicated in Fig. 15A, each Janus-structured microfiber in the array is composed of a conductive–magnetic section and an insulating–luminescent section. The current flow direction is consistent with the length direction of the Janus-structured microfibers, so the movement of electrons along the X direction is not hindered and thus the high conductance of the Janus-structured microfibers array in the X direction is obtained. However, the conductive–magnetic section is insulated from a large number of insulating–luminescent sections in the Y direction, thus impeding the movement of electrons and leading to low conductance in the Y direction. Thus, the anisotropy of the Janus-structured microfiber array is very strong. For the Janus-structured microfibers non-array, the microfibers in the non-array are randomly stacked together, as shown in Fig. 15B, so the conductance of the Janus-structured microfibers non-array is similar in all directions owing to the uncertainty of the current flow direction. This results in the Janus-structured microfibers non-array having almost no conductive anisotropy. As seen in Fig. 15C and D, Eu(TTA)3(TPPO)2 and Fe3O4 NPs are distributed throughout the microfibers in the composite microfibers array and non-array, which hinders the formation of PANI sequential conductive networks, resulting in the weak conductive anisotropy for the composite microfibers array and no conductive anisotropy for the composite microfibers non-array. Therefore, adjustable and higher anisotropic conduction is obtained for the Janus-structured microfibers array.
 | ||
| Fig. 15 Conductive schematic diagram of Janus-structured microfibers array (A) and non-array (B), and composite microfibers array (C) and non-array (D). | ||
Based on the above results obtained, it is gratifying to find that the Janus-structured microfibers array possesses higher anisotropic conduction and enhanced fluorescence intensity than the Janus-structured microfibers non-array, the composite microfibers array and the composite microfibers non-array, although they have similar magnetic properties.
Formation mechanism for the Janus-structured microfibers array
A sequence of conditional experiments has been performed to increase the pairing rate of the Janus-structured fibers. When the distance between the two spinnerets is too far (>15 cm) or the voltage is too low (<5 kV), the two oppositely charged fibers cannot attract each other to form a Janus-structured fiber. While the distance between the two spinnerets is fixed at 15 cm, if the voltage is too high or the viscosity of the spinnable liquid is too low, jets from the spinnerets split into multiple fibers, which decreases the pairing rate of the Janus-structured fibers. Eventually, after some experimental conditions are optimized, the formation mechanism is proposed.The formation mechanism diagram for the Janus-structured microfibers array is presented in Fig. 16. In the conjugate electrospinning process, when the positive and negative voltages are applied to the two spinnable liquids and the electric field force exceeds the critical value, the electrostatic force will overcome the surface tension of the of the spinnable liquids. This results in charged jets being ejected from two relatively placed spinnerets, in which the jet is whipping due to the instability of the electrospinning, as shown in Fig. 16a. Just two strands of jets with opposite charges are ejected from the nozzles, which are attracted and stuck together to form a Janus-structured microfiber in the wake of some solvent evaporation, and part of the jet is solidified. The newly produced Janus-structured microfiber is approximately electroneutral throughout the spinning process, making it subject to little influence from the electric field force. When the Janus-structured microfiber has fallen on the top of the metal wire, the metal wire is slowly pulled down to ensure continuity of the Janus-structured microfiber, as depicted in Fig. 16b. Finally, the Janus-structured microfiber is coiled on the collector and the speed controller is adjusted to make the speed up to 500 rpm. Following the process of electrospinning, the Janus-structured microfibers array with E–F–M tri-functionality is acquired, as seen in Fig. 16c.
Conclusions
In summary, a conjugate electrospinning technique is established to realize a high pairing rate for Janus-structured microfibers and their arrays with E–F–M tri-functionality of adjustable electrically anisotropic conduction, magnetism and enhanced fluorescence. Each Janus-structured microfiber in the array comprises PANI/Fe3O4/PMMA as a conductive–magnetic section and Eu(TTA)3(TPPO)2/PMMA as an insulating–luminescent section. The diameter of the Janus-structured microfibers in the array is 10.92 ± 0.11 μm. While the saturation magnetizations of the specimens are similar, the fluorescence intensity of the Janus-structured microfibers array is 14.3 and 20.3 times higher than the counterpart composite microfibers array and non-array, respectively, due to strong absorption of light by introducing PANI and Fe3O4 NPs. In addition, the Janus-structured microfibers array has 1.21 times higher emission intensity than the Janus-structured microfibers non-array because of the oriented arrangement of the Janus-structured microfibers in the array. Moreover, the anisotropic conduction and magnetism of the Janus-structured microfibers array can be modulated by tuning the different percentages of PANI and mass ratios of Fe3O4 NPs, respectively. More significantly, the preparation technique for the Janus-structured microfibers can be generalized to fabricate other Janus-structured multifunctional materials.Conflicts of interest
There are no conflicts of interest to declare.Acknowledgements
This work was financially supported by the National Natural Science Foundation of China (51573023, 51803012), the Natural Science Foundation of Jilin Province (20170101101JC, 20180520011JH), the Science and Technology Research Planning Project of the Education Department of Jilin Province during the 13th five-year plan period (JJKH20170608KJ, JJKH20181122KJ), and the Innovative Foundation (XJJLG-2017-04) and Youth Foundation (XQNJJ-2016-01, XQNJJ-2017-17) of Changchun University of Science and Technology.Notes and references
- A. D. Ferreira, P. R. O. Nóvoa and A. T. Marques, Compos. Struct., 2016, 151, 3–35 CrossRef.
- R. M. Teresa, L. M. Antonio, N. Nagiah, F. G. Alberto and F. F. Jorge, Anal. Chim. Acta, 2018, 1015, 66–73 CrossRef PubMed.
- H. H. Lau, R. Murney, N. L. Yakovlev, M. V. Novoselova, S. H. Lim, N. Roy, H. Singh, G. B. Sukhorukov, B. Haigh and M. V. Kiryukhin, J. Colloid Interface Sci., 2017, 505, 332–340 CrossRef CAS PubMed.
- T. L. Zhou, H. Wei, H. P. Tan, X. Wang, H. B. Zeng, X. H. Liu, S. Nagao, H. Koga, M. Nogi, T. Sugahara and K. Suganuma, 2D Mater., 2018, 5, 035013 CrossRef.
- L. L. Meng, R. X. Bian, C. Guo, B. J. Xu, H. Liu and L. Jiang, Adv. Mater., 2018, 30, 1706938 CrossRef PubMed.
- Q. L. Ma, J. X. Wang, X. T. Dong, W. S. Yu and G. X. Liu, Adv. Funct. Mater., 2015, 25, 2436–2443 CrossRef CAS.
- X. H. Li, J. Cai, Y. Y. Shi, Y. Yue and D. Y. Zhang, ACS Appl. Mater. Interfaces, 2017, 9, 1593–1601 CrossRef CAS PubMed.
- P. B. Liu, Y. Huang, J. Yan and Y. Zhao, J. Mater. Chem. C, 2016, 4, 6362–6370 RSC.
- X. D. Wang, X. Y. Jing, X. Y. Zhang, Q. Liu, J. Y. Liu, D. L. Song, J. Wang and L. H. Liu, Mater. Chem. Phys., 2016, 177, 213–219 CrossRef CAS.
- H. Ji, R. Zhao, N. Zhang, C. X. Jin, X. F. Lu and C. Wang, NPG Asia Mater., 2018, 10, 749–760 CrossRef CAS.
- J. Tian, Q. L. Ma, W. S. Yu, X. T. Dong, Y. Yang, B. Zhao, J. X. Wang and G. X. Liu, New J. Chem., 2017, 41, 13983–13992 RSC.
- X. Xi, Q. L. Ma, X. T. Dong, D. Li, W. S. Yu, J. X. Wang and G. X. Liu, J. Mater. Sci.: Mater. Electron., 2018, 29, 7119–7129 CrossRef CAS.
- K. S. Praveen, P. Singh, K. S. Akhilesh, K. S. Sunil, B. R. Shyam and R. Prakash, J. Colloid Interface Sci., 2017, 491, 199–206 CrossRef PubMed.
- Y. Gong, J. W. Dai, H. Li, X. Wang, H. R. Xiong, Q. Y. Zhang, P. H. Li, C. F. Yi, Z. S. Xu, H. B. Xu and P. K. Chu, J. Biomater. Appl., 2015, 30, 201–211 CrossRef CAS PubMed.
- S. H. Jiang, Y. M. Chen, G. G. Duan, C. T. Mei, A. Greiner and S. Agarwal, Polym. Chem., 2018, 9, 2685–2720 RSC.
- F. F. Wei, A. K. Mallik, D. J. Liu, Q. Wu, G. D. Peng, G. Farrell and Y. Semenova, Sci. Rep., 2017, 7, 4725 CrossRef PubMed.
- M. W. Lee, S. An, Y. Kim, S. S. Yoon and A. L. Yarin, Chem. Eng. J., 2018, 334, 1093–1100 CrossRef CAS.
- B. Jalvo, A. P. Mathew and R. Rosal, J. Membr. Sci., 2017, 544, 261–271 CrossRef CAS.
- Y. Cao, H. M. Lu, Q. S. Hong, J. J. Bai, J. R. Wang and X. D. Li, J. Power Sources, 2017, 368, 78–87 CrossRef CAS.
- N. Lv, J. L. Zhang, G. M. Li, X. Wang and J. Z. Ni, J. Phys. Chem. C, 2017, 121, 11926–11931 CrossRef CAS.
- G. Moradi, S. Zinadini, L. Rajabi and S. Dadari, Appl. Surf. Sci., 2018, 427, 830–842 CrossRef CAS.
- Z. Li, J. W. Zhang, J. Shu, J. P. Chen, C. H. Gong, J. H. Guo, L. G. Yu and J. W. Zhang, J. Power Sources, 2018, 381, 1–7 CrossRef CAS.
- Y. W. Liu, Q. L. Ma, M. Yang, X. T. Dong, Y. Yang, J. X. Wang, W. S. Yu and G. X. Liu, Chem. Eng. J., 2016, 284, 831–840 CrossRef CAS.
- T. T. Cui, Z. J. Zhu, R. Cheng, Y. L. Tong, G. Peng, C. F. Wang and S. Chen, ACS Appl. Mater. Interfaces, 2018, 10, 30785–30793 CrossRef CAS PubMed.
- X. J. Wu, Y. J. Xu, Y. Hu, G. Wu, H. Y. Cheng, Q. Yu, K. Zhang, W. Chen and S. Chen, Nat. Commun., 2018, 9, 4573 CrossRef PubMed.
- Z. Y. Liu, D. P. Qi, G. Y. Hu, H. Wang, Y. Jiang, G. Chen, Y. F. Luo, X. J. Loh, B. Liedberg and X. D. Chen, Adv. Mater., 2018, 30, 1704229 CrossRef PubMed.
- R. X. Xie, P. D. Xu, Y. P. Liu, L. L. Li, G. A. Luo, M. Y. Ding and Q. L. Liang, Adv. Mater., 2018, 30, 1705082 CrossRef PubMed.
- T. Wu, J. L. Zhang, Y. F. Wang, B. B. Sun, X. R. Guo, Y. Morsi, H. E. Hamshary, M. E. Newehy and X. M. Mo, J. Biomed. Nanotechnol., 2017, 13, 303–312 CrossRef CAS PubMed.
- Y. L. Chen, Y. M. Cui, Y. S. Jia, K. Zhan, H. Zhang, G. X. Chen, Y. D. Yang, M. Wu and H. M. Ni, J. Appl. Polym. Sci., 2014, 131, 8804–8812 Search PubMed.
- L. Wei and X. H. Qin, Text. Res. J., 2016, 86, 1885–1898 CrossRef CAS.
- X. L. Song, W. S. Liu, J. Wang, S. H. Xu, B. Liu, Q. S. Cai and Y. Z. Ma, Mater. Lett., 2018, 212, 20–24 CrossRef CAS.
- Y. M. Zhou, J. X. He, H. B. Wang, K. Qi, B. Ding and S. Z. Cui, Mater. Des., 2016, 95, 591–598 CrossRef CAS.
- L. B. Fan, Q. L. Ma, J. Tian, D. Li, X. Xi, X. T. Dong, W. S. Yu, J. X. Wang and G. X. Liu, RSC Adv., 2017, 7, 48702–48711 RSC.
- Q. T. Wang, Y. T. Geng, J. H. Li, M. Z. Yin, Y. S. Hu, Y. X. Liu and K. Pan, Nanotechnology, 2018, 29, 135702 CrossRef PubMed.
- G. Y. Chen, Y. Xu, D. G. Yu, D. F. Zhang and P. Nicholas, Chem. Commun., 2015, 51, 4623–4626 RSC.
- J. Y. Liu, Q. L. Ma, J. Tian, X. Xi, D. Li, X. T. Dong, W. S. Yu, X. L. Wang, J. X. Wang and G. X. Liu, RSC Adv., 2018, 8, 22887–22896 RSC.
- X. Xi, J. X. Wang, X. T. Dong, Q. L. Ma, W. S. Yu and G. X. Liu, Chem. Eng. J., 2014, 254, 259–267 CrossRef CAS.
- Q. L. Ma, W. S. Yu, X. T. Dong, J. X. Wang and G. X. Liu, Nanoscale, 2014, 6, 2945–2952 RSC.
- D. G. Yu, J. J. Li, M. Zhang and G. R. Williams, Chem. Commun., 2017, 53, 4542–4545 RSC.
- H. Shao, W. S. Yu, Q. L. Ma, X. L. Wang, X. T. Dong, Z. L. Liu, J. X. Wang, G. X. Liu and L. M. Chang, RSC Adv., 2017, 7, 32850–32860 RSC.
- Z. J. Wang, Q. L. Ma, X. T. Dong, D. Li, X. Xi, W. S. Yu, J. X. Wang and G. X. Liu, ACS Appl. Mater. Interfaces, 2016, 8, 26226–26234 CrossRef CAS PubMed.
- X. B. Li, Q. L. Ma, J. Tian, X. Xi, D. Li, X. T. Dong, W. S. Yu, X. L. Wang, J. X. Wang and G. X. Liu, Nanoscale, 2017, 9, 18918–18930 RSC.
- X. Xi, W. S. Yu, D. Li, Q. L. Ma, X. T. Dong, J. X. Wang and G. X. Liu, New J. Chem., 2018, 42, 18708–18716 RSC.
Footnote |
| † Electronic supplementary information (ESI) available. See DOI: 10.1039/c9ra01147a |
| This journal is © The Royal Society of Chemistry 2019 |

