 Open Access Article
Optical and dielectric properties of NaCoPO4 in the three phases α, β and γ
A. Ajmia,
K. Karoui a,
K. Khirounib and
A. Ben Rhaiem
 *a
*a
aLaboratory LaSCOM, University of Sfax, BP1171, 3000, Sfax, Tunisia. E-mail: abdallahrhaiem@yahoo.fr
bLaboratory of Inorganic Chemistry, University of Sfax, BP1171, 3000, Sfax, Tunisia
First published on 14th May 2019
Abstract
In this work, we are interested in the synthesis of monophosphate α-NaCoPO4, β-NaCoPO4 and γ-NaCoPO4 compounds by mechanochemical method and their characterization by X-ray powder diffraction patterns. These compounds are crystallized in the orthorhombic, hexagonal and monoclinic system, in Pnma, P65 and P21/n space groups, respectively. The optical properties were measured by means of the UV-vis absorption spectrometry in order to deduce the absorption coefficient α and optical band gap Eg. The calculated values of the indirect band gaps (Egi) for three samples were estimated at 4.71 eV, 4.63 eV and 3.8 for compounds α, β and γ, respectively. The Tauc model was used to determine the optical gap energy of the synthesized compounds. Then, the results of the dielectric proprieties measured by varying the frequency are described.
1. Introduction
Phosphor materials have been discovered as phosphors, which combine with near-UV lighting chips in solid-state for use in white light-emitting diodes (LEDs). Among them, orthophosphates, with the general formula ABPO4 (A: monovalent cation and B: divalent cation), have gained great interest in recent years, owing to their rich structural chemistry and potential applications in optics, ceramics, magnetic materials, ferroelectricity, catalysts etc.1–5 The principle of the crystal structure of phosphate ABPO4 depends on the nature of A and B metals. Thus, the oxygen coordination environment with a bivalent metal cation can be tetradra, pentahedra or octahedra, defining the olivine, tridymite, and maricite or zeolite type structure. For example, sodium cobalt(II) phosphate is commonly known in four different structures, as follows: the first is α-NaCoPO4 determined by Hammond and Barbier,6 which crystallizes in the space group Pnma composed of edge-sharing chains of CoO6 octahedral cross –linked by PO4 tetrahedral, and sodium ions Na+, located in 10-coordinate cavities. The second polymorph is β-NaCoPO4 (ref. 6) which belongs to the space group P61 and P65. This structure consists of P and Co atoms, occupying the tetrahedral sites while the Na atoms are located in the cavities of tetrahedral framework. The third polymorph (γ-NaCoPO4), which crystallizes in the space group P21/n, has the same topology as that of zeolite ABW-type structure.7 The phosphorus and the cobalt atoms are located in the tetrahedral site, while the sodium ones are located in the channels.To our knowledge, the physical properties of NaCoPO4 are not reported in the literature. However, this compound is one of the ABPO4-type of phosphate compounds which can be considered as an efficient host candidate for LEDs.
In fact, in this study, the three compounds α-NaCoPO4, β-NaCoPO4 and γ-NaCoPO4 are prepared by means of a mechano-chemical method. The structure of the prepared samples is studied using an X-ray powder diffraction (XRD). The optical properties, under UV-visible irradiation, are reported. The main aim of this study is to determine some key optical parameters, such as, the optical energy gap (Eg), and the Urbach energy (EU). In order to obtain an overview of the dielectric dispersion phenomenon, the dielectric properties, pertaining to the three phases (α, β and γ) in the frequency regime studied, are evaluated and then the results are correlated.
2. Experimental
2.1. Synthesis of material
The α-NaCoPO4, β-NaCoPO4 and γ-NaCoPO4 compounds were carried out via a mechanochemical method that uses a planetary ball mill.The raw materials are: Na2CO3 (Sigma-Aldrich, 99%), Co2O4 (Sigma-Aldrich, ≥97%) and (NH4)2HPO4 (Sigma-Aldrich, ≥99%).
The following reaction describes the synthesis of these compounds:
| 2NH4H2PO4 + Na2CO3+ Co2O4 → 2NaCoPO4 + 2NH3 + 3H2O + CO2 | (1) |
The appropriate amount of these reagents was weighed in stoichiometric ratio and well ground into a fine powder in an agate mortar.
The obtained powder was heated in an electric furnace, at a temperature of 573 K, for 8 h, in order to dislodge NH3, H2O, and CO2.
After heating, the mixture was mechanically activated, using a planetary ball mill. To prevent the heating and sticking of the powder to the container walls and balls, and the powder agglomeration during the process, the milling sequence was selected, such as 10 min of milling, followed by 5 min of stop period. The experiments were performed using a hardened steel vial with five steel balls. The mixture of powders was milled for 12 h and the rotational speed was 500 rpm.
The obtained powder was compressed into cylindrical pellets, having a diameter of 8 mm, using a 3 ton per cm2 uniaxial pressure to promote the reaction, before being heated at a temperature of 873 K for 4 days for α-NaCoPO4, 1023 K for 4 days for β-NaCoPO4 and 1023 K for 5 days for γ-NaCoPO4, then cooled slowly at a rate of 5 °C min−1 at room temperature.
2.2. Characterization techniques
The crystalline proprieties were investigated at room temperature via an X-ray powder diffraction (XRD) that uses a Panalytical X'Pert Prompd powder diffractometer operating with CuKα radiation (λα1 = 1.540600 Å, λα2 = 1.544390 Å) from 20 to 80 Bragg's angle range. The unit cell parameters of the synthesized compounds were refined via the least square method powder data.The optical properties were measured at room temperature, using a UV-3101PC scanning spectrophotometer that has a dual-beam monochromator, covering a spectrum from 200 nm to 2400 nm and using two sources: (i) xenon lamp for the UV-visible domain and (ii) halogen lamp for the infrared range. This technique makes it possible to determine the absorbance (A) and the reflectance (R). The optical absorption spectrum of the α-NaCoPO4, β-NaCoPO4 and γ-NaCoPO4 compounds was recorded at room temperature in powder; used in the form of films.
The dielectric measurements, performed in a wide range of frequency, were deduced from the admittance spectroscopy using an Agilent 4294A analyzer and Janis VPF800 cryostat. Before that, a thin Al layer with a disc shape was deposited on both sides of each sample. The amplitude of the applied alternative signal was fixed at 0.05 V.
3. Results and discussion
3.1. X-ray diffraction analysis
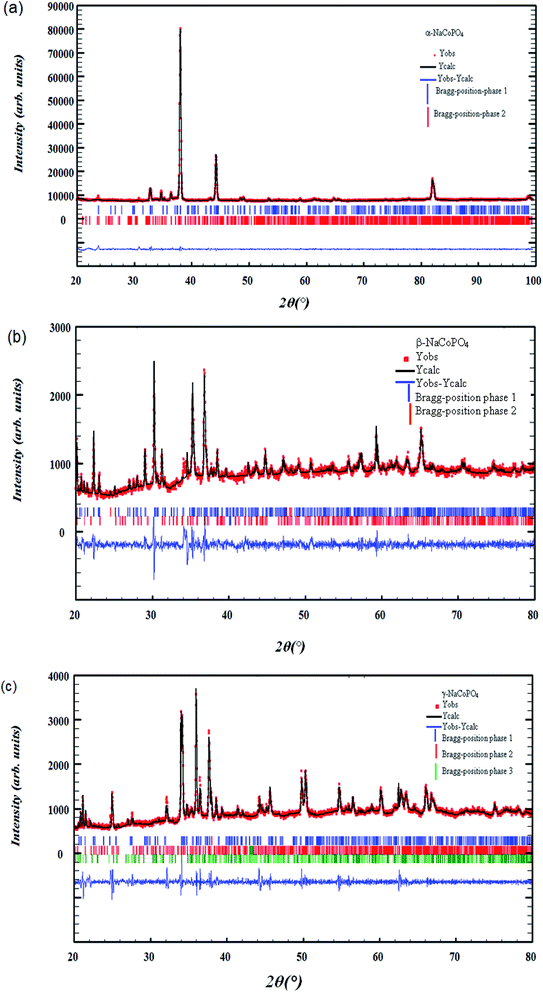
The X-ray diffraction of α-NaCoPO4, β-NaCoPO4 and γ-NaCoPO4 compounds was carried out using a Panalytical X'Pert Prompd and then analyzed by Full Proof software.8 The pseudo-Voigt function was used for the simulation of the peak shapes. The refined parameters were: scale factor, zero shift, lattice constants, peak profile, asymmetry parameters, amplitudes of the modes transforming according to the irreps and independent isotropic atomic displacement parameters.Room-temperature X-ray Diffraction (XRD) measurements were conducted over a 2θ range of 20°–100° for α-NaCoPO4 and a range of 20–80 for β-NaCoPO4 and γ-NaCoPO4 oxide using a Cu-Kα source, as shown in Fig. 1((a)–(c)).
All the reflection peaks, corresponding to 2θ values, were crystallized in the orthorhombic, hexagonal and monoclinic system, at room temperature, with space group Pnma, P65 and P21/n, respectively.
The quality factor, indicating the concurrence between the observed and the calculated profiles, was χ2 = 2.49, χ2 = 2.89 and χ2 = 3.14 respectively. The obtained reliability factors and lattice parameters of the three compounds, given in Table 1, are in good agreement with the published results.6,7
| Formula | α-NaCoPO4 | β-NaCoPO4 | γ-NaCoPO4 |
|---|---|---|---|
| Unit lattice parameters (Å) | a = 8.951(7) | a = 10.174(1) | a = 5.243(6) |
| b = 6.891(8) | b = 10.174(1) | b = 9.988(5) | |
| c = 5.037(6) | c = 23.878(6) | c = 7.471(9) | |
| α = β = γ = 90° | α = β = 90°, γ = 120° | α = γ = 90°, β = 90.779° | |
| Unit cell volume (Å3) | V = 310.688(9) | V = 2471.618(3) | V = 391.234(4) |
| Crystal system | Orthorhombic | Hexagonal | Monoclinic |
| Space group | Pnma | P65 | P21/n |
| Formula units, Z | 4 | 24 | 4 |
| RB | 0.68 | 14.64 | 5.714 |
| Rf | 2.15 | 8.015 | 3.612 |
| χ2 | 2.49 | 2.89 | 3.14 |
As can be clearly seen, Fig. 1((a)–(c)) shows the appearance of other identified weak reflections due to the presence of impurities related to Na4Co3 (PO4)2P2O7, red-NaCoPO4 and Na2Co8 (PO4)6 compounds.
3.2. Structural description
The α-NaCoPO4 compound crystallizes in Pnma space group with cell parameters: a = 8.951(7) Å, b = 6.891(8) Å, c = 5.037(6) Å and Z = 4. It consists of edge sharing chains of [CoO6] octahedral parallel to the [010] direction, as shown in Fig. 2(a). These chains are cross-connected by the PO4 tetrahedral, giving rise to large ten-coordinate cavities in which the Na+ ions are located. However, β-NaCoPO4 compound was found to have a hexagonal system with a space group P65, the lattice parameters a = b 10.174(1) Å and c = 23.878(6) Å. The γ-NaCoPO4 compound crystallizes in monoclinic system with a space group P21/n, the cell parameters a = 5.243 (6) Å, b = 9.988 (5) Å, c = 7.471 (7) Å, β = 90.210(4) and Z = 4. The structures of these compounds are built up of two types of tetrahedral PO4 and CoO4 corner-linked by common oxygen. The packing of MO4 (M = P, Co) tetrahedral in this structure relatively delimits the large “tunnels” where the Na cations are located (Fig. 2(b and c)).3.3. Optical absorbance spectra
Optical properties are one of the most important factors to evaluate the light efficiency. Fig. 3 reveals the experimental UV-vis absorption spectrum of α-NaCoPO4, β-NaCoPO4 and γ-NaCoPO4 compounds in 200–800 nm wavelength range, at room temperature. The obtained spectra exhibit the nethermost energy absorption peaks at 209 nm, 211 nm and 210 nm, for α, β and γ compounds, respectively. These bands with maximum energies can be assigned to the absorption of the highest energetic level in the conduction band.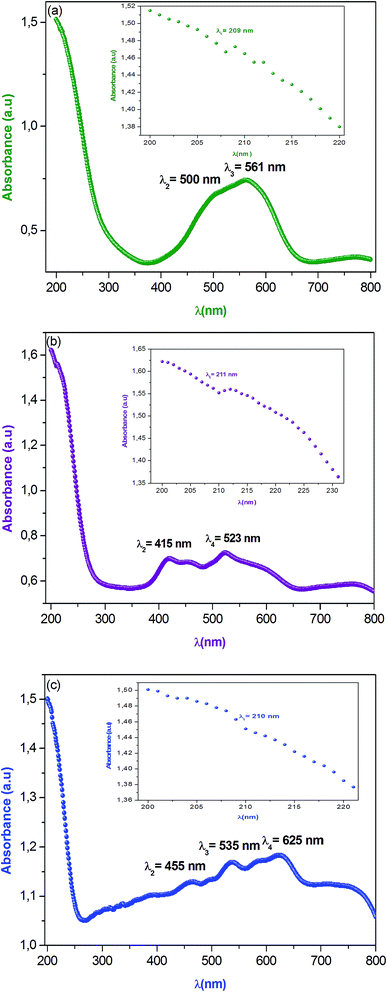 | ||
| Fig. 3 (a, b and c) Optical absorption spectra of α, β and γ of NaCoPO4 compounds measured at room temperature respectively. | ||
The absorption peak at 561 nm of the α-NaCoPO4 is attributed to 1A1 → 3T1 transition9 and indicates the presence of CoO6 octahedral. The β-NaCoPO4 and γ-NaCoPO4 compounds are characterized by the presence of peaks in the 400–460 nm range, attributed to 1A1 → 3T2 transition, and bands in the 500–700 nm range assigned to the 4A2 → 4T1 (P) transition for PO4 tetrahedral.10 These results confirm the presence of the CoO6 group in the α phase and the CoO4 group in the β and γ phases.
 | (2) |
 | (3) |
It is well known that the optical transitions in semiconductor materials take place through direct and indirect transitions. The value of the optical band gap Eg can be calculated using the fundamental absorption, which corresponds to the electron excitation from the valence band to the conduction band.
The band gap evolution was estimated based on the Tauc plot method, expressed as:13
| αhν = A(hν − Eg)n | (4) |
The transition is called direct, if the extremities of VB and CB lie at the same K-space, however, the transition is called indirect, if the transition is possible only with phonon assisted (Δκ ≠ 0).
Thus, the value of (n) may be 1/2 and 2, corresponding to the allowed direct and indirect.14
The energy of the incident photon is calculated using the following equation:15
 | (5) |
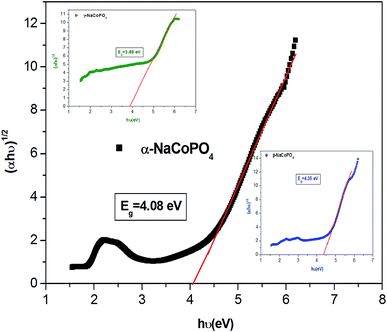
The dependence of (ahν) 2 and (ahν) 1/2 on the photon energy for α, β and γ compounds is shown in Fig. 4. The intercepts of these plots on the energy axis denote the energy band gaps, since Eg = hν when (αhν)n = 0. The best fit is obtained for n = 1/2; then the shapes of these curves favor the indirect transition. For these compounds the indirect gap energy is of the same order of (4 ± 0.03) eV (Table 2), thus these materials can be classified as wide gap semiconductors.
| Sample | Egi (eV) | EU (eV) |
|---|---|---|
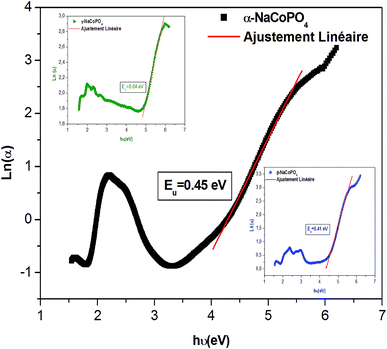
| α-NaCoPO4 | 4.08 | 0.45 |
| β-NaCoPO4 | 4.35 | 0.41 |
| γ-NaCoPO4 | 3.88 | 0.64 |
 | (6) |
![[thin space (1/6-em)]](https://www.rsc.org/images/entities/char_2009.gif) α versus energy (hν) plots. The estimated values are presented in Table 2. The values proved the presence of a disorder in these orthophosphate compounds. It is noted that α-NaCoPO4 compound has the smallest value of EU. This result entails that this material has the best crystal quality which confirms the results by XRD.
α versus energy (hν) plots. The estimated values are presented in Table 2. The values proved the presence of a disorder in these orthophosphate compounds. It is noted that α-NaCoPO4 compound has the smallest value of EU. This result entails that this material has the best crystal quality which confirms the results by XRD.
 | (7) |
The simplification of eqn (7) leads to:
 | (8) |
The dispersive behavior of the refractive index n(λ) was deduced from the absorption data using the following equation:18
 | (9) |
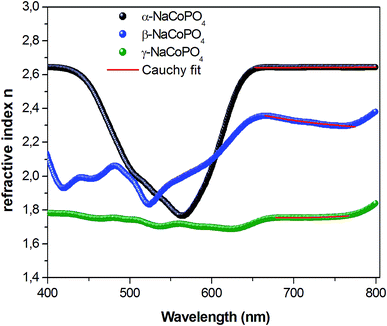
The variation of refractive index n with the wavelength for α, β and γ compounds is illustrated in Fig. 6. The Cauchy's formula of the refractive index n, as a function of the wavelength λ, is.19,20
 | (10) |
According to the Cauchy distribution, the refractive index depends firstly on the material and secondly of the wavelength. The best fit of experimental data was added in Fig. 6.
The values of Cauchy's parameters are gathered in Table 3.
| Sample | n0 | A (μm2) | B (μm4) |
|---|---|---|---|
| α-NaCoPO4 | 2.672 | −0.028 | 0.038 |
| β-NaCoPO4 | 2.276 | −0.653 | 0.044 |
| γ-NaCoPO4 | 2.1162 | −0.352 | 0.086 |
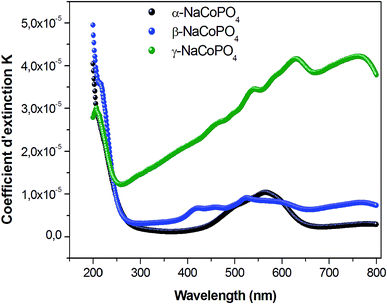
Fig. 7 displays the variation of the absorption K indices for α, β and γ compounds. The extinction coefficient behavior of the sample tends to decrease with the wavelength increase. It should be noted that the values of A and B are negligible in the γ-NaCoPO4 compound, indicating that the index n in this material is independent from the wavelength λ.
3.4. Dielectric study
The complex permittivity formalism has was employed to reveal significant information about the physical behavior of the electrical and dielectric properties. It is described by a non-Debye model (Cole–Cole model) which gives the frequency dependent complex permittivity in the following form:21
 | (11) |
The expressions of the real and imaginary parts of the dielectric complex permittivity are as follows:
 | (12) |
 | (13) |
The first part in eqn (13) is related to the dipole reorientation polarization and the second part to the electrical conductivity.
The frequency dependence of real (ε′) parts of the dielectric constant at different temperatures are shown in Fig. 8(a–c). Base on this figure, it can be noted that no relaxation peaks are observed in the frequency range employed in this study. At low frequencies, as the temperature increases, ε′ shows a dispersive behavior. Besides, the increasing value of ε′ with increasing temperature may be attributed to the increase in space charge polarization process.22 On the other hand, at high frequencies, it approaches a limiting constant value  which can be interpreted as a result of a rapid polarization processes with no ionic motion contribution, because the frequency is too high and the ions can only oscillate without reaching the sample–electrode interface.
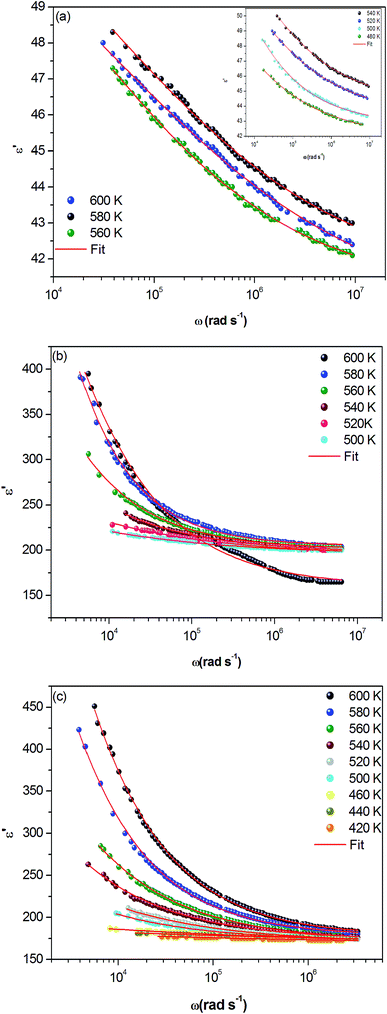 | ||
| Fig. 8 (a, b and c) Frequency dependence of the real part of the dielectric constant, ε′ at different temperatures for α-NaCoPO4, β-NaCoPO4 and γ-NaCoPO4 respectively. | ||
The dielectric loss spectrum, denoting the imaginary part ε′′(ω) of the complex permittivity, reveals the occurring dipolar molecular dynamic processes, with distinct origin processes appearing at diverse characteristic frequency ranges. At low frequency and high temperatures, the dielectric loss is predominantly Joule losses accompanied with charge conduction. The loss spectrum displayed bump-like features, corresponding to distinct reorientational processes.
Fig. 9(a–c) exhibits the frequency dependence of the imaginary dielectric constant ε′′ for the three compounds. The dielectric constant increases with the increase of the temperature due to the total polarization that arises from the dipole orientation and the trapped charge carriers. The dielectric dispersion rises drastically towards low frequencies and decays at higher frequencies.
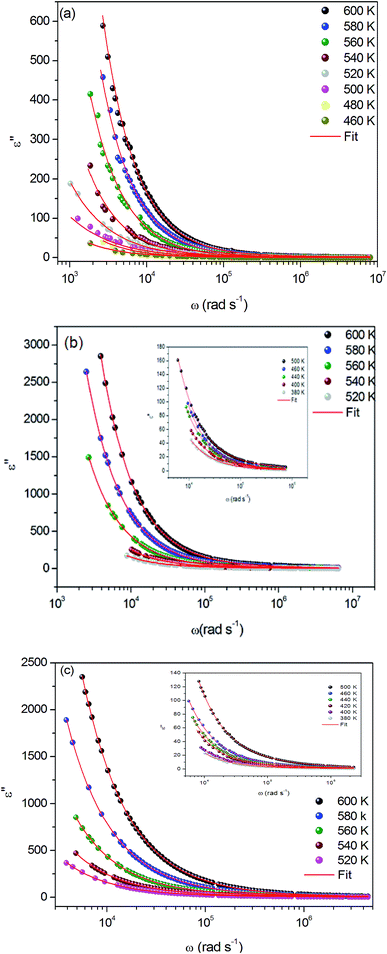 | ||
| Fig. 9 (a, b and c) Variation of dielectric constant ε′′ versus frequency at various temperatures for α-NaCoPO4, β-NaCoPO4 and γ-NaCoPO4 respectively. | ||
The dielectric profile plot is higher at low frequencies possibly due to the different types of polarization effects. These effects may be caused by one or more contribution polarization factors, i.e., electronic, atomic, ionic, interfacial factors etc. Higher dielectric constants at low frequencies depend on ionic vibration or movement, ion–ion orientation, and space charge effects. Thus, the higher value of ε′′ in the low frequency region is probably due mostly to electrode polarization and space charge effects, confirming the non-Debye dependence.23,24
It can be noted that dielectric constant ε′′ of α-NaCoPO4, β-NaCoPO4 and γ-NaCoPO4 at T = 600 K have different values at a maximum of ε′′, which is equal to 600, 2800, 2400, respectively. Hence, it can be concluded that the α-phase has a low permittivity ε′′ compared to the two other phases.
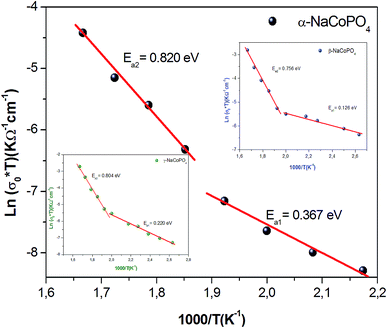
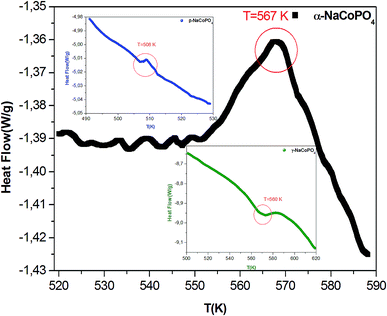
The conductivity values obtained by adjusting the curve ε′′, using eqn (11), are plotted as a function of temperature (Fig. 10). The thermal evolution of the specific conductivity  of α, β and γ phases indicates an Arrhenius type behavior. The form of the curves indicates a discontinuity at the neighborhood of T = 555 K for the three compounds. The values of the energies of activation for α-NaCoPO4, β-NaCoPO4 and γ-NaCoPO4 are, respectively: Ea2 = 0.820, 0.756, and 0.804 eV for T > 555 K and Ea1 = 0.36, 0.126, and 0.220 eV for T < 555 K (Table 4). The differential scanning calorimetry (DSC) study confirms the changes observed at σdc level by the presence of an endothermic peak near 555 k for the three phases (Fig. 11).
| Range of temperature | T > 550 K | T < 550 K |
|---|---|---|
| Ea (eV) of α-NaCoPO4 | 0.820 | 0.367 |
| Ea (eV) of β-NaCoPO4 | 0.756 | 0.126 |
| Ea (eV) of γ-NaCoPO4 | 0.804 | 0.220 |
4. Conclusion
In this paper, the α-NaCoPO4, β-NaCoPO4 and γ-NaCoPO4 monophosphates were prepared by a mechano-chemical method. First, the powder XRD study for the three compounds at room temperature revealed: the α-NaCoPO4 crystallized in the orthorhombic system with Pnma space group, the values of the lattice parameters and volume were determined (a = 8.951 Å, b = 6.891 Å, c = 5.037 Å and v = 310.688 Å3),the β-NaCoPO4 crystallized in the hexagonal system with P65 space group, the values of the lattice parameters and volume were determined(a = b = 10.174 Å, c= Å and v = 2471.618 = Å3) and the γ-NaCoPO4 crystallized in the monoclinic system P21/n space group, the values of the lattice parameters and volume were determined (a = 5.243 Å, b = 9.988 Å, c = 7.471 Å and v = 391.234 Å3).Second, the UV-vis spectroscopy was used to determine some of the key parameters, such as the absorption process at the absorption edge of α, β and γ phases, which revealed the absorption bands at (209, 500, 561 nm), (211, 415, 523 nm) and (210, 455, 535, 625 nm), respectively. The Tauc model was used to determine the optical gap energy. The analysis of the data indicated the existences of optical indirect gaps, estimated to be 4.08 eV, 4.35 eV and 3.88 eV. The Urbach energies of these compounds were evaluated form theoretical fits. The β-NaCoPO4 compound has a low value of Urbach energy, confirming that this sample has the best crystal quality.
Finally, we investigated the dielectric proprieties at different temperatures for the α-NaCoPO4, β-NaCoPO4 and γ-NaCoPO4 compounds. The dependence of the imaginary part of the complex permittivity rises sharply at low frequency, indicating that the electrode polarization and space charge effects have occurred, confirming the non-Debye dependence. The variation of dielectric constant and dielectric loss as a function of frequency was discussed. The temperature dependence on electrical conductivity σdc calculated from fitting ε′′ is described by an Arrhenius equation and characterized by a change of the slope at 555 K. This change is confirmed by the Differential scanning calorimetry.
Conflicts of interest
There are no conflicts to declare.References
- Y. J. Shi, Y. Wang, S. L. Pan, Z. H. Yang, X. Y. Dong, H. P. Wu, M. Zhang, J. Cao and Z. X. Zhou, J. Solid State Chem., 2013, 197, 128–133 CrossRef CAS.
- B. D. Boyan and Z. Schwartz, Nat. Rev. Rheumatol., 2011, 7, 8–9 CrossRef CAS PubMed.
- A. A. Belik, A. P. Malakho, P. S. Salamakha and B. I. Lazoryak, J. Solid State Chem., 2006, 179, 161–168 CrossRef CAS.
- R. R. Levitskii, I. R. Zachek, A. S. Vdovych and S. I. Sorokov, Condens. Matter Phys., 2009, 12, 75–119 CrossRef CAS.
- A. Clearfield and D. S. Thakur, Appl. Catal., A, 1986, 26, 1–26 CrossRef CAS.
- R. Hammond and J. Barbier, Acta Crystallogr., Sect. B: Struct. Crystallogr. Cryst. Chem., 1996, 52, 440–449 CrossRef.
- A. M. Chippindale, A. R. Cowley, J. Chen, Q. Gao and R. Xu, Acta Crystallogr., Sect. C: Cryst. Struct. Commun., 1999, 55, 845–847 CrossRef.
- P. Feng, X. Bu and G. D. Stucky, J. Solid State Chem., 1997, 129, 328–333 CrossRef CAS.
- H. M. Rietveld, J. Appl. Crystallogr., 1965, 2, 65–71 CrossRef.
- M. Enneffati, N. K. Maaloul, B. Louati, K. Guidara and K. Khirouni, Opt. Quantum Electron., 2017, 49, 331 CrossRef.
- I. S. Ahmed, H. A. Dessouki and A. A. Ali, Spectrochim. Acta, Part A, 2008, 71, 616–620 CrossRef CAS PubMed.
- F. Yakuphanoglu, R. Mehrotra, A. Gupta and M. Munoz, J. Appl. Polym. Sci., 2009, 114, 794 CrossRef CAS.
- E. Yassitepe, Z. Khalifa, G. H. Jaffari, C.-S. Chou, S. Zulfiqar, M. I. Sarwar and S. I. Shah, Powder Technol., 2010, 201, 27 CrossRef CAS.
- S. Gagandeep, B. S. L. Kulwant and H. S. Sahota, Nucl. Sci. Eng., 2000, 134, 208–217 CrossRef.
- J. Tauc and A. Menth, J. Non-Cryst. Solids, 1972, 8–10, 569–585 CrossRef CAS.
- D. E. Moh, Electronic Process in Non-Crystalline Material, Universe Press, Oxford, 2nd edn, 1979 Search PubMed.
- A. Barhoumi, G. Leroy, B. Duponchel, J. Gest, L. Yang, N. Waldhoff and S. Guermazi, Superlattices Microstruct., 2015, 82, 483–498 CrossRef CAS.
- N. Ekem, S. Korkmaz, S. Pat, M. Z. Balbag, E. N. Cetin and M. Ozmumca, Int. J. Hydrogen Energy, 2009, 34, 5218–5222 CrossRef CAS.
- G. Nixon Samuel Vijayakumar, M. Rathnakumari and P. Sureshkumar, Arch. Appl. Sci. Res., 2011, 3, 514–525 CAS.
- H. G. Tompkins and W. A. McGahan, Spectroscopic Ellipsometry and Reflectometry, John Wiley and Sons Inc., New York, 1999 Search PubMed.
- K. S. Cole and R. H. Cole, J. Chem. Phys., 1941, 9, 341–351 CrossRef CAS.
- M. Hema, S. Selvasekerpandian, A. Sakunthala, D. Arunkuma and H. Nithya, Phys. B, 2008, 403, 2740–2747 CrossRef CAS.
- I. M. Hodge and C. A. Angell, J. Chem. Phys., 1977, 67, 1647–1658 CrossRef CAS.
- K. K. Srivastava, A. Kumar, O. S. Panwar and K. N. Lakshminarayan, J. Non-Cryst. Solids, 1979, 33, 205–224 CrossRef CAS.
| This journal is © The Royal Society of Chemistry 2019 |

