 Open Access Article
Morphology control of α-Fe2O3 towards super electrochemistry performance
Ruili Zhang,
Debao Liu and
Ping Yang *
*
School of Material Science and Engineering, University of Jinan, Jinan, 250022, P. R. China. E-mail: mse_yangp@ujn.edu.cn
First published on 16th July 2019
Abstract
α-Fe2O3 with various morphologies including spindle, rod, tube, disk, and ring were synthesized through controlling the H2PO4− etching process. The concentrations of H2PO4− plays an important role in controlling the morphology change of the samples. Selected adsorption of H2PO4− ions resulted in anisotropic growth. In addition, the etching of H2PO4− occurred in the center of rods which resulted in tubal α-Fe2O3. Nanodiscs were created once the etching process occurred on the wall of the tube. The electrochemical test shows that disklike samples revealed excellent specific capacitance, rate capacity and cycling stability because of relative higher surface area and pore structure. For the CO catalytic oxidation properties, spindle samples exhibited super catalytic activity.
Introduction
It is well known that the properties of nanomaterials depend not only on the chemical composition and crystal structure, but also on the morphology, size and exposed facets. Unique structures and morphologies of nanomaterials reveal technological significance in energy storage and conversion as well as catalysis. The synthesis of these nanomaterials was carried out by controlling the preparation process.1,2 Because the nucleation and growth of materials are very sensitive, the morphology of the resulting samples was controlled by the anisotropy of crystal. In particular, nanostructures with different dimensions (0 to 3D) are synthesized through the selective adsorption of ligand ions.3–5 Thus, the control of the synthesis process via special methods (e.g. ion etching) is crucial for creating nanomaterials with special structures.Hematite α-Fe2O3, as an n-type semiconductor (Eg = 2.1 eV), is the most stable structure iron oxide at ambient conditions.6 Benefiting from some merits, such as low cost, environmentally friendly, nontoxic, corrosion resistant and easily obtainable, the hematite has been widely used in the fields of catalysts, energy conversion and sensors.7–9 So far, the α-Fe2O3 with different morphologies including sphere, rod, wire, spindle, nut, rice and mesoporous structure have already been fabricated by a variety of processes.10–16 For example, hollow structures are obtained by controlled deposition of the precursors onto diverse removable templates via chemical etching or thermal decomposition. Namely, the synthesis methods generally contain sol–gel processing, micro-emulsion, chemical precipitation and hydrothermal method.17–20 Among these methods, a hydrothermal method offers effective control over the nucleation and growth by controlling the experimental parameters. Moreover, the obtained products usually present good dispersion, uniformity without agglomeration and high purity.21 In fact, the simple synthesis strategy without templates for hollow α-Fe2O3 hierarchical structures is still remains a technological challenge in spite of extensive research efforts.
In this paper, H2PO4− ions driven etching process was developed to fabricate α-Fe2O3 nanostructures with a series of morphologies including spindle, tube, disk and ring without using templates. The amount of H2PO4− ions controlled the etching process which determined the morphology of resulting samples. The morphologies and structures of resulting samples were fully investigated and the oriented dissolution and recrystallization formation mechanism was proposed by changing preparation parameters. In addition, the supercapacitor and catalytic measurements were performed towards electrochemical performance and CO catalytic oxidation properties.
Experimental
Synthesis of samples
Chemicals were of analytical grade and used as received without further purification. In a typical synthesis, 0.1162 g of FeCl3·6H2O was dissolved in 30 mL of distilled water with stirring for 30 min. Different amount of NaH2PO4·2H2O (0, 0.21, 0.43, 0.64, 1.0, 2.5, and 3.0 mM) was then added into above yellow aqueous solutions with stirring for 30 min and after that transferred into a Teflon-lined stainless steel autoclave. The autoclave was sealed and maintained at 220 °C for 3–20 h. Finally, the autoclave was cooled to room temperature naturally. Samples were separated by centrifugation and washed with water for 3 times and dried at 70 °C in air. The preparation conditions and morphologies are listed in Table 1.| Sample | H2PO4− (mM) | Molar ratiob | Time (h) | Morphology | |||||||||||||||||||||||||||||||||||||||||||||||||||||||||||||||||||||||||||||||||||||||||||||||
|---|---|---|---|---|---|---|---|---|---|---|---|---|---|---|---|---|---|---|---|---|---|---|---|---|---|---|---|---|---|---|---|---|---|---|---|---|---|---|---|---|---|---|---|---|---|---|---|---|---|---|---|---|---|---|---|---|---|---|---|---|---|---|---|---|---|---|---|---|---|---|---|---|---|---|---|---|---|---|---|---|---|---|---|---|---|---|---|---|---|---|---|---|---|---|---|---|---|---|---|
| a The concentration of Fe3+ was 15 mM for all samples.b The molar ratio of Fe3+/H2PO4−. | |||||||||||||||||||||||||||||||||||||||||||||||||||||||||||||||||||||||||||||||||||||||||||||||||||
| S1 | N/A | N/A | 20 | Quasi-sphere | |||||||||||||||||||||||||||||||||||||||||||||||||||||||||||||||||||||||||||||||||||||||||||||||
| S2 | 0.21 | 71 | 20 | Spindle | |||||||||||||||||||||||||||||||||||||||||||||||||||||||||||||||||||||||||||||||||||||||||||||||
| S3 | 0.43 | 35 | 20 | Rod | |||||||||||||||||||||||||||||||||||||||||||||||||||||||||||||||||||||||||||||||||||||||||||||||
| S4 | 0.64 | 23 | 20 | Tube | |||||||||||||||||||||||||||||||||||||||||||||||||||||||||||||||||||||||||||||||||||||||||||||||
| S5 | 1 | 15 | 20 | Disk | |||||||||||||||||||||||||||||||||||||||||||||||||||||||||||||||||||||||||||||||||||||||||||||||
| S6 | 2.5 | 6 | 20 | Ring | |||||||||||||||||||||||||||||||||||||||||||||||||||||||||||||||||||||||||||||||||||||||||||||||
| S7 | 3 | 5 | 3 | Disk | |||||||||||||||||||||||||||||||||||||||||||||||||||||||||||||||||||||||||||||||||||||||||||||||
| S8 | 3 | 5 | 6 | Hole in center | |||||||||||||||||||||||||||||||||||||||||||||||||||||||||||||||||||||||||||||||||||||||||||||||
| S9 | 3 | 5 | 12 | Ring | |||||||||||||||||||||||||||||||||||||||||||||||||||||||||||||||||||||||||||||||||||||||||||||||
| S10 | 3 | 5 | 20 | Ring | |||||||||||||||||||||||||||||||||||||||||||||||||||||||||||||||||||||||||||||||||||||||||||||||
Characterization
The morphology and microstructure observation of samples were carried out using field-emission scanning electron microscopy (SEM, QUANTA 250 FEG, FEI, America) and high-resolution transmission electron microscopy (HRTEM, JEOL JEM-2100). The crystal structures and phase composition of samples were taken on an X-ray diffraction (XRD) meter (Bruker, D8 ADVANCE) with Cu Kα irradiation (k = 1.5406 Å). The specific surface areas of samples were characterized by nitrogen adsorption–desorption measurement (MFA-140, Beijing Builder Company). A high-resolution Raman spectrometer (LabRAM HR Evolution, HORIBA JOBIN YVON SAS) was used to record the Raman spectra of samples. The Fourier-transform infrared spectroscopy (FI-IR) spectra of samples were recorded on a WQF-410 spectrophotometer (Beijing Secondary Optical Instruments, China).Electrochemical measurement
A working electrode was prepared by mixing active material, acetylene black, and polyvinylidene fluoride (PVDF) in a mass ratio of 80![[thin space (1/6-em)]](https://www.rsc.org/images/entities/char_2009.gif) :
:![[thin space (1/6-em)]](https://www.rsc.org/images/entities/char_2009.gif) 15
15![[thin space (1/6-em)]](https://www.rsc.org/images/entities/char_2009.gif) :
:![[thin space (1/6-em)]](https://www.rsc.org/images/entities/char_2009.gif) 5 and stirred for 1 h to form homogeneous slurry. The slurry was subsequently brush-coated on a nickel foam and dried at 70 °C overnight to evaporate the solvent. An individual electrode contained active material of about 3.0 mg and a working electrode was obtained by pressing an active material-coated Ni foam at 10 MPa. A three-electrode electrochemical system was used to measure the electrochemical behavior of the samples, where the active material, Pt foil and Hg/HgO electrode were employed as working electrode, counter electrode and reference electrode, respectively. The cyclic voltammetry (CV) and galvanostatic charge–discharge (GCD) measurements were performed using an electrochemical work station (CHI 660E, Chenhua, Shanghai) in a 6 M KOH aqueous solution. The electrochemical impedance spectroscopy (EIS) measurement was carried out by applying an AC amplitude of 5 mV at open circuit potential. The specific capacitance was calculated from the GCD curves using the following equation:
5 and stirred for 1 h to form homogeneous slurry. The slurry was subsequently brush-coated on a nickel foam and dried at 70 °C overnight to evaporate the solvent. An individual electrode contained active material of about 3.0 mg and a working electrode was obtained by pressing an active material-coated Ni foam at 10 MPa. A three-electrode electrochemical system was used to measure the electrochemical behavior of the samples, where the active material, Pt foil and Hg/HgO electrode were employed as working electrode, counter electrode and reference electrode, respectively. The cyclic voltammetry (CV) and galvanostatic charge–discharge (GCD) measurements were performed using an electrochemical work station (CHI 660E, Chenhua, Shanghai) in a 6 M KOH aqueous solution. The electrochemical impedance spectroscopy (EIS) measurement was carried out by applying an AC amplitude of 5 mV at open circuit potential. The specific capacitance was calculated from the GCD curves using the following equation:| C = (I × Δt)/(m × ΔV) |
Catalytic measurement
CO oxidation activity was measured in a fixed-bed flow reactor (outer diameter of 6 nm) at the atmospheric pressure and with 50 mg of catalyst. The reactants were fed with a volume ratio of He/CO/O2 = 79/1/20 (a total flow rate of 30 mL min−1) controlled by independent thermal mass flow controllers. The effluent gases were analyzed online using a gas chromatograph equipped with a flame ionization detector. The CO conversion ratio of samples was calculated using an equation bellow.| CO conversion = [(COin − COout)/COin] × 100% |
Results and discussion
Morphology evolution mechanism, crystal structure and phase composition of samples
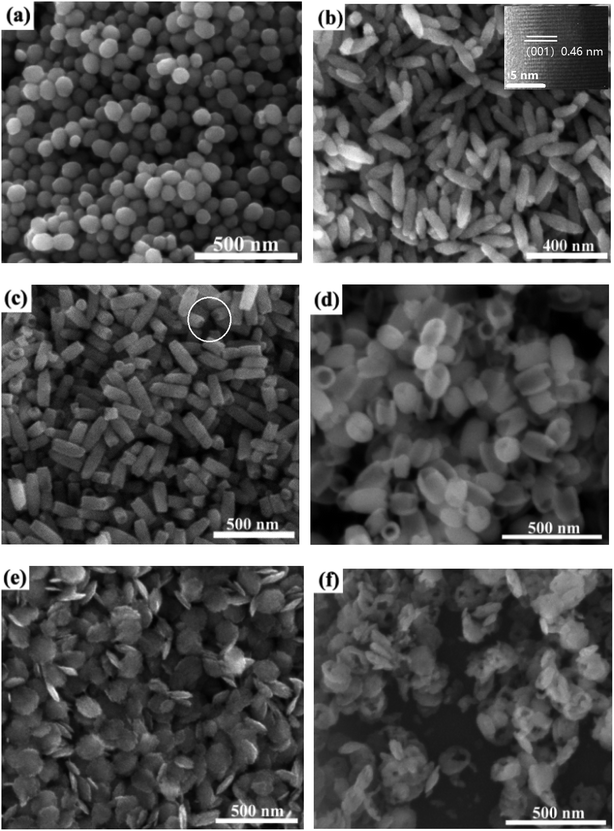
Fig. 1 shows the SEM images of samples S1 to S6. For sample S1 (no H2PO4− addition), quasi spheres with a relatively small diameter of 60–90 nm were observed as shown in Fig. 1a. This is related to isotropic growth. Sample S2 prepared with a low H2PO4− concentration revealed a spindle morphology with a length of 200–267 nm and average diameter of 45 nm as shown in Fig. 1b. The inset in Fig. 1 shows the HRTEM image of a particle which confirms the growth is along [001] direction (c axis). Similar phenomenon was observed in literature.13,15 This confirms the adsorption ability of H2PO4− ions on the (001) facet was low compared with other planes, the (001) plane was less protected. With further increasing H2PO4− concentration to 0.43 mM, sample S3 exhibited rod morphology with a length of 150–176 nm and average diameter of 70 nm (Fig. 1c, S3). The tube morphology was observed on the top of the specimen as circled in some area in Fig. 1c. This means large amount H2PO4− ions limited the growth of samples. The change of morphology and size confirms that H2PO4− ions plays an important role.Compared with samples S2 and S3, the rod morphology is seemingly obtained by cutting the tips of spindle. This confirms the etching occurred because of the reaction of excess H2PO4− ions with Fe2O3. This is ascribed to the dissolution of spindles along the long axis direction. Similar phenomenon was observed in literature.13 In addition, the diameter of samples increased with increasing H2PO4− concentrations. This is ascribed the re-growth of Fe2O3 on diameter direction because of Fe precursors generated by the etching. With increasing the concentrations of H2PO4− ions to 0.64 mM, the resulting sample become into tube-like morphology with average length of 160 nm and diameter of 100 nm (Fig. 1d, sample S4). For a H2PO4− concentration of 1 mM, the product was identified as disk-like shape with an average size of 126 nm (Fig. 1e, sample S5). In the case of H2PO4− concentration of 2.5 mM, the product was changed into ring-like structures with outer diameter of 130 to 160 nm and the thickness of the wall was about 40–60 nm (Fig. 1f, sample S6).
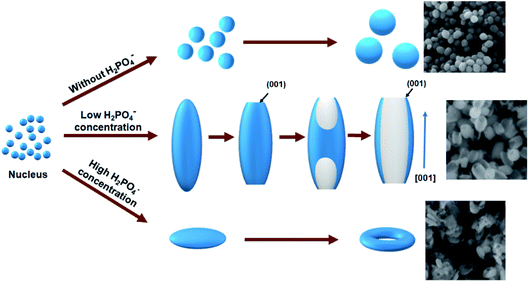
According to the morphology evolution in Fig. 1, it is found that H2PO4− concentrations play an important role for the resulting shape of samples. Similar phenomenon was observed by Chen et al.22 The morphology evolution mechanism is schematized in Fig. 2. Without H2PO4−, quasi spheres were obtained because of isotropic growth. With increasing the concentration of H2PO4− ions, the selected adsorption of H2PO4− ions occurred on the different facets of Fe2O3 samples. The adsorption of H2PO4− ions is very weak for the (001) plane because of the lack of singly coordinated hydroxyl groups.22,24 Thus H2PO4− ions were located on the prism planes of (110) and (100). The growth occurred along [001] direction, which resulted in the formation of spindle like Fe2O3 particles. As the H2PO4− concentration continues increasing, the tips of spindle-shaped particles were concaved to form nanorods. The driving force is the high activity of the sharp spindle tips, which are easily attacked by the protons in acidic solution. With the H2PO4− concentration further increasing, nanotubes were obtained. The formation of nanotubes can be described as dissolution of the spindle-shaped precursors from the tips toward the interior along the long axis, finally hollow tubes are formed. When the concentration of H2PO4− was high (1 mM), a large amount of surface adsorbed H2PO4− made the nanoparticles surface more negatively charged. Therefore, the electrostatic repulsion made aggregation of the nanoparticles difficult. Instead of forming spindle-shaped particles, nanodiscs were obtained.22 Similar to the nanotubes in the solution with a low phosphate concentration, the central area on both faces of a nanodisc was dissolved throughout the whole particle, a hole was made along the [001] direction and a nanoring appeared.22–24
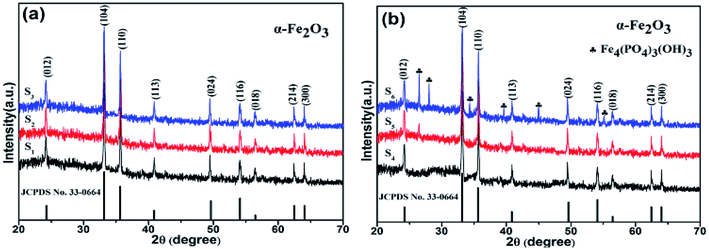
To confirm the phase composition, Fig. 3 shows the XRD patterns of samples with different concentrations of H2PO4−. It is found that samples S1–S4 revealed pure α-Fe2O3 phase (all diffraction peaks matched perfectly with JCPDS file no 33-0664) without any other impurities. Moreover, all the diffraction peaks in XRD patterns are narrow and sharp, indicating ideal crystallinity. However, for the samples S5 and S6, apart from a pure α-Fe2O3 phase, the XRD peaks of Fe4(PO4)3(OH)3 (JCPDS file no 42-0429) phase were observed. Especially for sample S6, the XRD peaks of Fe4(PO4)3(OH)3 phase became high. This is ascribed to the reaction of H2PO4− ions with Fe2O3.25
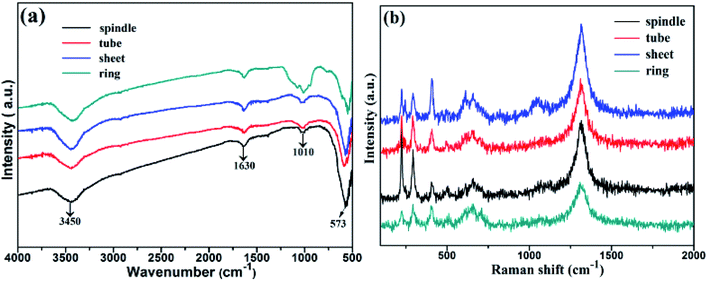
To confirm the role of H2PO4− role, the FT-IR spectra of samples with different morphologies are shown in Fig. 4a. A distinct peak at 3450 cm−1 is ascribed to the bending frequency of surface hydroxyl group,26 and the strong absorption band centred at 573 cm−1 is due to the Fe–O vibrational mode, which is the typical lattice vibration peak of α-Fe2O3.27,28 Some weak peaks between 1010 and 1022 cm−1 confirm the presence of some phosphate impurity in samples.29 Fig. 4b depicts the Raman spectra of samples. Clearly, the Raman vibration bands at 228.31, 290.45, 410.48, 505.94, 656.11 and 1315.84 cm−1 indicated the formation of α-Fe2O3. The peaks at 228.31 and 505.94 cm−1 represented the typical A 1g mode, while the peaks at 290.45, 410.48, 656.11 and 1315.84 cm−1 are due to the Eg mode.30
According to the result in literature, the surface hydroxyl configuration on (001) planes of α-Fe2O3 was doubly coordinated hydroxyl groups, whereas on other planes, for instance the (012), (110) and (100) plane, the dominated surface coordinated hydroxyl groups are singly type.31–34 The H2PO4− in solution can react with hydroxyl groups by forming monodentate or bidentate inner-sphere complex.35,36 Thus, the adsorption capacities and affinities for phosphate to hematite were much lower for the (001) planes than for the others.
At low H2PO4− concentration, selected adsorption occurred on the planes except for (001) plane due to the special surface hydroxyl configuration. Thus, the (001) plane would grow quick compared with others and result in spindle-like structure based on the theory that the final morphology is determined by those planes with low growth speed.
| Fe2O3 + 2xH2PO4− + 6H+ ↔ 2[Fe(H2PO4)x]3−x + 3H2O | (1) |
With increasing H2PO4− concentration to 0.43 mM, the spindle-like products would form at first. At the same time, the H+ concentration would increase due to the continuous hydrolysis of Fe3+, which accelerates eqn (1) towards the positive direction. Therefore, the etching process would happen along [001] direction because of high activity of the sharp spindle tips and formed the final rod-like shape at the state of solution system equilibrium. For 0.64H2PO4− concentration, the morphology evolution is as same as the formation of rod-like product. The center area was completely dissolved and the diameter of the final tube became larger and the surface smoother than that of the spindle-like products. At a high H2PO4− concentration (1 mM), the resulting samples exhibited a disk-like morphology with the main exposed (001) plane. This is ascribed that the surface hydroxyl groups were intense protonized because of a high H2PO4− concentration and more H2PO4− ions adsorbed on the (001) plane with less Fe3+ adsorbed due to the electrostatic attraction.37 As a result, the growth of (001) plane was blocked and became a final main exposed plane.
The SEM images of samples are shown in Fig. 5. In addition, a time-dependent morphology evolution test and the corresponding formation mechanism was also given in Fig. 6. With a constant H2PO4− concentration, it is found that the samples underwent shape evolution with various time. When the reaction time was 3 h, the products present disk-like morphology with diameter of about 140 nm (Fig. 5a, sample S7). Prolonging the reaction time to 6 h, the center of some disks became thinner and small holes were observed in the center and the diameter increased to about 145 nm (Fig. 5b, sample S8). With further prolonging time to 12 h, thinner areas increased in the center of disks and the holes became large and some disks are penetrated obviously with an average diameter of 157 nm (Fig. 5c, sample S9). When the reaction time reached to 20 h, the holes became large and most of the products became into ring-like morphology. The outer diameter increased to about 166 nm (Fig. 5d, sample S10). Apparently, the outer diameter of sample S10 increased with about 26 nm compared with sample S7.
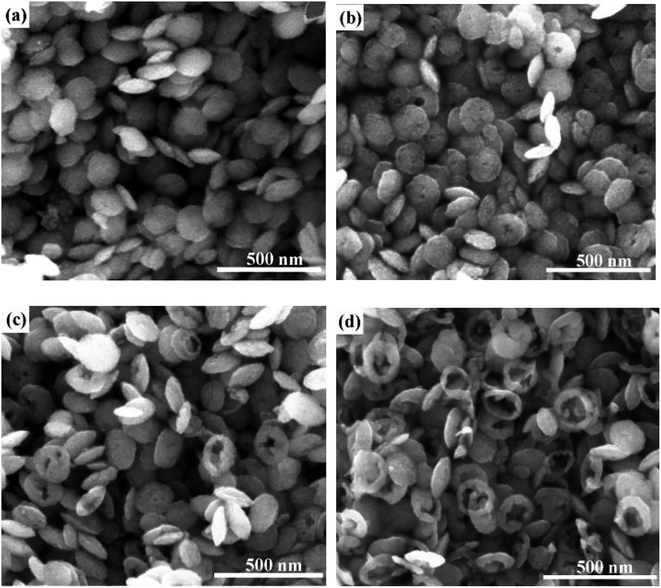 | ||
| Fig. 5 Morphology evolution of samples with different reaction time. (a) S7, (b) S8, (c) S9, (d) S10. | ||
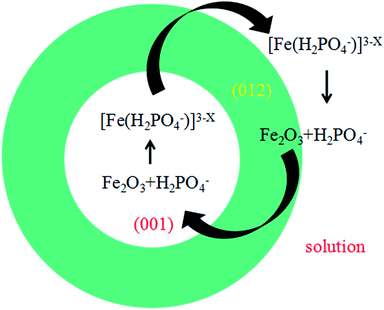
Fig. 6 shows the formation scheme of ring structure. The dissolving process along the [001] direction of the disks results to the formation of the ring. Since different planes share different surface hydroxyl configuration and the reaction on (001) plane was accelerated to the right side of eqn (1) and the α-Fe2O3 was dissolved faster than that of other planes. So the concentration of [Fe(H2PO4)x]3−x in the solution was enhanced and the H2PO4− decreased. According to the equilibrium theories,38 the (012) facet can absorb the new produced [Fe(H2PO4)x]3−x and release new H2PO4− to keep balance of the solution system. Hence, the (012) plane grew naturally which gives a good explanation of the increased diameter in ring-like products.
Electrochemical properties
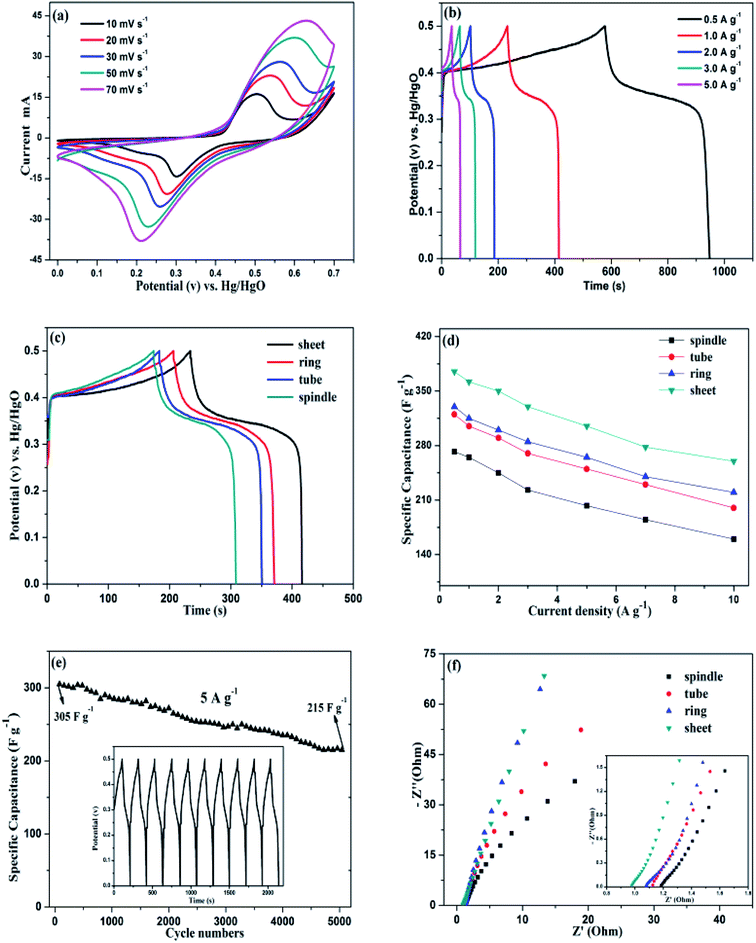
The electrochemical measurements of samples were characterized in a three-electrode configuration with 6 M KOH electrolyte. The CV curves of sample S5 electrode with different scan rate are shown in Fig. 7a. It is found that the peak current depends linearly on the sweep rate and a pair of redox peaks present at each curve, which is the features of Faraday redox reaction. The peaks retain well at high scanning rates, indicating the fast electronic and ionic transport process. Moreover, due to the interface resistance of the electrode, the anodic peak moves toward more anodic and the cathode peak moves toward more cathode with the increasing scan rates. Fig. 7b depicts the charge–discharge curves of the electrodes with various current densities. The specific capacitance values are 362, 345, 330, 310 and 272 F g−1 at different current densities of 0.5, 1, 2, 3 and 5 A g−1, respectively. Fig. 7c is the charge–discharge curves (at 1 A g−1) of the four samples with various morphologies. Clearly, the S5 (disk-like) sample possess highest discharge times, indicating the best specific capacitance. From the Table 2, we can see that the specific capacitance values of the four samples follows the order: spindle < tube < ring < disk.| Samples | Specific capacitance (F g−1) | ||||||||||||||||||||||||||||||||||||||||||||||||||||||||||||||||||||||||||||||||||||||||||||||||||
|---|---|---|---|---|---|---|---|---|---|---|---|---|---|---|---|---|---|---|---|---|---|---|---|---|---|---|---|---|---|---|---|---|---|---|---|---|---|---|---|---|---|---|---|---|---|---|---|---|---|---|---|---|---|---|---|---|---|---|---|---|---|---|---|---|---|---|---|---|---|---|---|---|---|---|---|---|---|---|---|---|---|---|---|---|---|---|---|---|---|---|---|---|---|---|---|---|---|---|---|
| a At a current density of 1 A g−1. | |||||||||||||||||||||||||||||||||||||||||||||||||||||||||||||||||||||||||||||||||||||||||||||||||||
| S2 | 272 | ||||||||||||||||||||||||||||||||||||||||||||||||||||||||||||||||||||||||||||||||||||||||||||||||||
| S4 | 310 | ||||||||||||||||||||||||||||||||||||||||||||||||||||||||||||||||||||||||||||||||||||||||||||||||||
| S5 | 360 | ||||||||||||||||||||||||||||||||||||||||||||||||||||||||||||||||||||||||||||||||||||||||||||||||||
| S6 | 330 | ||||||||||||||||||||||||||||||||||||||||||||||||||||||||||||||||||||||||||||||||||||||||||||||||||
The variation trend of specific capacitance as a function of current density for the samples is shown in Fig. 7d. At a current density of 10 A g−1, the specific capacitance of sample S5 (disk-like) electrode can also maintain as high as 260 F g−1 with 69.3% retention, which indicates that the disk-like structure is more beneficial to the enhancement of rate capacity. On the contrary, the sample S2 (spindle-like) sample exhibits inferior specific capacitance and poor rate capability. Except for the electrochemical behavior and capacitance properties of the products, a good cycling stability is of great importance. So we tested the cycling performance of sample S5.
Fig. 7e is the specific capacitance retention of sample S5 at a current density of 5 A g−1 after 5000 cycles. In the first 200 cycles, the as-prepared electrode exhibits a stable capacitance with nearly unchanged, in the following cycling process, the electrode also exhibits ideal specific capacitance with a retention about 70.5%, which indicating that the disk-like structures present an excellent cyclability. Also, the curves of charge–discharge time are almost unchanged for the first 10 cycles, indicating high coulombic efficiency. Fig. 7f represents the EIS measurements of samples with various morphologies. The Nyquist plots contain two parts: the semicircle at high frequency region and the curve at low frequency region. While the intersection of the semicircle and real axes represents ohm resistance (Rs), including the intrinsic resistance of the substrate.39 The diameter of the semicircle indicates the interface charge transfer resistance between the electrode and the electrolyte (Rct). The Rs values of the electrodes can be clearly seen from the illustration and follows the order: disk < ring < tube < spindle, demonstrating the best electrical conductivity for disk-like sample. The results consist with the previous analysis of the charge–discharge curves. The slope of the curve at low frequency region represents the diffusion resistance of OH− ions (Warburg resistance).40 It is found that the sample S5 performs highest slope value and more closer to the virtual axis, indicating smallest diffusion resistance. The reasons can be ascribed to the unique disk-like structure: the large specific surface area and considerable open space caused by the porous structure, demonstrating an ideal electrode material for charge migration and ion diffusion.
CO catalytic oxidation properties
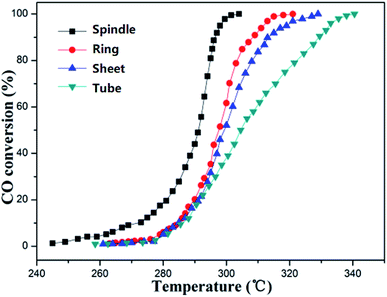
The CO catalytic oxidation properties of four samples with different morphologies were characterized. Seen from Fig. 8, due to the continuous oxidation of CO, the CO conversion ratios were gradually increased with temperature. Obviously, the sample S2 (spindle-like) structure of α-Fe2O3 performs the best catalytic property: the onset oxidation temperature (T10) and the completed CO oxidation temperature (T100) were 268 and 300 °C, respectively. The key factor that determines the catalytic performance lies in the exposed specific crystal facets of the samples. And the Fe atoms on the crystal plane are the catalytic active center. Therefore, the higher the Fe atoms density, the better the catalytic performance. According to the result in literature,41,42 the main exposed surface of the sample S2 (spindle-like) samples is (012) plane and the corresponding Fe atoms density is about 10.1 atoms per nm2, which could provide more active sites for catalytic reactions and have the highest catalytic activities. Therefore, the order of the catalytic activity of the four samples is tube-like < disk-like < ring-like < spindle-like.Conclusions
In summary, a series of different morphologies of α-Fe2O3 were synthesized under the control of H2PO4− ions. It was found that the H2PO4− concentration has an important influence on the morphologies of the products. The final morphologies of the products mainly depend on the growth control of H2PO4− to the unique (001) plane. The electrochemical measurements show that the samples with various morphologies exhibit different specific capacities and the disk-like products exhibit excellent specific capacitance and ideal cycling stability due to the relative higher specific surface area and opened pore structure. For the CO catalytic oxidation properties, the specific exposed facets on α-Fe2O3 are indeed factors influencing the catalytic performances. In addition, the spindle-like α-Fe2O3 performs the best catalytic property. The reason is that the main exposed facets is the (012) plane which has a larger Fe atom density and provides more catalytic active sites. As a result, the spindle-like α-Fe2O3 demonstrating excellent catalytic performance.Conflicts of interest
There are no conflicts to declare.Acknowledgements
This work was supported by the projects from National Natural Science Foundation of China (grant nos. 51572109 and 51772130).References
- A. Seyed-Razavi, I. K. Snook and A. S. Barnard, J. Mater. Chem., 2010, 20, 416–421 RSC.
- M. V. Kovalenko, M. I. Bodnarchuk, R. T. Lechner, G. Hesser, F. R. Schaffler and W. G. Heiss, J. Am. Chem. Soc., 2007, 129, 6352–6353 CrossRef CAS.
- J. J. Li, P. Jia, X. Hu, D. H. Dong, G. G. Gao, D. S. Geng, J. Xiang, Y. Wang and S. Hu, Mol. Catal., 2018, 450, 1–13 CrossRef CAS.
- L. B. Yu, J. J. Wang, X. Hu, Z. M. Ye, C. Buckley and D. H. Dong, Electrochem. Commun., 2018, 86, 72 CrossRef CAS.
- L. L. Wang, T. Fei, Z. Lou and T. Zhang, ACS Appl. Mater. Interfaces, 2011, 3, 4689–4694 CrossRef CAS.
- H. B. Guo and A. S. Barnard, J. Mater. Chem. A, 2013, 1, 27–42 RSC.
- S. Y. Lian, E. B. Wang, L. Gao, D. Wu, Y. L. Song and L. Xu, Mater. Res. Bull., 2006, 41, 1192–1198 CrossRef CAS.
- H. W. Wang, Z. J. Xu, H. Yi, H. G. Wei, Z. H. Guo and X. F. Wang, Nano Energy, 2014, 7, 86–96 CrossRef CAS.
- J. Chen, L. N. Xu, W. Y. Li and X. L. Gou, Adv. Mater., 2005, 17, 582–586 CrossRef CAS.
- Q. Liu, Z. M. Cui, Z. Z. Ma, S. W. Bian, W. G. Song and L. J. Wan, Nanotechnology, 2007, 18, 385605 CrossRef.
- K. Woo, H. J. Lee, J. P. Ahn and Y. S. Park, Adv. Mater., 2003, 15, 1761–1764 CrossRef CAS.
- Q. Han, Z. H. Liu, Y. Y. Xu, Z. Y. Chen, T. M. Wang and H. Zhang, J. Phys. Chem. C, 2007, 111, 5034–5038 CrossRef CAS.
- X. Li, X. Yu, J. H. He and Z. Xu, J. Phys. Chem. C, 2009, 113, 2837–2845 CrossRef CAS.
- S. H. Lee and C. M. Liddell, Small, 2009, 5, 1957–1962 CrossRef CAS.
- H. Wang, D. W. Brandl, F. Le, P. Nordlander and N. J. Halas, Nano Lett., 2006, 6, 827–832 CrossRef CAS.
- F. Jiao, A. Harrison, J. C. Jumas, A. V. Chadwick, W. Kockelmann and P. G. Bruce, J. Am. Chem. Soc., 2006, 128, 5468–5474 CrossRef CAS.
- X. Q. Liu, S. W. Tao and Y. S. Shen, Sens. Actuators, B, 1997, 40, 161–165 CrossRef CAS.
- I. Ray, S. Chakraborty, A. Chowdhury, S. Majumdar, A. Prakash, R. Pyare and A. Sen, Sens. Actuators, B, 2008, 130, 882–888 CrossRef CAS.
- D. Yener and H. Giesche, J. Am. Ceram. Soc., 2001, 84, 1987–1995 CrossRef CAS.
- R. D. Zysler, M. Vasquez-Mansilla, C. Arciprete, M. Dimitrijewits, D. Rodriguez-Sierra and C. Saragovi, J. Magn. Magn. Mater., 2001, 224, 39–48 CrossRef CAS.
- X. Liu, G. Qiu, A. Yan, Z. Wang and X. Li, J. Alloys Compd., 2007, 433, 216–220 CrossRef CAS.
- J. Chen, S. Macfarlane, C. Zhang, K. Yu and W. Zhou, Cryst. Growth Des., 2017, 17, 5975–5983 CrossRef CAS.
- X. Yan, Y. Wu, D. Li, C. Luo, Y. Wang, J. Hu, G. Li, P. Li, H. Jiang and W. Zhang, J. Mater. Sci.: Mater. Electron., 2018, 29, 2610–2617 CrossRef CAS.
- C. Jia, L. Sun, F. Luo, X. Han, L. J. Heyderman, Z. Yan, C. Yan, K. Zheng, Z. Zhang, M. Takano, N. Hayashi, M. Eltschka, M. Kläui, U. Rüdiger, T. Kasama, L. Cervera-Gontard, R. E. Dunin-Borkowski, G. Tzvetkov and J. Raabe, J. Am. Chem. Soc., 2008, 130, 16968–16977 CrossRef CAS.
- K. Byrappa and T. Adschiri, Prog. Cryst. Growth Charact. Mater., 2007, 53, 117–166 CrossRef CAS.
- C. T. Liu, J. Ma and Y. L. Liu, Sci. China: Chem., 2011, 54, 1607–1614 CrossRef CAS.
- L. Li and K. Y. S, Chem. Res. Chin. Univ., 2009, 25, 595–599 CrossRef CAS.
- Q. Song and Z. J. Zhang, J. Am. Chem. Soc., 2004, 126, 6164–6168 CrossRef CAS.
- G. K. Pradhan and K. M. Parida, ACS Appl. Mater. Interfaces, 2011, 3, 317–323 CrossRef CAS.
- Z. J. Zhang, X. J. Mei, L. R. Fen, S. J. Lu and F. L. Qiu, Chin. Chem. Lett., 2004, 15, 867–870 CAS.
- G. K. Pradhan, D. K. Padhi and K. M. Parida, ACS Appl. Mater. Interfaces, 2013, 5, 9101–9110 CrossRef CAS.
- X. L. Hu and J. C. Yu, Adv. Funct. Mater., 2011, 13, 7293–7298 Search PubMed.
- B. L. Lv, Y. Xu, D. Wu and Y. H. Sun, J. Nanosci. Nanotechnol., 2010, 10, 2348–2359 CrossRef CAS.
- J. D. Russell, R. L. Parfitt, A. R. Fraser and V. C. Farmer, Nature, 1974, 248, 220–221 CrossRef CAS.
- J. Zhao, P. Yang, H.-S. Chen, J. Li, Q. Che, Y. Zhu and R. Shi, J. Mater. Chem. C, 2015, 3, 2539–2547 RSC.
- V. Barrón and J. Torrent, J. Colloid Interface Sci., 1996, 177, 407–410 CrossRef.
- X. Huang, J. Colloid Interface Sci., 2004, 271, 296–307 CrossRef CAS.
- X. L. Hu, J. C. Yu, J. M. Gong, Q. Li and G. S. Li, Adv. Mater., 2007, 19, 2324–2329 CrossRef CAS.
- C. J. Jia, L. D. Sun, Z. G. Yan, L. P. You, F. Luo, X. D. Han, Y. C. Pang, Z. Zhang and C. H. Yan, Angew. Chem., 2005, 117, 4402–4407 CrossRef.
- G. Binitha, M. S. Soumya, A. A. Maahavan, P. Praveen, A. Balakrishnan, K. R. V. Subramanian, M. V. Reddy, V. Shantikumar, A. Nair, S. Nair and N. Sivakumar, J. Mater. Chem. A, 2013, 1, 11698–11704 RSC.
- R. Khan, M. Habib, M. A. Gondal, A. Khalil, Z. U. Rehman, Z. Muhammad, Y. A. Haleem, C. D. Wang, C. Q. Wu and L. Song, Mater. Res. Express, 2017, 4, 105501–105510 CrossRef.
- Q. X. Gao, X. F. Wang, J. L. Di, X. C. Wu and Y. R. Tao, Catal. Sci. Technol., 2011, 1, 574–577 RSC.
| This journal is © The Royal Society of Chemistry 2019 |

