 Open Access Article
Formation mechanism of nanoporous silver during dealloying with ultrasonic irradiation
Runwei Zhanga,
Xu Wang *ab,
Jacob C. Huang
 *b,
Fei Lia,
Zhichao Zhanga and
Ming Wua
aSchool of Mechanical Engineering, Liaoning Shihua University, Fushun11300, P. R. China
bInstitute for Advanced Study, Department of Materials Science & Engineering, City University of Hong Kong, Kowloon, Hong Kong. E-mail: wangxu@lnpu.edu.cn; chihuang@cityu.edu.hk
First published on 29th March 2019
Abstract
Nanoporous silver (NPS) with an extreme coarsened 3-dimensional bi-continuous ligament and nanopore structure could be prepared by chemical dealloying with high-intensity ultrasonic irradiation (UI). The formation mechanism of NPS dealloying with UI was different from NPS obtained through free corrosion. It evolved into NPS with a new lump forming-disintegrating mechanism. Ultrasonic irradiation had strong effects on the dealloying process of NPS. The stirring effect produced by ultrasonic vibration could promote the corrosion of Cu and facilitate the diffusion of Ag atoms. Therefore, the coarsening rate of the ligament was increased significantly. Dealloying assisted by UI could generate an extremely coarsened microstructure of which ligament and pore sizes were much larger than those obtained from free corrosion dealloying.
Introduction
Due to their unique structure-related properties, nanoporous metals that can exhibit a bi-continuous interpenetrating ligament/channel structure have attracted intense research interest in recent years in many fields such as catalysis, sensing, optical, and actuation.1–3 There are many methods to prepare nanoporous metals up to now. The template method which is the process of depositing the metallic material into the hole or surface of the template by physical or chemical methods and removing the template to obtain the nanometer material with the standard morphology and size of the template was a common method used for the fabrication of nanoporous materials.4–6 It offers convenient control of the microstructure (mainly mean pore size) by precisely changing the original template. However, this method shows significant disadvantages because it is technically difficult and time-consuming. Dealloying which means the selective dissolution of one or more components out of an alloy or a compound has been reported to be a simple and effective strategy for the fabrication of nanoporous metals with homogeneous porous structure.7,8To date, dealloying has been applied to fabricate nanoporous metals from different alloy systems, such as Ag–Al, Al–Cu, Au–Cu, Au–Ag, Cu–Zr alloys.9–13 In this research, a comparative commercial Ag–Cu alloy system was chosen to be investigated. According to existing research, the microstructure of the as-dealloyed sample could be affected by many factors, such as nature of the precursor alloy, composition of the precursor alloy, dealloying time, dealloying temperature, and dealloying solution.14–17 A slight change in modulation of these factors may lead to a remarkable difference in the microstructure of nanoporous metals. Based on this effect, an efficient dealloying process and a tunable nanoporous structure were presented.18–20
However, the dealloying process can be more efficient and the microstructure will be more desirable when the dealloying process is carried out with the assistant treatments.16,21 Nano-porous Ag micro-particles have been prepared by ultrasonic assisted dealloying Mg–Ag alloy.22 The length scale of the ligament is not only sensitive to the concentration of the dealloying solution but also to the intensity of ultrasonic irradiation. The influence of a magnetic field on the dealloying of Al–25Ag has also been elucidated.23 According to the experimental results, an external magnetic field accelerates the dealloying process and the microstructure obtained from dealloying with magnetic treatment is more homogeneous than those from free corrosion dealloying. Moreover, the nanoporous Ag foam was fabricated by dealloying Ag–Al thin film through supercritical fluid corrosion.4 Recently, a three-dimensional bicontinuous nanoporous materials could be obtained by vapor phase dealloying.24
As we all know, ultrasonic vibration has been widely applied for purification, degassing, refining metallic melts and fabricating particulate-reinforced metal matrix composites.25–28 In the present work, the nanoporous Ag with an extreme coarsened microstructure is obtained by chemical dealloying with ultrasonic irradiation at different frequencies. Therefore, a time saving method for preparing nanoporous Ag was presented and a lower acid concentration was acquired to obtain NPS. It could avoid time consuming and reduce environment pollution simultaneously. Not only the surface diffusion during dealloying process with ultrasonic irradiation (UI) is studied, but also the effect of UI on the resulting nanoporous structure is discussed. Extremely large variations between the microstructure of the nanoporous Ag dealloyed under free corrosion and nanoporous Ag dealloyed with UI are observed. In addition, different UI frequencies would have different effects on the dealloying process and diffusion of Ag atoms. Therefore, the relationship between the nanoporous Ag ligament and other dealloying parameters is elucidated. A new formation mechanism of nanoporous Ag is also presented.
Experiment
Ag–Cu alloy with the nominal composition of Ag25Cu75 (at%) was prepared by melting pure Ag (99.95 wt%) and pure Cu (99.95 wt%) in a graphite crucible using a high-frequency induction furnace under an argon atmosphere. The pre-alloyed Ag–Cu alloy ingots were re-melted in a highly pure argon atmosphere and were subsequently injected onto a copper roller (cooling rate: 50–300 °C s−1; rotational speed: 2500 rpm). The ingots were then rapidly solidified into ribbons, which are normally 40–60 μm thick, 10–15 mm wide and several centimeters long.Dealloying of the samples was then performed at 45 °C under different conditions: (1) under free corrosion in a 10 wt% HNO3 aqueous solution for 5, 10 and 20 min; (2) with UI at the constant frequency of 28 kHz in a 10 wt% HNO3 aqueous solution for 5, 10 and 20 min; and (3) with UI at the frequency of 40 kHz in a 10 wt% HNO3 aqueous solution for 5, 10 and 20 min. The dealloyed samples were then rinsed three or four times sequentially using alcohol and distilled water. Under the effect of UI, the temperature of dealloying system would increase 1–2 °C.
Phase patterns of the Ag–Cu precursor alloys and dealloyed samples were analyzed by X-ray diffraction (XRD, MAXima-7000) using Cu Kα radiation with a scanning speed of 2° min−1. The 2θ scans were performed between 20° and 90°. Microstructures and elemental content of the Ag–Cu precursor alloys and the dealloyed samples were characterized by transmission electron microscopy (TEM, JEOL-2100F) and scanning electron microscopy (SEM, Hitachi SU8000) equipped with an energy dispersive X-ray spectrometer (EDS, BRUKER). The ligament or pore sizes of nanoporous Ag in SEM images were measured by an image processing software ImageJ.
Results and discussion
Microstructure characterization and phase composition
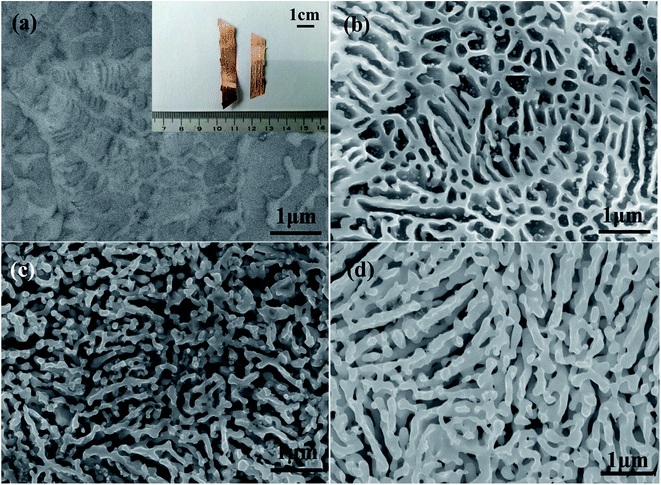
The XRD results of the Ag25Cu75 alloy dealloyed in a 10 wt% HNO3 solution at 45 °C without UI and with ultrasonic irradiation at different frequencies are presented. The XRD patterns of Ag25Cu75 initial alloy sample was shown in Fig. 1 and the photograph of Ag25Cu75 initial alloy was inset in Fig. 2a. It can be seen that two phases were present in the initial alloy: α-Cu(Ag) solid solution and an Ag2Cu intermetallic compound. This result was close to those presented previously.7 As shown in Fig. 1, only a single Ag phase was left in the samples after dealloying for 20 min without UI and with UI at the frequencies of 28 and 40 kHz respectively. It is obvious that Cu from the Ag25Cu75 initial alloy was etched away during the dealloying process and all samples were dealloyed thoroughly after 20 min. In fact, the dealloying speed of Ag25Cu75 alloy was faster when dealloyed with UI than free corrosion. Technically, there was always a small amount of residual Cu existing in the final NPS. So it was not taken into account since the content of residual Cu was too little.19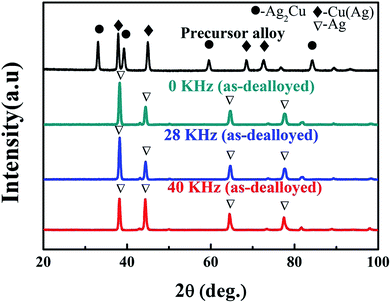 | ||
| Fig. 1 XRD results of Ag25Cu75 precursor alloy and ribbons dealloyed without or with UI at different frequencies (28, 40 KHz) for 20 min. | ||
The evolution of alloy microstructure during the dealloying process without UI was characterized. Fig. 2 shows the SEM images of the NPS ribbons (plan view) dealloyed from the Ag25Cu75 alloys for different durations in a 10 wt% HNO3 solution at 45 °C. The morphology of the resulting NPS ribbon exhibited a homogeneous, ligament-channel structure. After dealloying for 20 min, the diameter of the ligament increased, and the size changed from 70 ± 15 to 120 ± 15 nm.
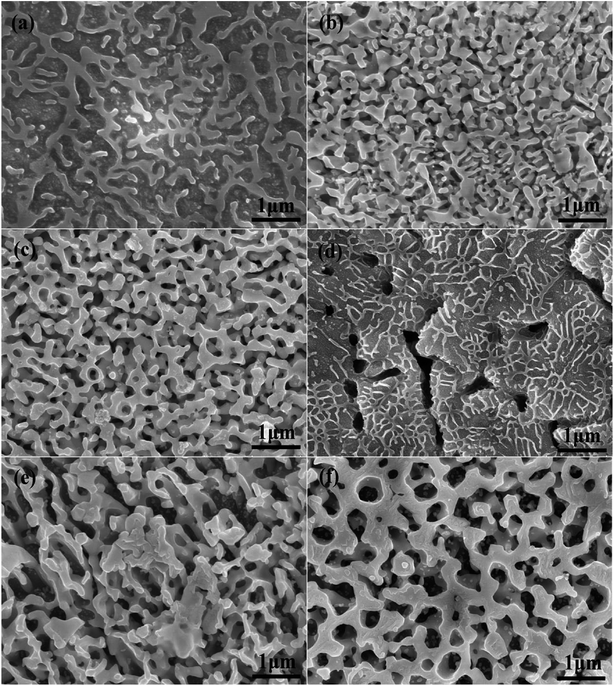
The SEM images of the NPS ribbons (plan view) dealloyed under UI (frequency: 28 kHz) for different durations are shown in Fig. 3a–c. The final microstructure was much coarsened than that of the Ag25Al75 alloy ribbon which was dealloyed without UI treatment. After dealloying for 20 min, the diameter of the ligament increased from 80 ± 15 to 190 ± 15 nm. Fig. 3d–f show the SEM images of the NPS ribbons (plan view) dealloyed with UI (frequency: 40 kHz) for different durations. Many large cracks appeared on the alloy surface (Fig. 3d) which suggested that the high intensity of ultra-sonication gives rise to the cracks even fracture during the dealloying process. The as-dealloyed sample exhibited an microstructure with coarsened ligaments and enlarged pores. Moreover, the diameter of the ligament prepared from the Ag25Al75 alloy dealloyed for 20 min reached approximately 280 nm and was much larger than those of the Ag25Al75 alloys dealloyed with UI at the frequency of 0 or 28 kHz.
Effect of ultrasonic irradiation on microstructure of NPS
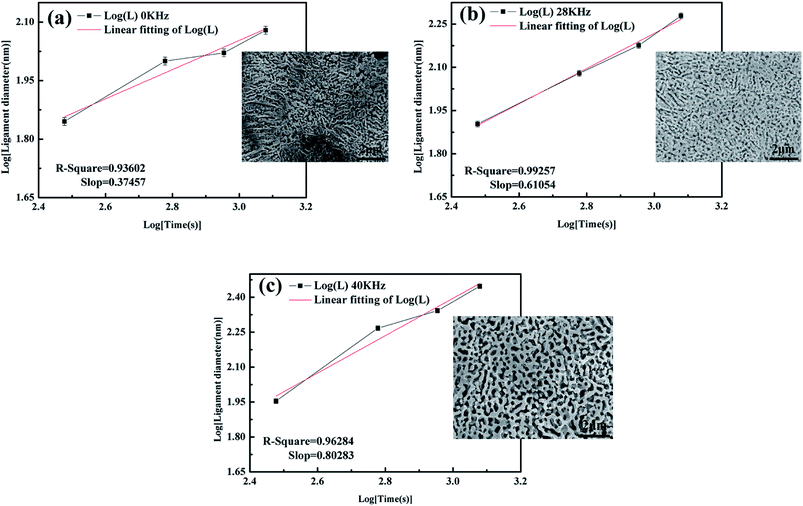
The alterations of average ligament diameters and pore sizes with UI at different frequencies were measured and the data was shown in Fig. 4. It can be easily obtained that both ligament diameters and pore sizes increased with increasing dealloying time. And the final results of ligament and pore size were much larger than many of those from other researches.10,23,29 The ligament diameters increased sharply for dealloying with UI, compared with those from free corrosion. Therefore, we concluded that a high-intensity ultrasonic irradiation would affect the microstructure of NPS remarkably.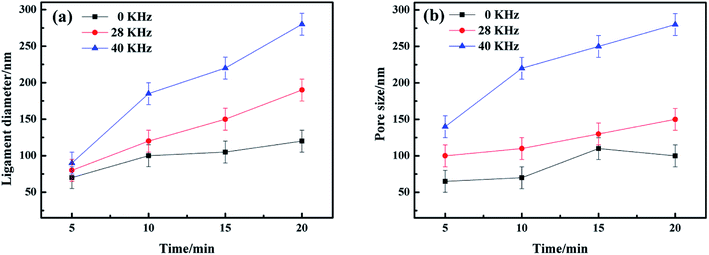 | ||
| Fig. 4 (a) Ligament diameters and (b) pore sizes of Ag25Cu75 at different dealloying time under UI at frequencies of 0, 28 and 40 kHz. | ||
Additionally, the coarsening of the ligament was caused by the diffusion of the more noble elements atoms which were driven by surface tension existing at the interface between the alloy and solution.30,31 With the reduction in the surface energy, the ligament coarsened gradually.32 It is well known that the coarsening mechanism of the ligament is controlled by the surface diffusivity (Ds) of the more noble elements:16
 | (1) |
| d ∝ (Ds/V0)μ, | (2) |
| d0 kHz ∝ t0.37 ≈ t2/5, | (3) |
| d28 kHz ∝ t0.61 ≈ t3/5, | (4) |
| d40 kHz ∝ t0.80 ≈ t4/5, | (5) |
Formation mechanism of nanoporous Ag during dealloying with ultrasonic irradiation
The formation mechanism of NPS may be somewhat distinctive with the application of UI. After the Ag25Cu75 alloy was immersed in the dealloying solution with ultrasonic treatment, Cu atoms on the surface will be leached away easily. The reaction of Cu in HNO3 aqueous solution could be described as follows:| HNO3 (hydrolyzed) → H+ + NO3− | (6) |
| Cu(Ag) + 4H+ + 2NO3− → Cu2+ + 2NO2↑ + 2H2O + Ag | (7) |
| Ag2Cu + 4H+ + 2NO3− → Cu2+ + 2NO2↑ + 2H2O + Ag | (8) |
To fill the vacancies caused by the etching of the copper atoms, the Ag atoms on the interface between the alloy and dealloying solution moved and agglomerated into clusters by diffusion due to the effect of surface tension.32 With the assembly of the Ag atoms, ligaments were formed and coarsened gradually. Compared with free corrosion dealloying, the formation mechanism of NPS by dealloying Ag25Cu75 with UI developed in a new lump-forming-disintegrating manner, as described below.
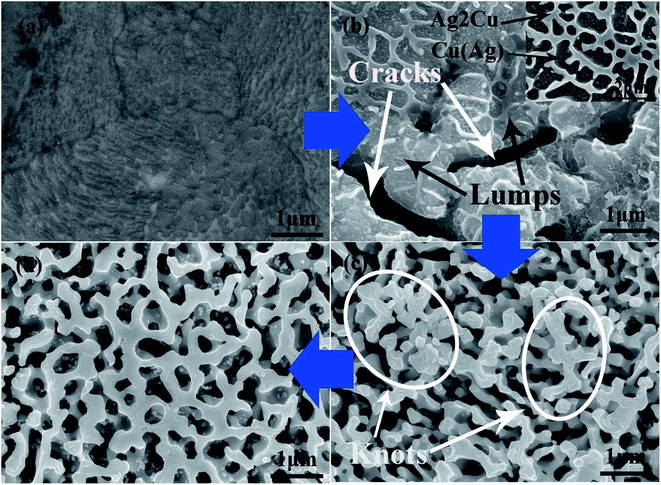
Fig. 6a is the SEM image of Ag25Cu75 precursor alloy. When dealloying began, the Cu atoms exposed to the HNO3 solution would react actively with H+ ions and then are transformed into free Cu2+ ions in the solution. At the moment, some walls and small particles can form on the alloy surface. According to the previous related reports, the wall structure was the Ag2Cu phase and the particle structure was Cu(Ag) phase. And Cu(Ag) phase was dealloyed prior to the Ag2Cu phase.29,37,38 Moreover, the inset of Fig. 6b is presented to illustrate the distributions of the Cu(Ag) solid solution and the Ag2Cu intermetallic compound in the Ag–Cu alloy at the initial stage of dealloying. The structure of Ag2Cu and Cu(Ag) are both marked using black arrows. Influenced by ultrasonic condition, many cracks and lumps can then be formed on the surface layer of the sample (Fig. 6b). However, many residual Ag2Cu walls were still on the surface of the lumps as illustrated in Fig. 6b. Their sizes measuring to be 45 ± 15 nm are very small.
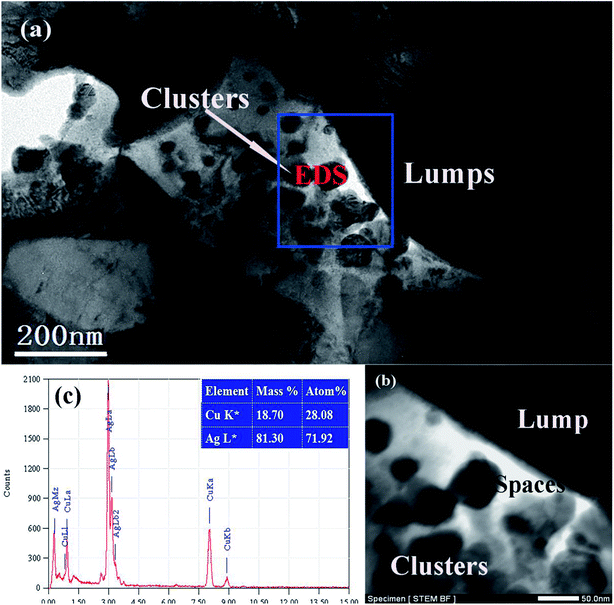
For further characterizing the lump structure, TEM images of the Ag25Cu75 alloy sample dealloyed with UI at the frequency of 40 kHz for 5 min are represented in Fig. 7a. Some large plates and thin particles corresponding to lumps and clusters respectively can be observed clearly. The EDS pattern (Fig. 7b) confirmed that the particles were actually the Ag-rich clusters. There are a lot of spaces appearing between the plate and particles. This demonstrates the appearance of cracks at the beginning of dealloying. The formation of vacancies may support the hypothesis that high-intensity ultrasonic irradiation could accelerate the reaction process between Cu and HNO3. Fig. 7c is the bright-field scanning transmission electron microscopy (STEM BF) image. It shows an enlarged view of a part of Fig. 8a which was marked by a blue rectangle and represent the distributions of lumps, clusters and cracks clearly. Distinctly, the lumps (corresponding to plates) and cracks (corresponding to vacancies) have formed at the initial stage of dealloying and the clusters moved and aggregated on the surface of the lumps.
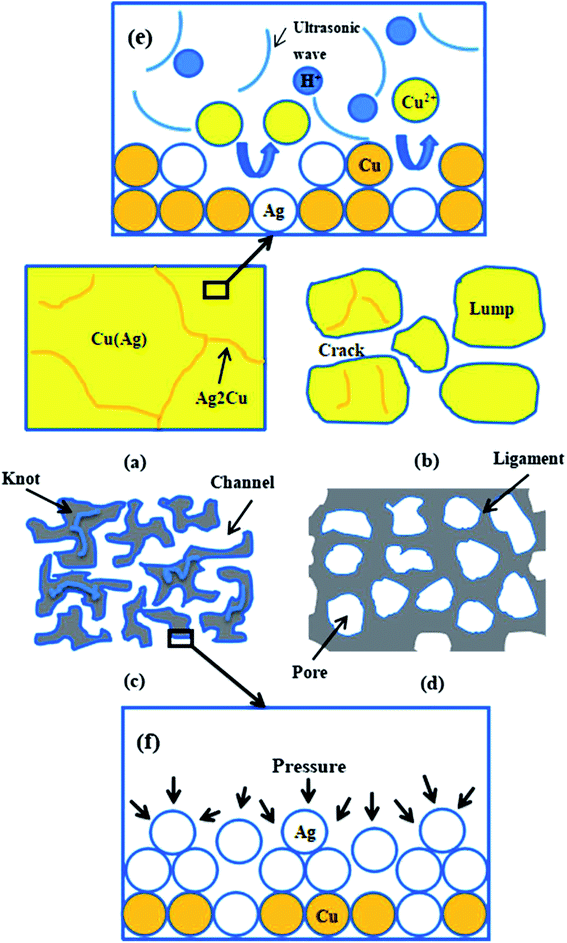
As the dealloying continued, more Cu atoms were leached away leading to the decrease of the Cu content in alloy. The number and the size of the pores increased correspondingly. Then the lumps shrank and disintegrated gradually. Due to the further removal of Cu atoms, more Ag atoms exposed to solution moved and assembled to form the ligament. As a result, many large knots composed of ligaments appeared which was marked by the white circles in Fig. 6c. It is obvious that they evolved from the large lumps to the thinner knots. Subsequently, the coarsening of the ligaments proceeded and the knots vanished gradually until an ultra-homogeneous nanoporous structure ultimately formed (Fig. 6d). The whole dealloying process of Ag25Cu75 alloy in an ultrasonic environment can be illustrated in details by a schematic diagram (Fig. 8a–d).
As previously reported, the application of ultrasonic fields into the solution could give rise to phenomena such as cavitation and acoustic streaming which could lead to the effects of ultrasonic stirring and degassing.39 We assumed the ultrasonic irradiation could generate high-intensity shock waves to effectively accelerate the reaction between Cu and the HNO3 solution. The stirring and shocking effect could generate waves in the medium solution as shown in Fig. 8e. That would greatly increase the chance of collision and contact among the atoms which were involved in the reaction system, such as the reaction between H+ ions hydrolyzed in the solution and Cu atoms crystalized in the alloy. Hence Cu atoms were more inclined to be separated from the alloy and turned into Cu2+ compared with those dealloyed through free corrosion. As a result, cracks and lumps appeared at the initial stage of dealloying process with ultrasonic irradiation.
In addition, the ultrasonic vibration could facilitate the coarsening of Ag ligament. The acoustic streaming effects originating from ultrasonic vibration may affect the diffusion of Ag atoms. As reported, the streaming was eventually related to the pressure present in the dealloying solution and the pressure acting on diffusing atoms could be described by:40
 | (9) |
Obviously, the maximum value of the pressure could approximately be simplified into:
| Pmax = νρc = ρcA0ω, | (10) |
When the alloy ribbon was immersed in the dealloying solution with ultrasonic vibration, the whole surface of alloy ribbon was under the pressure from all directions. The schematic diagram of reaction interface when Ag25Cu75 Alloy is dealloyed with UI during the period of diffusion is presented in Fig. 8f. Since Ag atoms at the surface of alloy are all under the pressure from multi-direction, the Ag atoms (or particles) become more aggressive during diffusion process. The movement rate of Ag atoms was accelerated and the diffusion was forced intensely. As a result, an extremely homogeneous microstructure of the nanoporous Ag with a coarsened ligament-pore distribution was obtained. Moreover, the microstructure of the ultrasonically treated sample was much more homogeneous than that of the free corrosion samples.
Conclusions
Effects of ultrasonic irradiation (UI) on the diffusion and microstructure of NPS were analyzed. The following conclusions were drawn: the formation mechanism of NPS dealloying with UI was different from that for NPS obtained by free corrosion. The NPS evolved depending on a lump forming-disintegrating mechanism. Ultrasound has an extremely strong effect on the microstructure of NPS. On one hand, the stirring produced by ultrasonic vibration could promote the reaction between Cu and HNO3 aqueous solution. On the other hand, ultrasonic vibration could facilitate the diffusion of Ag atoms by the induced solution pressure when the coarsening rate of ligament was increased significantly during dealloying with UI. Dealloying treated with ultrasonic irradiation could generate an extremely homogeneous microstructure with much coarser ligaments compared with those dealloyed by free corrosion.Conflicts of interest
There are no conflicts to declare.Acknowledgements
The authors gratefully acknowledge the sponsorship from National Natural Science Foundation of China, under the project no. 51574147, Liaoning Provincial Natural Science Foundation, under the project no. 201602474.References
- A. Wittstock, V. Zielasek and J. Biener, Science, 2010, 327, 319–322 CrossRef CAS PubMed.
- N. Yu, L. Jiang and H. Hou, JOM, 2017, 69(6), 1027–1033 CrossRef CAS.
- H. J. Jin, X. L. Wang and S. Parida, Nano Lett., 2010, 10, 187–194 CrossRef CAS PubMed.
- Y. C. Liu, J. C. Huang and X. Wang, RSC Adv., 2018, 8, 1307513082 Search PubMed.
- N. Yu, T. Wang, C. Nie, L. Sun, J. Li and H. Geng, JOM, 2016, 68(1), 391–396 CrossRef CAS.
- G. J. Li, X. P. Song and F. F. Lu, J. Mater. Res., 2012, 27(12), 1612–1620 CrossRef CAS.
- Y. Zhao, X. Wang and J. C. Huang, Mater. Lett., 2016, 183, 165–169 CrossRef CAS.
- T. A. Rebbecchi and Y. Chen, J. Mater. Res., 2017, 33, 1–14 Search PubMed.
- R. W. Zhang, X. Wang and Z. C. Zhang, RSC Adv., 2018, 8, 9462–9470 RSC.
- W. Liu, L. Chen and J. Yan, Corros. Sci., 2015, 94, 114–121 CrossRef CAS.
- R. Morrish, K. Dorame and A. J. Muscat, Scr. Mater., 2011, 64, 856–859 CrossRef CAS.
- T. Krekeler, V. S. Anastasia and M. Graf, Mater. Res. Lett., 2017, 5, 1–8 CrossRef.
- H. B. Lu, Y. Li and F. H. Wang, Scr. Mater., 2007, 56(2), 165–168 CrossRef CAS.
- Z. Dan, F. Qin and S. I. Yamaura, J. Alloys Compd., 2013, 581, 567–572 CrossRef CAS.
- M. Hakamada, H. Nakano and T. Furukawa, Phys. Chem. Chem. Phys., 2011, 13(26), 12277–12284 RSC.
- L. H. Qian and M. W. Chen, Appl. Phys. Lett., 2007, 91, 597–605 Search PubMed.
- Z. Zhang, Y. Wang and Z. Qi, J. Phys. Chem. C, 2009, 113, 12629–12636 CrossRef CAS.
- H. Rösner, S. Parida and D. Kramer, Adv. Eng. Mater., 2010, 9, 535–605 CrossRef.
- X. Wang, Z. Qi and C. Zhao, J. Phys. Chem. C, 2009, 113, 13139–13150 CrossRef CAS.
- L. Y. Chen, J. S. Yu and T. Fujita, Adv. Funct. Mater., 2010, 19, 1221–1226 CrossRef.
- W. C. Li and T. J. Balk, Scr. Mater., 2010, 62, 167–169 CrossRef CAS.
- Y. Y. Zhao, D. Estévez and C. Chang, Mater. Lett., 2015, 144, 138–141 CrossRef CAS.
- T. Song, Y. Gao, Z. Zhang and Q. Zhai, CrystEngComm, 2012, 14, 3694–3701 RSC.
- Z. Lu, C. Li and J. Han, Nat. Commun., 2018, 9(1), 276–283 CrossRef PubMed.
- H. B. Xu, T. T. Meek and Q. Y. Han, Mater. Lett., 2007, 61, 1246–1250 CrossRef CAS.
- Z. W. Xu, J. C. Yan and W. Chen, Mater. Lett., 2008, 62, 2615–2618 CrossRef CAS.
- Z. W. Liu, Q. Y. Han and J. G. Li, Composites Part B: Engineering, 2011, 42, 2080–2084 CrossRef.
- Z. W. Liu, M. Rakita and Q. Han, Metall. Mater. Trans. A, 2012, 43, 2116–2124 CrossRef CAS.
- F. Chen, X. Chen and L. J. Zou, Mater. Sci. Eng., A, 2016, 660, 241–250 CrossRef CAS.
- H. J. Qiu, L. Peng and X. Li, Corros. Sci., 2015, 92, 16–31 CrossRef CAS.
- N. Hirai, H. Tanaka and S. Hara, Appl. Surf. Sci., 1998, 130, 506–511 CrossRef.
- M. S. Kim and H. Nishikawa, J. Mater. Sci., 2013, 48, 5645–5652 CrossRef CAS.
- Y. Sun and T. J. Balk, Metall. Mater. Trans. A, 2008, 39, 2656–2665 CrossRef.
- J. Erlebacher, M. J. Aziz and A. Karma, Nature, 2001, 410, 450–453 CrossRef CAS PubMed.
- J. Erlebacher, J. Electrochem. Soc., 2004, 151, C614–C626 CrossRef CAS.
- Z. Zhang, Y. Wang and Y. Wang, Scr. Mater., 2010, 62, 137–140 CrossRef CAS.
- E. Detsi, Z. Vuković and S. Punzhin, CrystEngComm, 2012, 14, 5402–5406 RSC.
- T. T. Song, Y. L. Gao and Z. H. Zhang, Corros. Sci., 2013, 68, 256–262 CrossRef CAS.
- Z. W. Liu, X. M. Wang and Q. Y. Han, Metall. Mater. Trans. A, 2014, 45(2), 543–546 CrossRef CAS.
- Z. Liu, Q. Han and J. Li, Powder Technol., 2013, 247, 55–59 CrossRef CAS.
| This journal is © The Royal Society of Chemistry 2019 |

