 Open Access Article
Visualization of the intracellular location and stability of DNA flowers with a label-free fluorescent probe†
Yu Wei a,
Xuehui Xub,
Yingxu Shangb,
Qiao Jiang*b,
Can Li*a and
Baoquan Ding
 *b
*b
aBio-X Institutes, Key Laboratory for the Genetics of Developmental and Neuropsychiatric Disorders (Ministry of Education), Shanghai Jiao Tong University, 200030 Shanghai, China
bCAS Key Laboratory of Nanosystem and Hierarchical Fabrication, CAS Center for Excellence in Nanoscience, National Center for NanoScience and Technology, 11 BeiYiTiao, ZhongGuanCun, 100190 Beijing, China. E-mail: dingbq@nanoctr.cn
First published on 15th May 2019
Abstract
Rolling circle amplification (RCA) and rolling circle transcription (RCT) can be used to fabricate various structures and organize functional materials for biological applications. The full understanding of the interactions between RCA/RCT-derived structures and live cells is urgently demanded. Here, we present a label-free fluorescent strategy to study the intracellular location and stability of RCA-based DNA flowers in live cells. The DNA flower structures are co-assembled with carbazole-based biscyanine fluorophores, which are DNA detecting molecules and characterized by restriction of intramolecular rotation (RIR) induced strong fluorescent emission. When biscyanine molecules are encapsulated in the DNA flowers via electrostatic attraction, these confined RIR dyes can produce strong luminescent emission. Using this advantage, we use the RIR enhanced technique for direct visualization of the distribution and degradation of DNA flowers in live cellular systems. Our current research could be adapted to other advanced DNA-based materials, providing a new strategy to fabricate fluorescent DNA materials and realize controllable release of payloads.
1 Introduction
Rolling circle amplification (RCA) and rolling circle transcription (RCT) can be used to form long single-stranded DNA or RNA products by using a circular DNA template, a short DNA or RNA primer and special DNA or RNA polymerases. Recently, these isothermal enzymatic processes have emerged as programmable methods to fabricate various DNA1 or RNA2 nanostructures.Generating a composite nucleic acid/magnesium pyrophosphate flower-like structure and organizing functional materials, RCA or RCT-derived constructs have been fabricated for a variety of biological applications, such as biological assays,3 enhanced biocatalytic activity,4 multiplexed cellular imaging5 and traceable targeted drug delivery,6 antisense oligonucleotide delivery7 and siRNA delivery8,9 for cancer therapy, antigen and adjuvant delivery10,11 for cancer immunotherapy. Along with the utility of these flower-like materials, it is necessary to further investigate the interactions between RCA/RCT-derived structures and live cells.
Fluorescent dyes-labelled DNA strands are commercially available, which can hybridize the RCA/RCT-derived structures with fluorescent labels.5 Dye-conjugated dUTP/dNTP can be directly used during the RCA or RCT process and result in fluorescent flower-like structures directly.1,5 Despite the widespread use, these labelling approaches still suffer from several disadvantages, such as weak emission intensity, prone to photo-bleaching, tedious conjugation and relatively high costs. Moreover, the dissociated labelling moieties still show fluorescent emission, which cannot be directly use to monitor the degradation process of the RCA/RCT materials inside the live cells. New approaches that can track dynamic changes of the RCA/RCT materials in live cells are still needed.
Recently, a series of dye molecules with the aggregation-induced emission (AIE) phenomenon were synthesized and received extensive attention. Different from conventional fluorophores, AIE dyes are non-emissive or only weak emissive in the mono-molecular condition but show bright fluorescence in the aggregated state.12 The restriction of intramolecular motions (RIM), included the restriction of intramolecular rotation (RIR) and the restriction of intramolecular vibration (RIV), are considered to play an important role to the “turn-on” behaviour of organic AIE dyes.12–15 Several nanoparticles, such as ultrasmall gold nanoclusters, are reported displaying AIE fluorescence when confined in a nanogel.16 Particularly, several cyanine fluorophores have been reported for DNA detection, which show weak emission when they are molecularly dispersed but can switch to strongly luminescent state after binding to DNA helical structures.17 The significant enhancement of fluorescence of these carbazole-based biscyanine molecules can be attributed to the restriction of intramolecular rotation (RIR) induced by the DNA molecules.18 Though electrostatic attraction, the RIR-dyes can be confined in double-stranded DNA and produce strong fluorescent emission. Inspired by these “turn-on” dyes with the unique light-emitting property, specific light-up probes can be constructed for our RCA/RCT materials study.
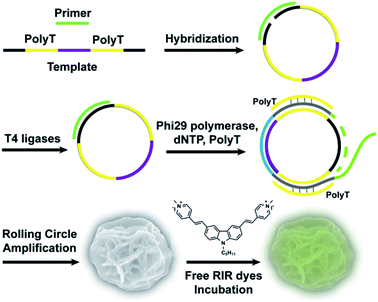
Here, we first report an effective, label-free, nontoxic approach to directly visualize intracellular location and stability of RCA-derived flower-like DNA structures by utilizing carbazole-based biscyanine molecules. These biscyanine molecules were encapsulated by DNA flower via electrostatic attraction, showing RIR-induced strong fluorescent emission. These dye-loaded DNA flowers are characterized and further administrated to live cells to study their intracellular distribution and stability (Fig. 1).
2 Materials and methods
2.1 Materials
All oligonucleotides (Table S1, ESI†) were purchased from Sangon Biotech (Shanghai, China). T4 ligase (400![[thin space (1/6-em)]](https://www.rsc.org/images/entities/char_2009.gif) 000 U mL−1), BSA (10 mg mL−1), phi 29 polymerase (10
000 U mL−1), BSA (10 mg mL−1), phi 29 polymerase (10![[thin space (1/6-em)]](https://www.rsc.org/images/entities/char_2009.gif) 000 U mL−1) and dNTP (2.5 mM) were purchased from New England Biolabs. Inc (Beijing, China). Hoechst 33
000 U mL−1) and dNTP (2.5 mM) were purchased from New England Biolabs. Inc (Beijing, China). Hoechst 33![[thin space (1/6-em)]](https://www.rsc.org/images/entities/char_2009.gif) 342 was purchased from Dojindo. LysoTracker red was purchased from Life Technologies. Carbazole-based biscyanine was synthesized according to Feng's protocol.19
342 was purchased from Dojindo. LysoTracker red was purchased from Life Technologies. Carbazole-based biscyanine was synthesized according to Feng's protocol.19
2.2 Synthesis of RIR dye (carbazole-based biscyanine) encapsulated DNA flowers (RIR-DFs)
For RCA reaction, the template-primer hybridized complex (0.3 μM) was incubated with phi29 DNA polymerase (1 U μL−1), dNTP (0.5 mM), polyT single strand (3.3 μM) and BSA (0.2 μg μL−1) in phi29 buffer solution (50 mM Tris–HCl, 10 mM (NH4)2SO4, 10 mM MgCl2, 4 mM dithiothreitol). PolyT strand (3.3 μM) was added to form duplex parts in the RCA products. RCA reaction was performed at 30 °C for 7 h followed by heat inactivation at 65 °C for 10 min. After cooling to 4 °C, the DNA flowers (DFs), were washed twice by double-distilled H2O and collected by centrifuge at 5000 rpm for 10 min, stored at 4 °C for future use. The concentration of DFs was quantified by measuring the absorbance at 260 nm.
2.3 Characterization of DFs and RIR-DFs
2.4 Cell culture
RAW264.7 macrophage-like cells were cultured in RPMI 1640 medium supplemented with 10% heat-inactivated FBS, 0.15% NaHCO3, penicillin (100 U mL−1), streptomycin (100 mg mL−1), and L-glutamine (2 mM) at 37 °C in humidified air containing 5% CO2.2.5 Cell viability assays
RAW264.7 cells were seeded on 96-well plates (5 × 10³ cells per well) and cultured overnight. Cells were incubated with RIR dyes (0.36 μM) or RIR-DFs (7.7 ng μL−1, containing 0.36 μM RIR dyes) in 100 μL fresh RPMI 1640 medium per well at 37 °C. After 6 hours incubation, the medium was replaced by 100 μL fresh 1× CCK-8 (Cell Counting Kit-8, Dojindo) solution diluted by serum-free RPMI 1640 medium. After 1 h incubation, the absorbance of the plate was measured at 450 nm a microplate reader (TECAN, InfiniteM200, Switzerland).2.6 Confocal microscopic imaging
RAW264.7 cells were seeded on confocal dishes (5 × 10⁵ cells per dish) and cultured overnight. Cells were incubated with RIR-DFs (7.7 ng μL−1) in 1 mL fresh RPMI 1640 medium for 6 h at 37 °C. After washing three times with 1× PBS, the treated cells were incubated with LysoTracker red (Invitrogen, 2 μM) for 20 min and Hoechst 33![[thin space (1/6-em)]](https://www.rsc.org/images/entities/char_2009.gif) 342 (Invitrogen, 4 μg mL−1) for 5 min at 37 °C for lysosome and nuclei labelling. All images were obtained using a laser confocal fluorescent microscopy (Olympus, Japan).
342 (Invitrogen, 4 μg mL−1) for 5 min at 37 °C for lysosome and nuclei labelling. All images were obtained using a laser confocal fluorescent microscopy (Olympus, Japan).
2.7 Intracellular stability of RIR-DFs
RAW264.7 cells were seeded on confocal dishes at a density of 5 × 10⁵ cells per well and cultured overnight. Cells were incubated with RIR-DFs (7.7 ng μL−1) in 1 mL fresh RPMI 1640 medium for 6 h at 37 °C. After washing three times with 1× PBS, the cells were cultured for extra 0, 24, 48, 72 hours to visualize the intracellular stability of RIR-DFs by a laser confocal fluorescent microscopy.2.8 Statistical analysis
Confocal images were quantitatively analysed by Image J for average intracellular fluorescence intensity. Quantitative data were presented as mean ± s.d. of three independent experiments. Statistics were performed using Origin Pro 8.5 software.3 Results and discussion
3.1 Characterization of DFs and RIR-DFs
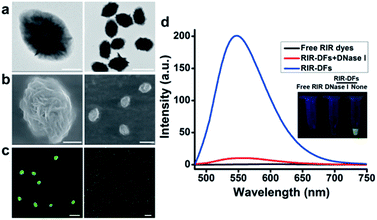
The fabrication of RIR biscyanine-loaded DNA flower hybrid structure is schematically illustrated in Fig. 1. Ellipsoid shaped DNA flowers (DFs) were firstly constructed by RCA approach according to Tan's method1 (see detailed information in the section of Materials and methods). During the RCA process, while the DF containing tandem polyA sequences was being synthesized, the polyT strands were hybridized with the DFs for the docking sites of carbazole-based biscyanine fluorophores at the same time.18 The polyacrylamide gel electrophoresis (PAGE) results indicated that DNA flower structure was successfully generated (Fig. S1, ESI†). Transmission electron microscope (TEM) images showed that the sizes of the ellipsoid shaped DFs were approximate of 1500 nm × 1000 nm (Fig. S2, ESI†).After washed by ddH2O to remove the redundant synthesis materials, the purified DFs were incubated with the carbazole-based biscyanine molecules at room temperature for 30 min to form the self-assembled biscyanine-DNA flower structures via electrostatic interaction. RIR dye-loaded DNA flower structures (RIR-DFs) were subsequently analysed by TEM and SEM and the similar flower-like structures can be clearly visualized (Fig. 2a and b). Zeta-potential of bare DNA flowers and the RIR-DFs were measured (Fig. S5, ESI†). The shift of DNA flower particle surface charge from −30 mV (bare DFs) to −25 mV (RIR-DFs) were observed, which supported the loading of RIR dyes in the DF particle was through electrostatic attraction. The unloaded RIR dyes showed weak fluorescent emission (peak: 600 nm) when dissolved in 1× PBS buffer (Fig. 2c). After assembled with DFs, a dramatic increase of fluorescence intensity and blue shift of peak (peak: 547 nm) were observed, demonstrating the RIR induced strong fluorescent emission of biscyanine molecules by their DF carriers. Upon titration of biscyanine (10–25 μM) to the DFs solutions (256.8 ng μL−1), significant enhancement of fluorescence intensity was observed compared to the unloaded RIR biscyanine (Fig. S4, ESI†). Upon addition 12 μM of biscyanine to the DFs solution, the fluorescence of RIR-DFs reached the maximum, indicating the loaded RIR dye were saturated to the DF carriers. While higher concentration of biscyanine may induce slightly aggregation of RIR-DFs, which decreases the RIR emission. The assembled RIR-DFs were subsequently analysed by fluorescent microscopy. This image suggested that the co-assembled RIR-DFs can be easily visualized by the strong fluorescent emission under the microscopy (Fig. 2c).
After incubated with DNase I (15 U mL−1) for 40 h at 37 °C for DNA molecules degradation, the fluorescence signal of the RIR-DFs (256.8 ng μL−1) was significantly reduced (Fig. 2d). A gradually decrease of fluorescence intensity of RIR-DFs incubated with DNase I (15 U mL−1) for different time was observed in Fig. S6 (ESI†). The fluorescence reduction for the assemblies of RIR-DFs after DNase I treatment was directly observed (Fig. 2d, the inset pictures). SEM characterization of RIR-DFs before and after DNase I treatment was also performed (Fig. S7, ESI†). The results showed that structures of RIR-DFs were degraded after DNase I treatment (15 U mL−1 for 40 h at 37 °C). The results indicated that the carbazole-based biscyanine fluorophores can be utilized as sensitive molecules to label DNA flower and study its cellular trafficking and stability.
3.2 Intracellular location of RIR-DFs
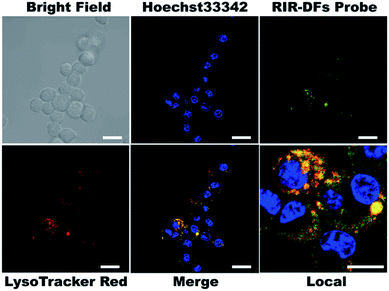
To investigate the biocompatibility of the DNA flowers, we firstly examined the viabilities of RIR dye molecules or RIR-DFs treated RAW264.7 macrophage-like cells by a CCK-8 assay. In Fig. S8,† both RIR dyes (0.36 μM) and RIR-DFs (7.7 ng μL−1, containing 0.36 μM RIR dyes) exhibited no detectable cytotoxicity after 6 h incubation. Confocal imaging was then performed on RAW264.7 cells to visualize the cellular location of RIR dyes loaded DNA flower structures. RIR-DFs (7.7 ng μL−1) were administered to live macrophages for 6 h treatment. The intracellular fluorescent spectrum was determined (Fig. S9†), which is similar to the fluorescence spectrum of RIR-DFs in solution (Fig. 2d). Nuclei and lysosomes of macrophages were subsequently stained by Hoechst 33![[thin space (1/6-em)]](https://www.rsc.org/images/entities/char_2009.gif) 342 (blue) and LysoTracker (red), respectively. Z-axis scanning images of cells incubated with RIR-DFs were confirmed that the green fluorescence was emitted from the RIR biscyanine molecules co-assembled with DNA flowers inside cells (Fig. S10, ESI†). RIR-DFs were visible as green fluorescent dots in the cytoplasm, which partially merged with LysoTracker red signals after 6 h incubation (Fig. 3). The co-localization of fluorescence indicated that internalization of RIR-DF was mediated by endocytosis, and the uptaked RIR-DFs were accumulated in lysosomes. The results demonstrated that the internalization of RIR-DFs can be directly monitored by the label-free approach. Importantly, DNA flower constructs were observed to enter RAW264.7 cells and accumulate in lysosomes, which is significant to rationally design nanocarriers fated to the macrophages and the lysosomes, such as immunostimulatory moieties delivery vehicles8 or nanovaccines.9
342 (blue) and LysoTracker (red), respectively. Z-axis scanning images of cells incubated with RIR-DFs were confirmed that the green fluorescence was emitted from the RIR biscyanine molecules co-assembled with DNA flowers inside cells (Fig. S10, ESI†). RIR-DFs were visible as green fluorescent dots in the cytoplasm, which partially merged with LysoTracker red signals after 6 h incubation (Fig. 3). The co-localization of fluorescence indicated that internalization of RIR-DF was mediated by endocytosis, and the uptaked RIR-DFs were accumulated in lysosomes. The results demonstrated that the internalization of RIR-DFs can be directly monitored by the label-free approach. Importantly, DNA flower constructs were observed to enter RAW264.7 cells and accumulate in lysosomes, which is significant to rationally design nanocarriers fated to the macrophages and the lysosomes, such as immunostimulatory moieties delivery vehicles8 or nanovaccines.9
3.3 Intracellular stability of RIR-DFs
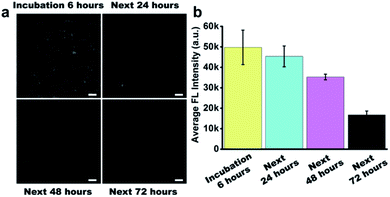
Before the study of the intracellular stability of DNA flower structure, we incubated RIR-DFs (7.7 ng μL−1) with 10% non-inactivity fetal bovine serum (FBS) for different time period (0–72 h). In Fig. S11 (ESI†), the fluorescence intensity of RIR-DFs incubated with FBS for 6 hours had no observed reduction. The phenomenon indicated that RIR-DFs probes were stable enough to finish cell experiments. We next investigated the cellular stability of RIR-DFs using RAW264.7 macrophage-like cells. After incubated with RIR-DFs for 6 h, the macrophages were washed by 1× PBS and then cultured with fresh complete medium for extra 0, 24, 48, 72 hours to allow the intracellular degradation of DNA flower. In the confocal images (Fig. 4a), RIR-DFs pre-treated cells displayed significant fluorescence decay along with the culture period. The quantitative analysis of confocal microscopy images by ImageJ agreed with that fluorescence decline, suggesting that DNA flower gradually degraded in the cellular environment within 72 h (Fig. 4b). The finally released biscyanine molecules exhibited efficient intramolecular rotational motions, showing weak fluorescent emission. By detecting the alternation of fluorescence of the RIR-DFs treated cells, the gradually dissociation of DNA flower structures inside the cells was monitored. The results indicated that the DNA flower materials could be advanced in controlled release systems for multifunctional payloads.4 Conclusions
In this study, we present an effective, label-free, nontoxic approach to study the intracellular location and stability of RCA-derived DNA materials in live cells based on DNA structures co-assembly with carbazole-based biscyanine fluorophores. When biscyanine molecules, which are RIR dyes and can specifically bind to DNA molecules via electrostatic attraction, were confined in the DNA flowers, strong fluorescent emission was triggered. While DNA nanostructures were degraded by enzymes, the RIR dyes were dissociated and showed weak emission. These biscyanine-encapsulated DNA flowers entered live cells and accumulated in lysosome, and dissociated within 72 hours. These results indicated that RCA-derived DNA materials could be designed to carry molecular cargos whose targets are in lysosomes and to realize controllable release of cargos triggered by mild acidic environment or enzymes. Our strategy enabled the facile visualization of cellular distribution and stability of the DNA flowers in the live cells, which is expected to be advanced to other DNA-based materials. We believe that this work opens a new direction for cellular imaging, cancer therapies and many other applications of RCA-based materials.Conflicts of interest
There are no conflicts to declare.Acknowledgements
This work was supported by the National Natural Science Foundation of China (31700871, 21573051, 21708004, 51761145044), Science Fund for Creative Research Groups of the National Natural Science Foundation of China (21721002), the National Basic Research Program of China (2016YFA0201601, 2018YFA0208900), Key Research Program of Frontier Sciences, CAS, Grant QYZDB-SSW-SLH029, CAS Interdisciplinary Innovation Team, and K. C. Wong Education Foundation.References
- G. Z. Zhu, R. Hu, Z. L. Zhao, Z. Chen, X. B. Zhang and W. H. Tan, J. Am. Chem. Soc., 2013, 135, 16438–16445 CrossRef CAS PubMed.
- J. B. Lee, J. Hong, D. K. Bonner, Z. Poon and P. T. Hammond, Nat. Mater., 2012, 11, 316–322 CrossRef CAS PubMed.
- E. Kim, S. Agarwal, N. Kim, F. S. Hage, V. Leonardo, A. Gelmi and M. M. Stevens, ACS Nano, 2019, 13, 2888–2900 CrossRef CAS PubMed.
- Y. C. Yan, J. Li, W. H. Li, Y. Wang, W. L. Song and S. Bi, Nanoscale, 2018, 10, 22456–22465 RSC.
- R. Hu, X. B. Zhang, Z. L. Zhao, G. Z. Zhu, T. Chen, T. Fu and W. H. Tan, Angew. Chem. Int. Ed., 2014, 53, 5821–5826 CrossRef CAS PubMed.
- L. Mei, G. Z. Zhu, L. P. Qiu, C. C. Wu, H. P. Chen, H. Liang, S. Cansiz, Y. F. Lv, X. B. Zhang and W. H. Tan, Nano Res., 2015, 8, 3447–3460 CrossRef CAS PubMed.
- Y. H. Roh, J. B. Lee, K. E. Shopsowitz, E. C. Dreaden, S. W. Morton, Z. Poon, J. Hong, I. Yamin, D. K. Bonner and P. T. Hammond, ACS Nano, 2014, 8, 9767–9780 CrossRef CAS PubMed.
- M. Jang, J. H. Kim, H. Y. Nam, I. C. Kwon and H. J. Ahn, Nat. Commun., 2015, 6, 7930–7941 CrossRef CAS PubMed.
- Y. H. Roh, J. Z. Deng, E. C. Dreaden, J. H. Park, D. S. Yun, K. E. Shopsowitz and P. T. Hammond, Angew. Chem. Int. Ed., 2016, 55, 3347–3351 CrossRef CAS PubMed.
- G. Z. Zhu, Y. J. Liu, X. Y. Yang, Y. H. Kim, H. M. Zhang, R. Jia, H. S. Liao, A. Jin, J. Lin, M. Aronova, R. Leapman, Z. H. Nie, G. Niu and X. Y. Chen, Nanoscale, 2016, 8, 6684–6692 RSC.
- G. Z. Zhu, L. Mei, H. D. Vishwasrao, O. Jacobson, Z. T. Wang, Y. J. Liu, B. C. Yung, X. Fu, A. Jin, G. Niu, Q. Wang, F. W. Zhang, H. Shroff and X. Y. Chen, Nat. Commun., 2017, 8, 1482–1494 CrossRef PubMed.
- J. D. Luo, Z. L. Xie, J. W. Y. Lam, L. Cheng, H. Y. Chen, C. F. Qiu, H. S. Kwok, X. W. Zhan, Y. Q. Liu, D. B. Zhu and B. Z. Tang, Chem. Commun., 2001, 18, 1740–1741 RSC.
- Y. N. Hong, J. W. Y. Lam and B. Z. Tang, Chem. Commun., 2009, 0, 4332–4353 RSC.
- Q. Peng, Y. P. Yi, Z. G. Shuai and J. S. Shao, J. Am. Chem. Soc., 2007, 129, 9333–9339 CrossRef CAS PubMed.
- D. Ding, K. Li, B. Liu and B. Z. Tang, Accounts Chem. Res., 2013, 46, 2441–2453 CrossRef CAS PubMed.
- N. Goswami, F. X. Lin, Y. B. Liu, D. T. Leong and J. P. Xie, Chem. Mater., 2016, 28, 4009–4016 CrossRef CAS.
- X. B. Shen, Q. Jiang, J. Y. Wang, L. R. Dai, G. Z. Zou, Z. G. Wang, W. Q. Chen, W. Jiang and B. Q. Ding, Chem. Commun., 2012, 48, 11301–11303 RSC.
- J. Xu, Z. Song, Y. Fang, J. Mei, L. Jia, A. J. Qin, J. Z. Sun, J. Ji and B. Z. Tang, Analyst, 2010, 135, 3002–3007 RSC.
- X. J. Feng, P. L. Wu, F. Bolze, H. W. C. Leung, K. F. Li, N. K. Mak, D. W. J. Kwong, J. Nicoud, K. W. Cheah and M. S. Wong, Org. Lett., 2010, 12, 2194–2197 CrossRef CAS PubMed.
Footnote |
| † Electronic supplementary information (ESI) available. See DOI: 10.1039/c9ra01769k |
| This journal is © The Royal Society of Chemistry 2019 |


