 Open Access Article
Structural distortion induced ferromagnetism in two-dimensional metal-free graphitic-C3N4 nanosheets
Chenyang Gao*a,
Baorui Xiab,
Daqiang Gao b and
Yonggang Liu
 *b
*b
aCollege of Science, Gansu Agricultural University, Lanzhou, China 730070. E-mail: gaocy@gsau.edu.cn
bKey Laboratory for Magnetism and Magnetic Materials of MO, Key Laboratory of Special Function Materials and Structure Design of MOE, Lanzhou University, Lanzhou 730000, P. R. China. E-mail: liuyg17@lzu.edu.cn
First published on 10th July 2019
Abstract
With the assistance of innovative approaches driven by nanotechnology, engineering 2D materials into designed architectures or desired structures could tailor the electronic structure into an appropriate energy band structure, tuning the properties of the materials to be a predictable manner. Here we systematically studied the role that the structural distortion plays in the magnetism by taking two-dimensional metal-free graphitic-C3N4 as an example. Through the controllable structural distortion engineering introduced by post-heat-treatment in the experiment, the ferromagnetism is observed in graphitic-C3N4 nanosheets, which benefits from the electronic structural deformation, showing intriguing structural distortion-dependent ferromagnetism. This study not only offers new insight into the in-depth understanding of the structural distortion effect on the magnetism, but also provides a new way for searching and designing new magnetic materials.
Introduction
Graphene, a typical 2D material, has experienced an unprecedented rapid evolution since the last decade, inspiring diverse applications such as memory devices, flexible electronics and energy storage equipment.1,2 Owing to the resultant quantum effects induced by the reduction of dimension and size, graphene and graphene-like 2D materials exhibit exotic electronic structure and many intriguing physicochemical properties which are distinctively different in their bulk parental counterparts. Results indicate that such materials span the entire range of electronic structures (from insulators to metals) and play a vital role in various applications such as optoelectronics, spintronics, catalysis, chemical and biological sensors, supercapacitors, solar cells, lithium ion batteries and so on.3–5With the unremitting effort, a variety of 2D crystal materials have been successfully synthesized experimentally, such as transition-metal dichalcogenides, hexagonal boron nitride, black phosphorus as well as graphitic-C3N4 (g-C3N4), whose photocatalysis properties have been widely studied.6–8 In addition, there have been increasing evidence indicates that spontaneous magnetization could also occur in 2D crystal materials.9,10 Novel magnetic materials may endow interesting possibilities for potential device applications in spintronics and quantum information processing. Thus, the pursuit of tuneable ferromagnetism in 2D crystal materials has been a persistent goal for the long term. Researchers have proposed many ways to introduce ferromagnetism into 2D crystal materials such as introducing defects,11 fluorination12 and hydrogenation.13 It should be stressed that achieving these methods in experiments are hindered by several challenges. In addition, long relaxation time is an important factor for spin information delivery in the spin-dependent transport study, as well as, the 2D materials with magnetism arising from pure s/p electrons present the weak spin–orbit coupling.14,15 By virtue of the fact that the spin relaxation time is inversely proportional to the strength of spin–orbit coupling, the metal-free 2D materials, such as graphene, will bring an interesting issue in the spin-dependent transport property, which is more suitable for the future generation of spintronic devices. Unfortunately, the pristine graphene suffers from the drawback of zero band gap.16 Similar to the case of graphene, the polymeric semiconductor g-C3N4, whose lattices base on triazine and heptazine rings, have 2D π-conjugated planar layers, and it has elicited ripples of excitement in the research communities as its appealing electronic band structure. In contrast to graphene, g-C3N4 is semiconducting with a moderate band gap.17 Furthermore, the metal-free material g-C3N4, which only have s/p electrons, would result in weak spin–orbit coupling. Therefore, it can provide a longer spin relaxation time that facilitates the transport of spin. On account of these fascinating properties of g-C3N4 making it function as a candidate of spintronic devices.18
Recently, Gao et al.12 and Xie et al.13 have shown that the fluorine dangling bonds and hydrogen dangling bonds in the g-C3N4 are capable of introducing ferromagnetism, revealing that these dangling bonds are able to trigger spin regulation, but this is not a necessary condition for the generation of magnetic. It is important to accentuate that fluorine and hydrogen bonded with nitrogen lead to the twisted planar structure. The theoretical calculation also exhibits that the local magnetic moments mainly located on the N atoms and there is no net magnetic moment located on F and H atoms. Therefore, we speculate that the structural deformation can act as a pivotal part in the emergence of magnetic properties.19 Based on these results, the effect of structure distortion on the magnetic property of g-C3N4 nanosheets is investigated in detail.
Perfect two-dimensional g-C3N4 is a planar structure and non-magnetic. Here we introduce structural deformation by post-heat-treatment to induce ferromagnetism in g-C3N4 nanosheets. Through the study, we find that the structure of two-dimensional g-C3N4 nanosheets changed significantly, and the structural distortion of the material plays a crucial role in the spin polarization.20 Moreover, we also find that the saturation magnetization of the g-C3N4 is dependent on the structure distortion, and the saturation magnetization reaches to a maximum in sample annealed for 24 hours. This controllable magnetic would allow great flexibility in the design and optimization of 2D-materials-based devices.
Experimental
Synthesis of structural distorted two-dimensional metal-free graphitic-C3N4 nanosheets
The 2D g-C3N4 nanosheets were prepared by one-step thermal decomposition method. In a typical synthesis, 5 g of urea powder was placed into an alumina crucible with a cover. Then the crucible was heated up to 500 °C with a heating rate of 10 °C min−1. Further heat treatment was performed at 450 °C for 3, 6, 12, 24 h (denoted as T3, T6, T12, T24) and a controlled sample without post heat treatment (denoted as T0).Characterization
The crystal structure was characterized by X-ray diffraction (XRD) using a Philips X'pert diffractometer with Cu Kα radiation. Quantitative analysis of the XRD data was undertaken by the MDI Jade 5.0 software. Transmission electron microscope (TEM Hitachi s-4800) and the high-resolution transmission electron microscope (HRTEM, TecnaiTM G2F30, FEI, USA) was employed to study the morphology of the samples. X-ray photoelectron spectroscopy (XPS, VGESCALAB 210) was utilized to determine the bonding characteristics of the sample. The infrared absorption spectra of the samples were recorded by the KBr pellet method of a Fourier transform infrared spectrum (FTIR; NEXUS 670, Thermo Nicolet Corp., Madison, WI, USA) in the range of 500 to 2000 cm−1. The photoluminescence properties were investigated using a micro-Raman spectrometer in the backscattering configuration excited using a He Cd laser with a power intensity of 0.2 mW. The magnetic properties were characterized by a Quantum Design MPMS magnetometer based on a superconducting quantum interference device (SQUID). We used a vibrating sample magnetometer (VSM) to study the static magnetization of the sample. Due to the magnetic signals of the samples were quite small, we had deducted the background signal from the sample holder in the VSM.Results and discussion
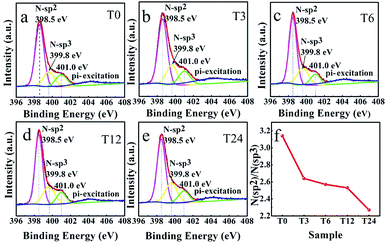
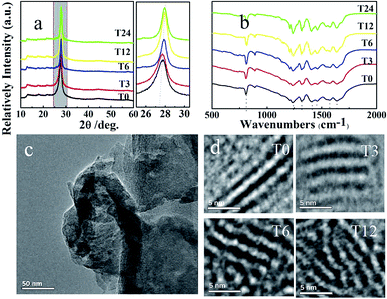
The phase structure of the samples was investigated by XRD, the results of which are shown in Fig. 1, and all the g-C3N4 samples exhibit two peaks. The relatively weak peak at 12.9° is associated with an in-plane structural packing motif, which corresponds to a distance d = 0.68 nm and can be indexed as (100) plane.21 The intense peak at 27.6° for g-C3N4 is due to the stacking of the conjugated aromatic system, indexed as the (002) plane for graphitic materials. The calculated interplanar distance is d = 0.32 nm.22 Further observation indicates that the (002) peak broadened gradually and decreases in intensity. From partially enlarged view we can see that the (002) peak slightly shifts toward higher diffraction angles with increased heat-treatment time, indicating a more dense pack of C–N planes.23 The slight change of interplanar distance which may be caused by introducing structure distortion during heat treatment. The tri-s-triazine building units of these g-C3N4 samples are further demonstrated by the nearly identical absorption bands from the Fourier transform infrared (FTIR). As observed in Fig. 1b, the main absorption band at 808.6 cm−1 corresponds to the out-of-plane bending vibration mode of g-C3N4 units.24 Besides, the pronounced absorption at 1640.5, 1575.3, 1460.3 and 1406.7 cm−1 are linked to typical stretching vibration modes of tri-s-triazine rings. The intense bands at 1318.5 and 1241.8 cm−1 represent the stretching vibration of fragments of C–N(–C)–C (full condensation) or C–NH–C (partial condensation).25 In comparison with unmodified g-C3N4, slightly blue-shifted is caused by the structural deformation. Fig. 1c shows the transmission electron microscopes result of T24, from which we can clearly see the homogeneous sheetlike structure. High-resolution transmission electron microscope graph of T0, T3, T6 and T12 are shown in Fig. 1d. It is noticed that the structural deformation increases with heat treatment time growing. The above results confirmed that pure phase g-C3N4 and expected products are obtained in our case.Prior to the magnetic investigation, to quantify the chemical composition and bonding characteristics among elements involved of the g-C3N4 nanosheets, X-ray photoelectron spectroscopy was employed. Results declare that all the samples only contain C, N and O elements. The contain of O is less than 3 atom%, which may be caused by the surface-absorbed. The N 1s peak of sample is exhibited in Fig. 2. In N 1s 398.5 eV is identified as sp2 hybridized aromatic N bonded to carbon atoms (C![[double bond, length as m-dash]](https://www.rsc.org/images/entities/char_e001.gif) N–C); the signal at 399.8 eV corresponding to the tertiary N bonded to carbon atoms to form N–(C)3 or H–N–(C)2. The weak peak at 401.0 eV shows the occurrence of tertiary nitrogen N–(C)3 groups.26 N 1s peak at 404.1 is attributed to the π-excitations. The value of N(sp2)/N(sp3) is displayed in Fig. 2f. It is worth to note that the value decreases with heat treatment time increasing. The smaller value represents bigger structural distortion.27 From that point, we further prove that the structural deformation of samples is magnified as post-annealing time increases.
N–C); the signal at 399.8 eV corresponding to the tertiary N bonded to carbon atoms to form N–(C)3 or H–N–(C)2. The weak peak at 401.0 eV shows the occurrence of tertiary nitrogen N–(C)3 groups.26 N 1s peak at 404.1 is attributed to the π-excitations. The value of N(sp2)/N(sp3) is displayed in Fig. 2f. It is worth to note that the value decreases with heat treatment time increasing. The smaller value represents bigger structural distortion.27 From that point, we further prove that the structural deformation of samples is magnified as post-annealing time increases.
 | ||
| Fig. 2 (a)–(e) The high-resolution XPS spectrum for the samples with different heat treatment time and (f) the curve of the value of N sp2/N sp3 changed with heat treatment time increasing. | ||
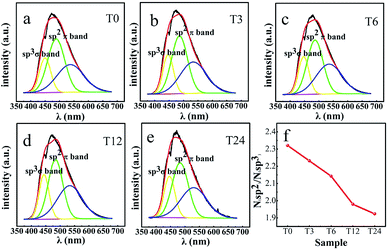
To further confirm that we have successfully introduced a controlled structure deformation in the samples, the photoluminescence properties were investigated. According to the report of Das et al., the emission characteristics of g-C3N4 is related to sp3 C–N σ band and sp2 C–N π band. In Fig. 3, the PL spectrum shows strong blue luminescence at 470 nm. The states consisted of the sp3 C–N σ band, sp2 C–N π band, and the lone pair (LP) state of the bridge nitride atom are responsible for the luminescence from g-C3N4.28,29 The PL spectrum can deconvolute into three major peaks position at 445, 483, 529 nm originating from three different pathway transition: σ*–LP, π*–LP, and π*–π, respectively.30 The value of N(sp2)/N(sp3) is displayed in Fig. 3f, where the value decreases with the post-annealing time increasing. The similar results have been found from the XPS. So we sufficiently prove that the structural deformation of the g-C3N4 increases with heat treatment time growing.
 | ||
| Fig. 3 (a)–(e) The PL spectrum of the samples with different heat treatment time and (f) the curve of the value of N sp2/N sp3 changed with heat treatment time crease. | ||
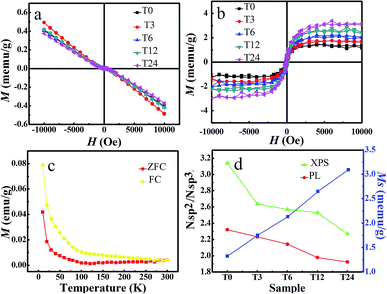
From the above discussion, we have received the desired samples. Then we exploit static magnetization to probe the magnetic response of g-C3N4. We measured the magnetization versus applied field curves for all the samples. The primitive magnetizations versus magnetic field (M–H) curves for all the samples are shown in Fig. 4a. The results indicate that the samples show the ferromagnetic signal in the lower field region mixture with the diamagnetic signal in the high field region. After subtracting the diamagnetic signal, the clear S-like M–H curves are observed (in Fig. 4b). The saturation magnetization of T0, T3, T6, T12 and T24 are 0.0013, 0.0017, 0.0021, 0.0026 and 0.0031 emu g−1, respectively, similar to those reported in other graphene-related materials.31 As is shown in Fig. 4d, the saturation magnetization grows with post-annealing time. The observed ferromagnetism in our case is considered to be related to structural distortion, where the structural distortion can dramatically modify the electronic structure of the materials which is directly connected with the magnetic properties of the materials. Structural deformation of the g-C3N4 increases with post-annealing time, which has more influence on the electronic structure and saturation magnetization. The zero-field-cooling (ZFC) and field-cooling (FC) measurements were also used to characterize further details of the FM ordering. The measurement is performed on the sample with the temperature range from 5 to 300 K under the external field of 5000 Oe. The result is shown in Fig. 4c. Noting that the ZFC curves are close to the FC curves, but do not overlap in the whole measured temperature range, which proves that the Curie temperature of the sample is over 300 K. This has already been demonstrated by isothermal magnetization versus applied magnetic field measurements previously. Besides, the ZFC curve shows no blocking temperature in the range 5–300 K, revealing that there are no ferromagnetic clusters in the sample. Ferromagnetism of the sample is the intrinsic nature and should be associated with the structural distortion. A paramagnetic upturn occurred below 50 K, which should be attributed to unreconstructed point defects. According to what is described above, we got structure distortion-depended magnetic two-dimensional metal-free graphitic-C3N4 nanosheets as shown in Fig. 4d. It can be seen that the Ms of the g-C3N4 nanosheets increases as the increase of the structural distortion (showing by the N sp2/N sp3 in both XPS and PL fitting results), revealing it is an effective way to introduce ferromagnetism in non-magnetic materials by leading structure distortion.
Conclusions
In conclusion, we have investigated the effect of structure distortion on the magnetic property of two-dimensional metal-free graphitic-C3N4 nanosheets. In this work, the structural distortion of the samples was induced by a facile post-annealing treatment. By controlling the different annealing time, we find that the ferromagnetism of the samples can be precisely controlled, and the maximum saturation magnetization obtained in the sample is 0.0031 emu g−1. In addition, we also find that the Curie temperature of all the samples exceeds room temperature. Our results provide more possibilities for inducing and manipulating magnetic moments in ultrathin metal-free nanosheets, which have potential applications in spintronics.Conflicts of interest
There are no conflicts to declare.Acknowledgements
This work is supported by the National Natural Science Foundation of China (Grant No. 11474137), the Fundamental Research Funds for the Central Universities (Grant lzujbky-2018-121 and LZUMMM2018017).Notes and references
- J. H. Zheng and L. Zhang, Appl. Catal., B, 2018, 231, 34–42 CrossRef CAS.
- X. S. Li, W. W. Cai, J. H. An, S. Kim, J. Nah, D. X. Yang, R. Piner, A. Velamakanni, I. Jung, E. Tutuc, S. K. Banerjee, L. Colombo and R. S. Ruoff, Science, 2009, 324, 1312–1314 CrossRef CAS PubMed.
- Y. D. Ma, Y. Dai, M. Guo, C. W. Niu, Y. T. Zhu and B. B. Huang, ACS Nano, 2012, 6, 1695–1701 CrossRef CAS.
- J. Feng, L. L. Peng, C. Z. Wu, X. Sun, S. L. Hu, C. W. Lin, J. Dai, J. L. Yang and Y. Xie, Adv. Mater., 2012, 24, 1969–1974 CrossRef CAS.
- J. N. Coleman, M. Lotya, A. O'Neill, S. D. Bergin, P. J. King, U. Khan, K. Young, A. Gaucher, S. De, R. J. Smith, I. V. Shvets, S. K. Arora, G. Stanton, H. Y. Kim, K. Lee, G. T. Kim, G. S. Duesberg, T. Hallam, J. J. Boland, J. J. Wang, J. F. Donegan, J. C. Grunlan, G. Moriarty, A. Shmeliov, R. J. Nicholls, J. M. Perkins, E. M. Grieveson, K. Theuwissen, D. W. McComb, P. D. Nellist and V. Nicolosi, Science, 2011, 331, 568–571 CrossRef CAS PubMed.
- J. R. Ran, T. Y. Ma, G. P. Gao, X. W. Du and S. Z. Qiao, Energy Environ. Sci., 2015, 8, 3708–3717 RSC.
- J. H. Li, B. A. Shen, Z. H. Hong, B. Z. Lin, B. F. Gao and Y. L. Chen, Chem. Commun., 2012, 48, 12017–12019 RSC.
- L. K. Li, Y. J. Yu, G. J. Ye, Q. Q. Ge, X. D. Ou, H. Wu, D. L. Feng, X. H. Chen and Y. B. Zhang, Nat. Nanotechnol., 2014, 9, 372–377 CrossRef CAS.
- J. F. Liu, Z. S. Ma, A. R. Wright and C. Zhang, J. Appl. Phys., 2008, 103, 6 Search PubMed.
- X. M. Zhang, M. W. Zhao, A. Z. Wang, X. P. Wang and A. J. Du, J. Mater. Chem. C, 2013, 1, 6265–6270 RSC.
- D. Q. Gao, Q. Xu, J. Zhang, Z. L. Yang, M. S. Si, Z. J. Yan and D. S. Xue, Nanoscale, 2014, 6, 2577–2581 RSC.
- D. Q. Gao, Y. G. Liu, M. Y. Song, S. P. Shi, M. S. Si and D. S. Xue, J. Mater. Chem. C, 2015, 3, 12230–12235 RSC.
- K. Xu, X. L. Li, P. Z. Chen, D. Zhou, C. Z. Wu, Y. Q. Guo, L. D. Zhang, J. Y. Zhao, X. J. Wu and Y. Xie, Chem. Sci., 2015, 6, 283–287 RSC.
- T. Hu, A. Hashmi and J. S. Hong, Sci. Rep., 2014, 4, 7 Search PubMed.
- D. Ghosh, G. Periyasamy, B. Pandey and S. K. Pati, J. Mater. Chem. C, 2014, 2, 7943–7951 RSC.
- R. G. Quhe, J. X. Zheng, G. F. Luo, Q. H. Liu, R. Qin, J. Zhou, D. P. Yu, S. Nagase, W. N. Mei, Z. X. Gao and J. Lu, NPG Asia Mater., 2012, 4, 10 CrossRef.
- Q. J. Xiang, J. G. Yu and M. Jaroniec, J. Phys. Chem. C, 2011, 115, 7355–7363 CrossRef CAS.
- Y. Xu and S. P. Gao, Int. J. Hydrogen Energy, 2012, 37, 11072–11080 CrossRef CAS.
- X. W. Li, J. Zhou, Q. Wang, Y. Kawazoe and P. Jena, J. Phys. Chem. Lett., 2013, 4, 259–263 CrossRef CAS.
- H. S. Li, H. Q. Hu, C. J. Bao, J. Hua, H. C. Zhou, X. B. Liu, X. D. Liu and M. W. Zhao, Phys. Chem. Chem. Phys., 2015, 17, 6028–6035 RSC.
- F. Dong, L. W. Wu, Y. J. Sun, M. Fu, Z. B. Wu and S. C. Lee, J. Mater. Chem., 2011, 21, 15171–15174 RSC.
- M. N. Uddin and Y. S. Yang, J. Mater. Chem., 2009, 19, 2909–2911 RSC.
- Y. J. Cui, Z. X. Ding, P. Liu, M. Antonietti, X. Z. Fu and X. C. Wang, Phys. Chem. Chem. Phys., 2012, 14, 1455–1462 RSC.
- Y. C. Zhao, Z. Liu, W. G. Chu, L. Song, Z. X. Zhang, D. L. Yu, Y. J. Tian, S. S. Xie and L. F. Sun, Adv. Mater., 2008, 20, 1777 CrossRef CAS.
- J. H. Liu, T. K. Zhang, Z. C. Wang, G. Dawson and W. Chen, J. Mater. Chem., 2011, 21, 14398–14401 RSC.
- C. L. Schmidt and M. Jansen, J. Mater. Chem., 2010, 20, 4183–4192 RSC.
- H. Wang, X. D. Zhang, J. F. Xie, J. J. Zhang, P. A. Ma, B. C. Pan and Y. Xie, Nanoscale, 2015, 7, 5152–5156 RSC.
- Y. W. Yuan, L. L. Zhang, J. Xing, M. I. B. Utama, X. Lu, K. Z. Du, Y. M. Li, X. Hu, S. J. Wang, A. Genc, R. Dunin-Borkowski, J. Arbiol and Q. H. Xiong, Nanoscale, 2015, 7, 12343–12350 RSC.
- B. B. Wang, Q. J. Cheng, Y. A. Chen and K. Ostrikov, J. Appl. Phys., 2011, 110, 6 Search PubMed.
- Y. H. Zhang, Q. W. Pan, G. Q. Chai, M. R. Liang, G. P. Dong, Q. Y. Zhang and J. R. Qiu, Sci. Rep., 2013, 3, 8 Search PubMed.
- H. H. Qiu, Z. J. Wang and X. L. Sheng, Phys. B, 2013, 421, 46–49 CrossRef CAS.
| This journal is © The Royal Society of Chemistry 2019 |


