 Open Access Article
Reed-derived fluorescent carbon dots as highly selective probes for detecting Fe3+ and excellent cell-imaging agents
Guili Wei,
Ziqiang Zhao,
Jie Du,
Pan Li,
Zhuxing Sun,
Li Huo * and
Yongjun Gao
 *
*
Key Laboratory of Medicinal Chemistry and Molecular Diagnosis of Ministry of Education, College of Chemistry and Environmental Science, Hebei University, Baoding, 071002, Hebei, China. E-mail: huolichenchen@sina.com; yjgao@hbu.edu.cn
First published on 12th July 2019
Abstract
A kind of highly selective and sensitive fluorescent probe for detecting Fe3+, carbon dots (CDs), was prepared with renewable reed naturally containing C, N, O, and S elements as a green and eco-friendly carbon source by a simple hydrothermal process. The fluorescence of CDs without purification and surface modification can be quenched by Fe3+ in a wide concentration range of 0 to 362 μmol L−1 (concentration of Fe3+), with detection limits as low as 0.014 μmol L−1 in 0–50 μmol L−1. Characterizations, such as TEM, XPS, Raman and FTIR, confirmed that the static quenching mechanism involved the generation of non-luminescent complexes between Fe3+ and functional groups (carboxyl group, sulfur-oxyl group and hydroxyl group) on the surface of CDs and with the aggregation of CDs. More importantly, CDs had good biocompatibility and nontoxicity according to an MTT cell-viability assay, and cells labeled with CDs emitted blue, green and red color fluorescence. Thus, the static quenching mechanism was confirmed. So, this reed-derived natural CD solution can be utilized in detecting Fe3+, culture cells, and cell imaging.
1. Introduction
Iron ion (Fe3+) is an important metal ion in natural environment, and it plays important roles in oxygen uptake and oxygen metabolism.1 The balance of the iron content in biological systems is a critical issue. The deficiency or excess of iron elements in body can cause serious illness, such as anemia, Parkinson's disease, heart failure and hemochromatosis.2,3 Therefore, it is significant to develop a practical, sensitive and efficient strategy to monitor the content of iron ions in biological systems. Hitherto, a lot of analytical methods have been used to detect Fe3+, such as atomic spectrometry, colorimetric analysis, electrochemical methods and fluorescent spectrophotometry.4–7 Among these technologies, use of fluorescent probes is a rapid and simple method.8 At present, fluorescent carbon dots (CDs) are prepared by various chemical syntheses and widely studied as fluorescent probes for the detection of Fe3+ due to their high selectivity and low limit of detection,9–11 but their synthesis is complex and some CDs are toxic. Many studies report the use of CDs derived from nature biomass, such as soy flour,12 pomelo,13 watermelon peel,14 carnation,15 orange juice,16 grass,17 pigeon feathers,18 rice residue,19 rose flower,20 and bamboo leaf cellulose,21 for the detection of Fe3+ due to their eco-friendly and renewable nature.12–23 However, most of these CDs require prior purification, passivation and functional modifications to improve their performance in detecting Fe3+, which inhibits their practical application. Therefore, it is necessary to develop a simple method to prepare functionalized CDs that possess excellent detection capability for iron ions. In addition, there are some fluorescence quenching mechanisms between Fe3+ and CDs, such as forming a non-luminescent complex or transferring electrons between Fe3+ and various functional groups on the surface of CDs,1–3 or the inner filter effect of metal ions,11 mentioned in the literature with logical reasoning. It is urgent to demystify the quenching mechanism according to experimental characterizations. For example, Xu et al. prepared S-doped C-dots for the first time by a simple hydrothermal method.23 The S-doped C-dots exhibited a unique emission behavior and could selectively detect Fe3+. It also revealed the quenching mechanism that the surface electron density of sulfur atoms tends to create coordination with Fe3+. Li et al. prepared S-GQDs by the electrolysis of graphite in sodium p-toluenesulfonate.24 The S-GQDs exhibited a sensitive response to Fe3+. The sulfur promoted the local density of electrons in S-GQDs and the coordination between Fe3+ and –OH groups on the surface of S-GQDs, which led to fluorescence quenching. Therefore, S element can enhance the fluorescence intensity of carbon spots and the sensitivity of detecting Fe3+.22–25Reed, a kind of rhizomatous perennial graminoid plant of wetlands, can survive extremely harsh conditions, such as saline land and polluted water. Moreover, the elemental composition of reed is abundant because it can absorb some elements in water. In general, reed grown up in wetland mainly contains four kinds of elements, namely C, H, O and S elements. This property makes reed a potential candidate for naturally sulfur-functionalized CDs. In this study, sulfur-functionalized CDs were prepared using reed as a raw material by a hydrothermal process. The CDs can be applied as fluorescent probes to specifically detect Fe3+ with a low limit of detection via fluorescence quenching. Ethylenediaminetetraacetic acid (EDTA) can restore the fluorescence intensity of quenched CDs, so that an “off–on” strategy can be set up, which further illustrates that the quenching mechanism is the generation of complexes between iron ions with functional groups on the surface of CDs. More importantly, the CDs exhibit excellent biocompatibility and can be used in cell imaging. A schematic of the synthesis of the reed-derived CDs and fluorescent “off–on” featured intracellular imaging is shown in Scheme 1.
2. Experimental
2.1. Materials
Dry reed was collected from Baiyangdian (China) and powdered (100 mesh) or cut into small pieces. MCF-7 cells were supplied by Peking Union Medical College Hospital China. Dimethyl sulfoxide (DMSO) was purchased from Sigma-Aldrich. FBS medium and MTT [3-(4,5-dimethylthiazol-2-yl)-2,5-diphenyltetrazolium bromide] (Vazyme) were purchased from Hyclone Co.2.2. Synthesis of CDs
The reed powder (10 g) and deionized water (120 mL) were mixed and introduced into a Teflon-lined stainless steel autoclave. After sealing, the autoclave was heated to 180 °C in an oven for 3 h. The precipitate was removed via centrifugation at 10![[thin space (1/6-em)]](https://www.rsc.org/images/entities/char_2009.gif) 000 rpm for 5 min. The CD solution was finally dried under vacuum at 50 °C for 48 h, and then dispersed in deionized water at a concentration of 2 μg mL−1 for further use and characterizations.
000 rpm for 5 min. The CD solution was finally dried under vacuum at 50 °C for 48 h, and then dispersed in deionized water at a concentration of 2 μg mL−1 for further use and characterizations.
2.3. Metal ion detection
Metal ion aqueous solutions (50 μM) containing K+, Ca2+, Mg2+, Zn2+, Fe3+, Pb2+, Ba2+, Bi3+, Cd2+, Co2+, Cu2+, Hg2+, Mn2+, and Ni2+ were prepared, respectively. Then, 1 mL of CD solution (2 μg mL−1) and 1 mL of the solution containing various ions (50 μM) were added into a centrifuge tube. After reaction at room temperature for 5 min, the fluorescence emission spectra were recorded under consistent conditions. At the same time, the sensitivity of the system for detecting Fe3+ (0–362 μM) was studied. The “off–on” experiment was performed by first adding Fe3+ ions (off) and then adding EDTA (on) (1.5 mg EDTA). The detection of Fe3+ was performed at room temperature at a fluorescence excitation wavelength of 330 nm for all the FL (fluorescence spectra) spectra.2.4. Cytotoxicity evaluation and cell imaging
The cytotoxicity of CDs for MCF-7 cells was evaluated using an MTT cell-viability assay. The CD solutions with different concentrations (1, 10, 50, 100, and 200 μg mL−1) were added to the cells for 24 h, 48 h and 72 h cultivation. The absorbance of MTT at 490 nm was monitored using an automatic enzyme standard instrument (ELX-800, ELISA Reader), and cell viability was expressed by the absorbed ratio of the cells incubated with the CD solution. 100% viability was determined using untreated cells.The biological imaging research of the reed-derived CDs was performed on MCF-7 cells. The cells were incubated with 200 μL CDs, CDs + Fe3+ and CDs + Fe3+ + EDTA (the concentration of CDs was 500 μg mL−1, Fe3+ was 12.5 mM, and EDTA was 0.38 g) in a humidified chamber at 37 °C for 24 h and 72 h. Fluorescent staining cells were observed upon excitation with 405 nm, 488 nm, 568 nm laser.
3. Results and discussion
3.1. Optical properties
The optical properties of the reed-derived CDs were studied by the UV-vis and fluorescence spectra. A broad UV absorption at 278 nm is detected, which can be mainly assigned to the n–π transition (Fig. 1a).1,12 Under the UV excitation of 365 nm, the CDs showed bright blue fluorescence that is visible even with naked eyes (Fig. 1a, inset, bottom). However, it remains transparent and yellowish in the daylight (Fig. 1a, inset, top). It indicates that some functional groups on the surface of CDs affect the blue emission. As the excitation wavelengths varied from 300 nm to 370 nm, the intensity of emission peaks decreased, and the maximum emission peaks shifted to longer wavelengths (red shift) (Fig. 1b).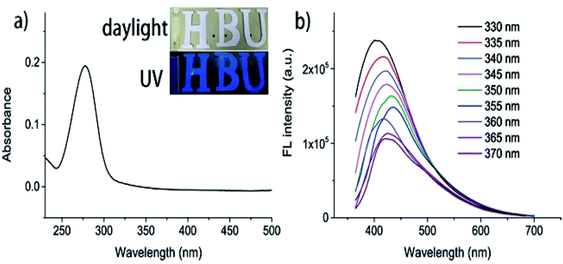 | ||
| Fig. 1 (a) UV-vis absorption of CDs (inset: the optical images under daylight (top) and UV light (bottom)). (b) FL spectra of CDs at different excitation wavelengths (from 330 nm to 370 nm). | ||
A series of experiments was performed to evaluate the chemical stability of the CDs. The fluorescence intensities of the CDs hardly changed with the increase in the illumination time (up to 160 min) and the concentration of NaCl (Fig. 2a and b), suggesting the good stability of the CDs. However, the CDs showed different fluorescence intensities in different solvents (Fig. 2c), indicating that the CDs possess different energy gaps in different solvents.
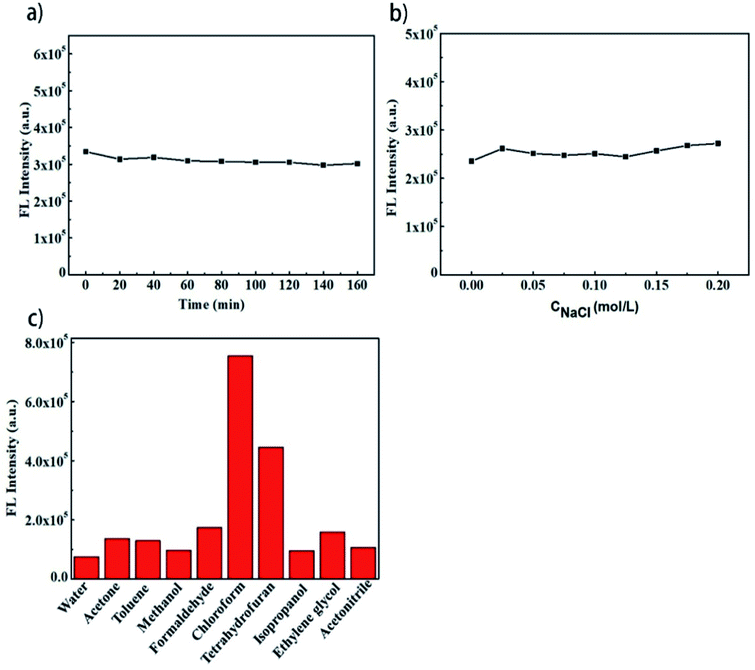 | ||
| Fig. 2 (a) FL stability in different UV irradiation durations; (b) FL stability in different concentrations of NaCl; and (c) FL intensity in different solvents. | ||
3.2. Fluorescence detection for Fe3+
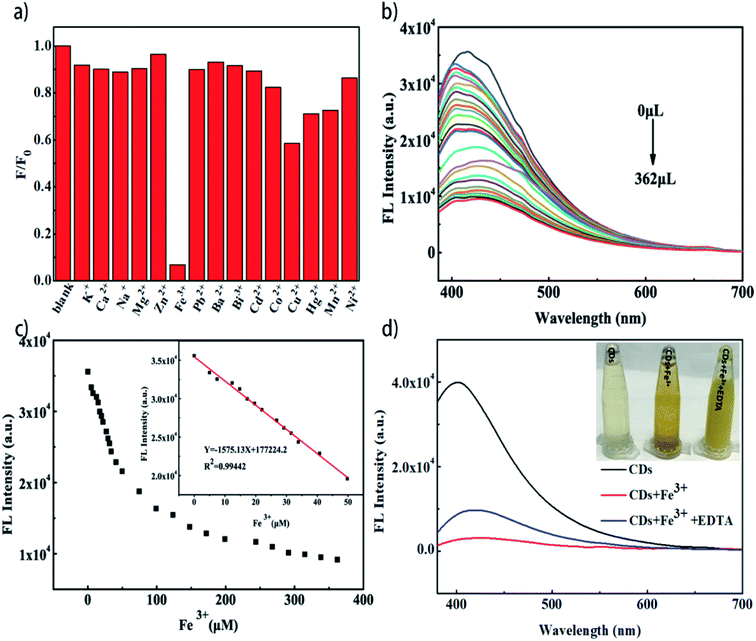
High selectivity to specific ion plays an important role in establishing a detection method based on the sensing properties of CDs. The changes in the fluorescence intensity with the addition of metal ions at an excitation wavelength of 330 nm are shown in Fig. 3a. Compared with other ions, the Fe3+ exhibited obvious fluorescence quenching effect, suggesting that the CDs have specific selectivity to Fe3+ (Fig. 3a). The fluorescence intensity at 330 nm decreased along with the increase in the Fe3+ concentration in the range of 0–362 μM, revealing that the sensing system is sensitive to Fe3+ concentration (Fig. 3b). A good linear relationship (correlation coefficient R2 of 0.99442) (Fig. 3c) between the fluorescence intensity and the concentration of Fe3+ in the range of 0–50 μM can be fitted out. The LOD value of 0.014 μM was calculated for this system according to formula LOD = 3δ/K, where δ is the standard deviation of signals and K is the slope of standard curve. Compared with other biomass-derived CDs in literatures, the reed-derived CDs present a wider linear region and lower limit of detection (Table 1). The excellent sensitivity and linear range show the promising applications for detecting Fe3+ in biomedical and environmental systems. As shown in Fig. 3d, once Fe3+ was introduced into the solution of CDs, floccus generated and fluorescence property lost. However, when a stronger chelator, such as EDTA, for Fe3+ was introduced, the floccus disappeared and the fluorescence property was partially restored.3.3. Mechanism of the fluorescence quenching
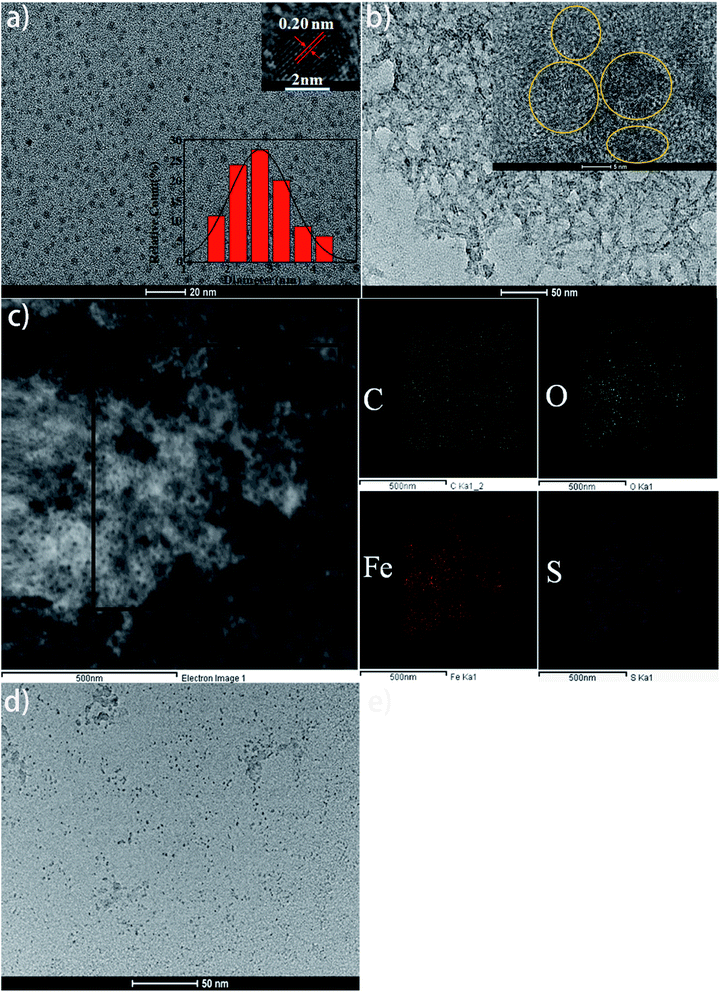
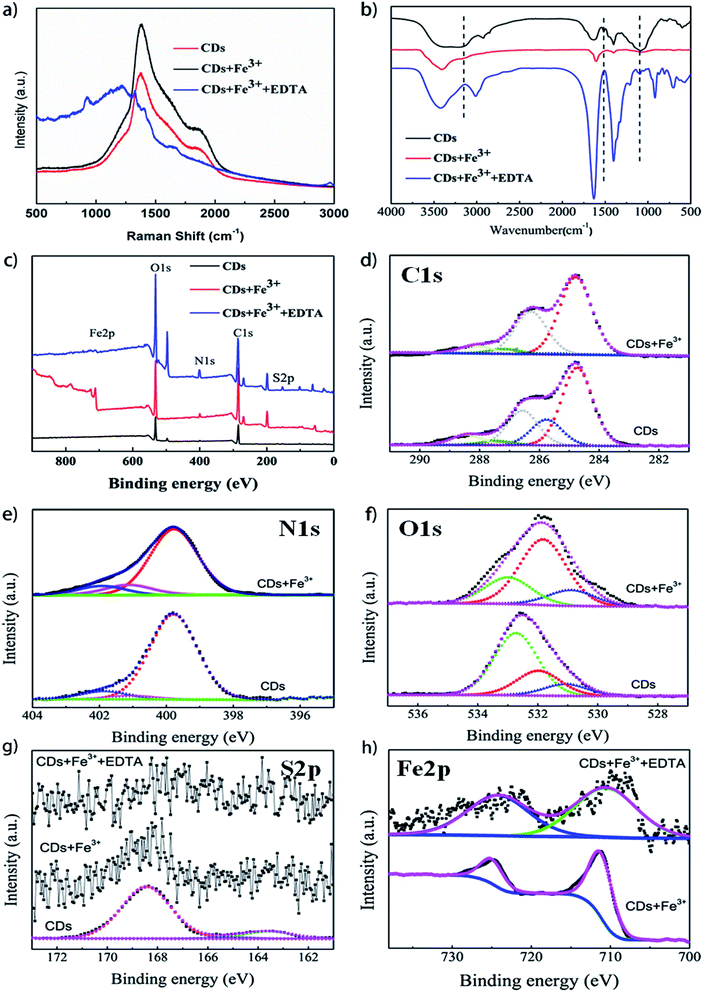
The TEM and HRTEM images (Fig. 4a) show that the reed-derived CDs are spherical with an average diameter of 2.7 nm. The CDs were well distributed, possibly due to the hydrophilic group on the surface. The HRTEM image pointed out that the CDs possessed high crystallinity and the lattice spacing was 0.20 nm (inset in Fig. 4a), corresponding to the (002) facets.12,16 The morphology of floccus that resulted from the introduction of Fe3+ is presented in Fig. 4b. It was clearly observed that the CDs gathered (Fig. 4b, inset), which resulted from the coordination between Fe3+ and various functional groups on the surface of CDs. Elemental mapping analysis demonstrates that the floc complex is composed of C, O, Fe and S elements (Fig. 4c). After EDTA was introduced into the floc system, the floccus disappeared and well-distributed CDs can be observed again (Fig. 4d).The Raman spectrum of the CDs displayed D band, locating at 1350 cm−1, which was attributed to sp3 bonded carbon atoms, and it also has a little G band peak in Fig. 5a. The slightly higher D band peak may be due to the presence of excess of oxygen- and sulfur-containing groups on the surface of the CDs.9,12 The existence of these functional groups increased the structural disorder and defects of CDs, so that the strong fluorescent effect was induced. There was another peak at around 1820 cm−1, attributing to single or fewer layers of graphene or graphite.31 When Fe3+ ions were introduced, the Raman scattering enhanced but the position of the peak remained.32 The intensity of D band decreased, and G band at 1580 cm−1 appeared when EDTA was introduced to restore the fluorescence property of CDs.8 These results indicated that the addition of Fe3+ ions cannot effect the position of the Raman spectrum, and that the introduction of EDTA partially restores the surface structure of CDs.
The changes in functional groups on the surface of CDs, CDs + Fe3+, and CDs + Fe3+ + EDTA were also investigated using FT-IR. The peaks situating at about 3400 and 3200 cm−1 in the FT-IR spectra of CDs, as shown in Fig. 5b, can be ascribed to the stretching vibrations of N–H and O–H. The peaks at about 2920 and 2850 cm−1 are assigned to the stretching vibrations of –CH2 groups. The bending vibrations of the CO–NH and C![[double bond, length as m-dash]](https://www.rsc.org/images/entities/char_e001.gif) C groups locate at about 1635 and 1527 cm−1, and the characteristic peaks at 1712, 1401, 1200 and 1077 cm−1 are assigned to C
C groups locate at about 1635 and 1527 cm−1, and the characteristic peaks at 1712, 1401, 1200 and 1077 cm−1 are assigned to C![[double bond, length as m-dash]](https://www.rsc.org/images/entities/char_e001.gif) O, C–OH/C–N, C–O–C and –SO3H groups, respectively.22,23 The above observations confirm that the CDs have the hydrophilic groups on the surface, which renders the CDs good water solubility. It is found that the peaks representing O–H and C–O/–SO3H groups disappeared in the FT-IR spectra of CDs + Fe3+ and can be recovered after adding EDTA, which indicates that the functional groups on the surface of CDs reacted with Fe3+, resulting in the fluorescence quenching of CDs. If Fe3+ ions were depredated by EDTA, the most functional groups became freedom again and were detected by FTIR. In addition, the surface composition and elemental analysis for the CDs, CDs + Fe3+ and CDs + Fe3+ + EDTA were investigated by the XPS analysis (Fig. 5c–h). The C1s spectra (Fig. 5d) show five deconvoluted peaks at 284.57, 285.6, 286.4, 287.3, and 288.26 eV, which are attributed to the C–H/C
O, C–OH/C–N, C–O–C and –SO3H groups, respectively.22,23 The above observations confirm that the CDs have the hydrophilic groups on the surface, which renders the CDs good water solubility. It is found that the peaks representing O–H and C–O/–SO3H groups disappeared in the FT-IR spectra of CDs + Fe3+ and can be recovered after adding EDTA, which indicates that the functional groups on the surface of CDs reacted with Fe3+, resulting in the fluorescence quenching of CDs. If Fe3+ ions were depredated by EDTA, the most functional groups became freedom again and were detected by FTIR. In addition, the surface composition and elemental analysis for the CDs, CDs + Fe3+ and CDs + Fe3+ + EDTA were investigated by the XPS analysis (Fig. 5c–h). The C1s spectra (Fig. 5d) show five deconvoluted peaks at 284.57, 285.6, 286.4, 287.3, and 288.26 eV, which are attributed to the C–H/C![[double bond, length as m-dash]](https://www.rsc.org/images/entities/char_e001.gif) C, C–O, C–O–C, C
C, C–O, C–O–C, C![[double bond, length as m-dash]](https://www.rsc.org/images/entities/char_e001.gif) O and O–C
O and O–C![[double bond, length as m-dash]](https://www.rsc.org/images/entities/char_e001.gif) O groups, respectively.27,32 In the N1s spectra (Fig. 5e), the three peaks at 399.7, 400.7 and 401.5 eV attributed to the C
O groups, respectively.27,32 In the N1s spectra (Fig. 5e), the three peaks at 399.7, 400.7 and 401.5 eV attributed to the C![[double bond, length as m-dash]](https://www.rsc.org/images/entities/char_e001.gif) N, C–N and N–H groups can be fitted, respectively.22,27 In the high-resolution O1s spectra (Fig. 5f), the three peaks at 530.5, 531.4 and 532.6 eV could be assigned to the HO–C
N, C–N and N–H groups can be fitted, respectively.22,27 In the high-resolution O1s spectra (Fig. 5f), the three peaks at 530.5, 531.4 and 532.6 eV could be assigned to the HO–C![[double bond, length as m-dash]](https://www.rsc.org/images/entities/char_e001.gif) O, C
O, C![[double bond, length as m-dash]](https://www.rsc.org/images/entities/char_e001.gif) O and C–OH groups.22,27 The S2p spectra show three peaks at 163.5, 165.1 and 168.4 eV, pointing to the S2p1/2 C–S, S2p3/2 C–S and C–SOx(2,3,4).32,33 It illustrates that the sulfur atom is not only doped in the form of thiophene into the CDs but also in the form of sulfonic groups. In the XPS spectra of CDs + Fe3+, the hydroxyl group, carboxyl group and the sulfur-oxyl group are obviously disappeared (C1s 285.6 eV, C–O) or weakened (O1s 532.6 eV, C–OH), which corresponds to the results of FT-IR analysis. O1s plays important roles and N1s spectra slightly change upon addition of Fe3+. However, according to the S2p spectra, the sulfur groups on the surface of CDs were not restored (Fig. 5g), which may have resulted from the comparable coordination capability of Fe3+ with sulfur-containing groups and EDTA. In addition, the valence (III) states of iron elements in CDs + Fe3+ and CDs + Fe3+ + EDTA were the same according to the analysis of XPS Fe2p spectra (Fig. 5h). Therefore, it can be concluded that the fluorescence quenching mechanism involves the formation of non-luminescent complexes between Fe3+ and functional groups (carboxyl group, hydroxyl group and sulfur-oxyl group) on the surface of CDs, promoting CD aggregation except the electron transfer. The sulfur-oxyl groups were important functional groups effecting the selectivity for detecting Fe3+.23,24
O and C–OH groups.22,27 The S2p spectra show three peaks at 163.5, 165.1 and 168.4 eV, pointing to the S2p1/2 C–S, S2p3/2 C–S and C–SOx(2,3,4).32,33 It illustrates that the sulfur atom is not only doped in the form of thiophene into the CDs but also in the form of sulfonic groups. In the XPS spectra of CDs + Fe3+, the hydroxyl group, carboxyl group and the sulfur-oxyl group are obviously disappeared (C1s 285.6 eV, C–O) or weakened (O1s 532.6 eV, C–OH), which corresponds to the results of FT-IR analysis. O1s plays important roles and N1s spectra slightly change upon addition of Fe3+. However, according to the S2p spectra, the sulfur groups on the surface of CDs were not restored (Fig. 5g), which may have resulted from the comparable coordination capability of Fe3+ with sulfur-containing groups and EDTA. In addition, the valence (III) states of iron elements in CDs + Fe3+ and CDs + Fe3+ + EDTA were the same according to the analysis of XPS Fe2p spectra (Fig. 5h). Therefore, it can be concluded that the fluorescence quenching mechanism involves the formation of non-luminescent complexes between Fe3+ and functional groups (carboxyl group, hydroxyl group and sulfur-oxyl group) on the surface of CDs, promoting CD aggregation except the electron transfer. The sulfur-oxyl groups were important functional groups effecting the selectivity for detecting Fe3+.23,24
3.4. Cytotoxicity evaluation and cell imaging for CDs
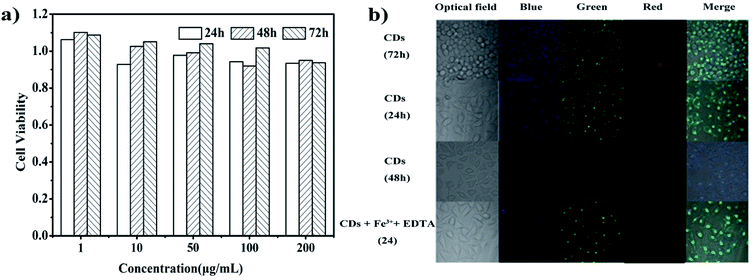
The cytotoxicity of CDs was investigated by an MTT assay. The viability of MCF-7 cells to CDs after 24 h, 48 h and 72 h of cultivation can be seen in Fig. 6a. When the concentration of CDs varied between 1 and 200 μg mL−1, the MCF-7 cell viability was higher than 93% after 24 h, 48 h and 72 h of incubation. These results indicate that the reed-derived CDs have no obvious cytotoxicity against MCF-7 cells, and hence, these CDs have good biocompatibility.To explore the feasibility of the CDs in fluorescent cell imaging, MCF-7 cells were incubated with CDs, CDs + Fe3+ and CDs + Fe3+ + EDTA at a concentration of 500 μg mL−1 for 24 h and 72 h. The cells can be labeled according to the emission of blue, green and red color fluorescence at different excitation wavelengths of 405 nm, 488 nm and 568 nm, respectively (Fig. 6b). The strong fluorescence within the intracellular regions of the MCF-7 cells demonstrates that CDs enter into the zones of nuclei or migrate into the cell membrane via endocytosis. However, the existence of Fe3+ made the intracellular fluorescence weaker due to the fluorescence quenching ability of Fe3+. After EDTA was introduced into the system, the cells show gradual intracellular fluorescence, which is a good way of showing “off–on” performance. Meanwhile, before and after the introduction of CDs, the morphology of the MCF-7 cells had no change, suggesting that the CDs have good biocompatibility. All these preludes illustrate that the CDs are safe and nontoxic in in vivo applications and the CDs can be applied in culture cells for effectively detecting Fe3+ and even the biomarker medium.
4. Conclusions
In conclusion, reed-derived CDs with high stability, high fluorescence intensity, good solubility and biocompatibility were synthesized by a one-step hydrothermal method. The CDs naturally containing C, N, O, and S with an average size of 2.7 nm were applied as fluorescent probes to detect Fe3+ ions with special selectivity and high sensitivity, and S elements could improve the fluorescence performance of CDs and the sensitivity towards detecting Fe3+. A series of characterizations determined that the fluorescence quenching mechanism involved the formation of non-luminescent complexes between Fe3+ and functional groups (–OH, –C–O, –S–O) on the surface of CDs. The reed-derived CDs had no cytotoxicity, so that the cells could be labeled with CDs and emitted blue, green and red color fluorescence at different excitation wavelengths of 405, 488 and 568 nm. All these results illustrate that the reed-derived CDs can be used to detect Fe3+ in culture cells and cell imaging.Conflicts of interest
The authors declare no competing financial interest.Acknowledgements
We thank the following funders for financial support: Higher Education Science and Technology Research Project of Hebei Province, China (No. ZD2019022); National Natural Science Foundation of China (No. 21773053); National Science and Technology Major Projects (No. 2018ZX0711000404).References
- C. P. Han, R. Wang, K. Y. Wang, H. T. Xu, M. R. Sui, J. J. Li and K. Xu, Biosens. Bioelectron., 2016, 83, 229–236 CrossRef CAS.
- N. Wang, H. J. Chai, X. L. Dong, Q. Zhou and L. H. Zhu, Food Chem., 2018, 258, 51–58 CrossRef CAS.
- N. Wang, Y. T. Wang, T. T. Guo, T. Yang, M. L. Chen and J. H. Wang, Biosens. Bioelectron., 2016, 85, 68–75 CrossRef CAS.
- Z. Yan, L. Hu and J. You, Anal. Methods, 2016, 8(29), 5738–5754 RSC.
- X. Hu, D. Pan, M. Lin, H. Han and F. Li, Microchim. Acta, 2015, 183(2), 855–861 CrossRef.
- V. Singh and A. K. Mishra, Sens. Actuators, B, 2016, 227, 467–474 CrossRef CAS.
- Z. Qu, P. Li, X. Zhang and K. Han, J. Mater. Chem. B, 2016, 4(5), 887–892 RSC.
- M. Shamsipur, K. Molaei, F. Molaabasi, M. Alipour, N. Alizadeh, S. Hosseinkhani and M. Hosseini, Talanta, 2018, 183, 122–130 CrossRef CAS PubMed.
- Y. L. Zhang, L. Wang, H. C. Zhang, Y. Liu, H. Y. Wang, Z. H. Kang and S. T. Lee, RSC Adv., 2013, 3, 3733–3738 RSC.
- M. Amjadi, T. Hallaj, H. Asadollahi, Z. Song, M. de Frutos and N. Hildebrandt, Sens. Actuators, B, 2017, 244, 425–432 CrossRef CAS.
- M. Zheng, Z. G. Xie, D. Qu, D. Li, P. Du, X. B. Jing and Z. C. Sun, ACS Appl. Mater. Interfaces, 2013, 5, 13242–13247 CrossRef CAS.
- Y. F. Li, Q. Xu, X. Zheng, W. N. Zhang, J. T. Zheng, M. B. Wu and W. T. Wu, J. Nanopart. Res., 2016, 18, 224–237 CrossRef.
- W. B. Lu, X. Y. Qin, S. Liu, G. H. Chang, Y. W. Zhang, Y. L. Luo, A. M. Asiri, A. O. Al-Youbi and X. P. Sun, Anal. Chem., 2012, 84, 5351–5357 CrossRef CAS.
- J. J. Zhou, Z. H. Sheng, H. Y. Han, M. Q. Zou and C. X. Li, Mater. Lett., 2012, 66, 222–224 CrossRef CAS.
- D. Zhong, H. Miao, K. C. Yang and X. M. Yang, Mater. Lett., 2016, 166, 89–92 CrossRef CAS.
- S. Sahu, B. Behera, T. K. Maiti and S. Mohapatra, Chem. Commun., 2012, 48, 8835–8837 RSC.
- S. Liu, J. Q. Tian, L. Wang, Y. W. Zhang, X. Y. Qin, Y. L. Luo, A. M. Asiri, A. O. Al-Youbi and X. P. Sun, Adv. Mater., 2012, 24, 2037–2041 CrossRef CAS.
- Q. Ye, F. Yan, Y. Luo, Y. Wang, X. Zhou and L. Chen, Spectrochim. Acta, Part A, 2017, 173, 854–862 CrossRef CAS.
- H. Qi, M. Teng, M. Liu, S. Liu, J. Li, H. Yu and Z. Guo, J. Colloid Interface Sci., 2018, 97, 31487–314895 Search PubMed.
- V. Sharma, S. K. Singh and S. M. Mobin, Nanoscale Adv., 2019, 1, 1290–1296 RSC.
- M. Z. Fahmi, A. Haris, A. J. Permana, D. L. Nor Wibowo, B. Purwanto, Y. L. Nikmah and A. Idris, RSC Adv., 2018, 8(67), 38376–38383 RSC.
- Z. Wei, B. Wang, Y. Liu, Z. Liu, H. Zhang, S. Zhang and S. Lu, New J. Chem., 2019, 43, 718–723 RSC.
- Q. Xu, P. Pu, J. Zhao, C. Dong, C. Gao, Y. Chen and H. Zhou, J. Mater. Chem. A, 2015, 3(2), 542–546 RSC.
- S. Li, Y. Li, J. Cao, J. Zhu, L. Fan and X. Li, Anal. Chem., 2014, 86(20), 10201–10207 CrossRef CAS.
- K. Qu, J. Wang, J. Ren and X. Qu, Chem.–Eur. J., 2013, 19(22), 7243–7249 CrossRef CAS.
- M. Picard, S. Thakur, M. Misra and A. K. Mohanty, RSC Adv., 2019, 9(15), 8628–8637 RSC.
- J. Shi, G. Ni, J. Tu, X. Jin and J. Peng, J. Nanopart. Res., 2017, 19(6), 2–10 Search PubMed.
- S. A. A. Vandarkuzhali, V. Jeyalakshmi, G. Sivaraman, S. Singaravadivel, K. R. Krishnamurthy and B. Viswanathan, Sens. Actuators, B, 2017, 252, 894–900 CrossRef CAS.
- V. Raveendran, A. R. Suresh Babu and N. K. Renuka, RSC Adv., 2019, 9(21), 12070–12077 RSC.
- R. Vikneswaran, S. Ramesh and R. Yahya, Mater. Lett., 2014, 136, 179–182 CrossRef CAS.
- R. Rao, R. Podila, R. Tsuchikawa, J. Katoch, D. Tishler, A. M. Rao and M. Ishigami, ACS Nano, 2011, 5(3), 1594–1599 CrossRef CAS.
- S. N. Chen, X. Li, Y. Y. Zhao, L. M. Chang and J. Y. Qi, Carbon, 2015, 81, 767–772 CrossRef CAS.
- R. Z. Zhang and W. Chen, Biosens. Bioelectron., 2014, 55, 83–90 CrossRef CAS PubMed.
| This journal is © The Royal Society of Chemistry 2019 |


