 Open Access Article
Investigation of synergistic effects between silica nanoparticles, biosurfactant and salinity in simultaneous flooding for enhanced oil recovery
Rasoul Khademolhosseini a,
Arezou Jafari*a,
Seyyed Mohammad Mousavi*b and
Mehrdad Manteghiana
aFaculty of Chemical Engineering, Tarbiat Modares University, Tehran, Iran. E-mail: ajafari@modares.ac.ir; Fax: +98-21-82884931; Tel: +98-21-82884982
bBiotechnology Group, Chemical Engineering Department, Tarbiat Modares University, Tehran, Iran. E-mail: mousavi_m@modares.ac.ir; Fax: +98-21-82884931; Tel: +98-21-82884917
First published on 28th June 2019
Abstract
The purpose of this study was to investigate the effect of process parameters including silica nanoparticle (NP) concentration, biosurfactant (BS) concentration, and salinity as well as their synergistic effects on oil recovery in simultaneous flooding. Additionally, the effect of NP morphology (in the BS-NP solution) on oil recovery was investigated in this research. Micromodel flooding tests were designed with a central composite design (CCD) and carried out using BS and spherical silica NPs. The results showed that there is a positive synergistic effect between BS and silica NPs to shift the wettability to the water-wet condition and decrease interfacial tension (IFT), resulting in improved oil recovery. Indeed, the maximum oil recovery was obtained at an optimum salt concentration. Several micromodel tests were then carried out with BS and different-shaped NPs at the optimum point predicted by a mathematical model to study the effect of NP morphology on oil recovery. The results showed that minimum IFT of 1.85 mN m−1 and the most reduction in the glass contact angle of 92.8% could be achieved by the BS-spherical NP solution as compared to those of the BS-non spherical NP solutions, which led to the highest oil recovery of 53.4%. The better performance of spherical NPs was attributed to the higher uniformity, which resulted in better distribution and more effective interactions with crude oil components. The results of core flooding tests showed that the BS-spherical NP solution yielded 26.1% final oil recovery after brine flooding. In addition, the BS-NP solution was more effective in wettability alteration of an oil-wet carbonate rock compared with the BS solution. It was deduced that the main mechanisms involved in oil recovery improvement were wettability alteration to the water-wet state, IFT reduction, and mobility ratio improvement.
1. Introduction
The traditional methods of oil recovery from oil reservoirs have been categorized as primary and secondary methods. Primary oil recovery is the first stage of oil production, in which the reservoir pressure is the driving force of the natural rise of crude oil. Water flooding is generally applied in the secondary recovery stage to displace the trapped oil in the rock towards production. However, these stages are not efficient enough to produce a considerable amount of oil due to high capillary forces, which result in low oil recovery.1–3 The methods to further increase the sweep efficiency and enhance oil recovery comprise tertiary recovery or enhanced oil recovery (EOR). Nowadays, applying new methods such as biotechnology and nanotechnology in EOR has aroused much attention. Numerous studies have been dedicated to the application of biosurfactants in EOR and the investigation of their ability in IFT reduction and wettability alteration, which are favorable in EOR.4–7 Biosurfactant (BS) molecules diffuse from the bulk aqueous phase to the interface of the crude oil-aqueous phase due to the concentration gradient and then adsorb at the surface. Generally, diffusion is much slower than adsorption, thus controlling the whole process.8 The hydrophilic head and hydrophobic tail of biosurfactants interact with water molecules and crude oil, respectively. This forms a bridge between two phases and lowers IFT. IFT reduction decreases capillary forces in the pores and throats of porous media, which are the main reason for oil trapping, and improving oil recovery.9,10 Khademolhosseini et al.11 synthesized a rhamnolipid BS from newly found Pseudomonas aeruginosa HAK01 that showed excellent ability in IFT reduction and wettability alteration of the glass surface from the oil-wet state to the water-wet state. It also showed high stability under severe conditions of temperature, pH, and salinity, which is necessary to achieve good effectiveness in microbial enhanced oil recovery (MEOR). Indeed, the results obtained from micromodel tests confirmed that the produced BS is a good candidate in this field. Saxena et al.12 produced anionic BS from palm oil and studied its ability to alter the wettability of quartz and carbonate surfaces. The produced BS changed the wettability of both surfaces from the oil-wet state to the water-wet state.Furthermore, surfactants and biosurfactants have other applications in other industrial fields due to their high surface activity. For example, they have been introduced in biofiltration systems to lower the surface tension; thus, the solubility of volatile organic compounds (VOCs) increases and consequently, higher removal efficiency of these compounds is achieved.9,13 There are studies on the application of biosurfactants (such as saponins and rhamnolipids) and nonionic chemical surfactants (such as Tween 20 and Triton X-100) for the removal of styrene, ethylbenzene, and n-hexane from the waste gas in biofilters.9,13–15
Nowadays, nanotechnology has attracted much attention for applications in EOR to produce more oil from reservoirs. Numerous studies confirm that NPs can alter the wettability characteristics of rocks to more water-wet conditions,16–18 reduce IFT,19,20 and function effectively in oil recovery.21,22 According to Ragab and Hannora,23 silica NPs improve oil recovery due to reduction in IFT and increase in the viscosity of the injected solution.
Different studies show that NPs along with surfactants can improve oil recovery by synergistic effects compared with pure surfactant flooding.24–27 Zargartalebi et al.28 showed that the application of hydrophilic silica NPs along with sodium dodecyl sulfate (SDS) reduced IFT and enhanced oil recovery from sandstone rocks. The results achieved were consistent with those reported by Ahmadi and Shadizadeh.29 Nwidee et al.30 showed that the mixture of NPs and surfactants altered the wettability of the system to the water-wet state. Mingwei et al.31 used silica NPs and TX-100 (a non-ionic surfactant) to evaluate their synergistic effects on oil recovery. The results showed that silica NPs mixed with this surfactant were more capable of wettability alteration compared to a pure surfactant solution.
Despite considerable efforts in the application of surfactants, biosurfactants, NPs, and surfactants along with NPs in oil recovery, no attention has been paid to the simultaneous flooding of biosurfactants and NPs in this field. To fill this gap, simultaneous flooding of NPs and anionic BS was performed in this research and the effects of process variables (NP concentration, BS concentration, and salinity) on oil recovery and their interactions, which have not been evaluated yet, were thoroughly investigated. Flooding tests were designed with a central composite design (CCD) and were conducted in a micromodel. A rhamnolipid-type BS and spherical silica NPs were applied in the designed tests. The process was then optimized to achieve maximum oil recovery and the confirmation test was conducted. Then, several micromodel tests and contact angle measurements were carried out at optimum point to evaluate the effect of NP morphology (in BS-NP solution) on oil recovery for the first time. Subsequently, core flooding tests were conducted using two BS-NP solutions, which led to the highest oil recovery in the micromodel tests at the optimum point. Indeed, the viscosity values of the injected fluids and IFT between crude oil and the injected solutions were measured for the mechanistic investigation of oil recovery. Furthermore, the wettability state of the glass surface and carbonate rock was investigated for this reason.
2. Materials and methods
2.1 Materials
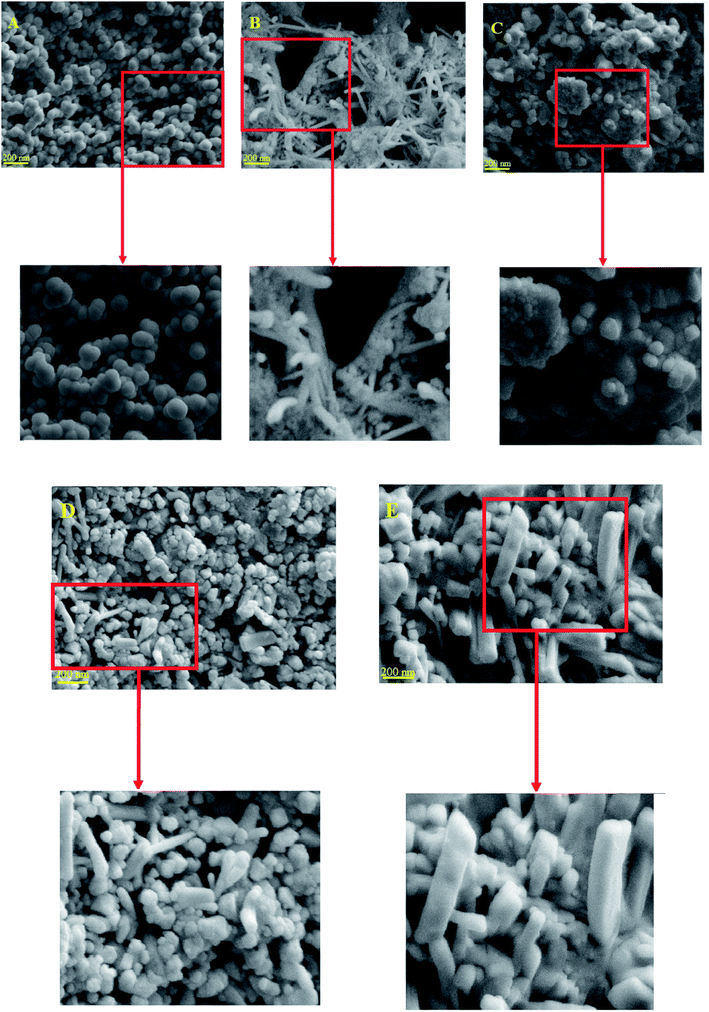
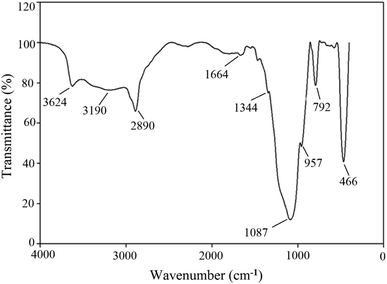
Anionic rhamnolipid BS (CMC of 120 ppm), produced from Pseudomonas aeruginosa HAK01,11 and hydrophilic silica NPs were applied in this research (Fig. 1). NPs were synthesized by neutralizing potassium silicate with hydrochloric acid in the presence of polyethylene glycol (PEG 4000). The SEM images of the produced NPs are given in Fig. 1, and the FTIR spectrum of spherical NPs (Fig. 1A) is given in Fig. 2. Sodium chloride (99.5% purity, Tetra-Chem) was used to obtain the required salinity in solutions. The crude oil sample used in this investigation was obtained from the North Azadegan oil field in Iran (specific gravity of 0.937, TAN of 0.46 mg KOH/mg oil, asphaltene content of 10.12 wt% and viscosity of 242 cP at 25 °C). Methanol (99.8%), sodium hydroxide (99%), trichloromethyl silane (99%), and toluene (99.9%), supplied by Merck Chemical Co., were used to make the micromodel oil-wet. Distilled water, methanol, and toluene were applied for cleaning the micromodel and core sample.2.2 Solution preparation
BS and sodium chloride were added to distilled water and stirred using a magnetic stirrer until they totally dissolved. Silica NPs were then added to the solution and stirred for 30 min at the rate of 400 rpm for initial dispersion. Finally, the solution was sonicated for at least 1 h in an ultrasonic bath (400 watt, 20 kHz).2.3 EOR application
Two core flooding tests were carried out to evaluate the effect of BS-NP solutions on oil recovery from a carbonate core sample. For this purpose, a carbonate core sample 3.74 cm in diameter and 6.2 cm in length was used in this research. The permeability and porosity of the used core sample were 1.45 mD and 14.1, respectively. Initially, the core sample was washed with toluene and methanol, oven-dried, placed in a core flood, and subjected to reduced pressure for six hours using a vacuum pump. Subsequently, brine (3 wt% NaCl) was injected to establish initial water saturation. The crude oil was then injected until reaching irreducible water saturation (Swi). Then, it was immersed in the crude oil and placed in the oven at 80 °C for 15 days to change the wettability to the oil-wet state.
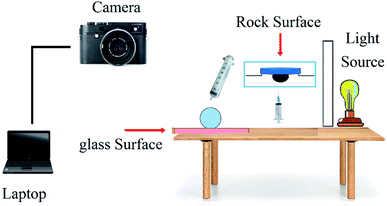
After aging, the brine solution (3 wt% sodium chloride) was injected, followed by the injection of BS-NP solution to study oil recovery from the carbonate rock. The values of oil production were recorded vs. time and finally, oil recovery was plotted vs. pore volumes of the injected solution. The setup used for the core flooding test is illustrated in Fig. 3b.
The sessile drop method is the most common method to study the wettability state of a carbonate rock sample,27 and it was also applied in this research. For this purpose, pellets were taken apart from rock, washed with methanol, and aged with crude oil in an oven (80 °C) for two weeks in order to alter the wettability to oil-wet state. Afterwards, the oil-wet pellets were placed in solutions for a week to change the wettability to more water-wet state. Then, the flat surface of the pellet was placed horizontally in the solution, and a drop of oil was placed onto the pellet bottom. The contact angles were measured by imaging the droplets attached to the pellet (Fig. 4). Measurements were recorded for three different points on the pellet to obtain more accurate results and the average values were reported. Three solutions were considered for this test. Two of these solutions were in the optimum point condition of the micromodel tests but with NPs having different morphologies, which were applied in core tests. The other solution was in the optimum point condition too but without NPs to investigate the role of a pure BS solution in wettability alteration.
2.4 Tests
The viscosity of the injected solution affects the mobility ratio and therefore has an important role in the oil recovery process. In this work, a Brookfield viscometer (NDJ-4; China) was used to measure the viscosities of solutions at ambient temperature. The IFT values between crude oil and aqueous solutions were measured with a Pendant drop method using a VIT-ES30 apparatus (Fars EOR Technology Company). The zeta potential measurement of the solutions was performed using ZETA-check, Particle Metrix (Germany) to evaluate the surface charge of BS and NPs. To have more reliable results, each experiment was carried out in triplicate, and the average values were reported.2.5 Designed experiments
The central composite design method (CCD) is widely used as a statistical approach to analyze the effect of process variables on the response of the system including oil recovery efficiency in flooding experiments.11,35,36 In this research, the micromodel flooding tests were designed to evaluate the interactions of operating variables and their effects on the final oil recovery. To do this, the CCD method was applied using the Design Expert software version 7.0. Three factors (NP concentration, BS concentration, and salinity) were considered as the main variables (Table 1). In order to maximize the oil recovery, process variables were optimized using mathematical and statistical tools and then, the confirmation test was performed.| Factor | Code | Unit | Level | ||||
|---|---|---|---|---|---|---|---|
| −α = −2 | −1 | 0 | 1 | +α = 2 | |||
| NP concentration | A | (ppm) | 0 | 25 | 50 | 75 | 100 |
| BS concentration | B | (ppm) | 0 | 40 | 80 | 120 | 160 |
| Salinity | C | (wt%) | 0 | 0.5 | 1 | 1.5 | 2 |
3. Results and discussion
3.1 Characterization of NPs
Fig. 1 demonstrates the SEM images of NPs with different morphologies. Fig. 2 shows the FTIR spectrum of the produced spherical NPs. The peak at 466 cm−1 corresponds to the bending vibration of siloxane (Si–O–Si). The absorption peaks at 792 and 1087 cm−1 indicate the Si–O–Si symmetric and asymmetric stretching vibrations, respectively. The absorption peak at around 957 cm−1 is related to Si–OH asymmetric stretching. The band at 1664 cm−1 is due to the bending vibration of the water molecules adsorbed on the surface of silica NPs. The broad peak observed at 3624 cm−1 is attributed to the Si–OH stretching vibration and the O–H stretching vibration of the water molecules adsorbed on the surface of silica by hydrogen bonding. These results indicate the presence of a silica network in the synthesized NPs.The absorption peaks at 2890 cm−1 and 3190 cm−1 are associated with the symmetric and asymmetric stretching vibrations of alkyl groups, respectively. The absorption peak at 1344 cm−1 is due to the deforming vibration of alkyl groups. These three peaks confirm that PEG has been grafted onto the surface of silica NPs.37,38
3.2 Designed micromodel flooding tests
Table 2 shows the tests conducted under different conditions. Final oil recovery, breakthrough time (BT), and the viscosity values of injected fluids are also presented in this table.| Test no. | Factors | Response | ||||
|---|---|---|---|---|---|---|
| NP concentration (ppm) | BS concentration (ppm) | Salinity (wt%) | Final oil recovery (%) | BT (min) | Viscosity (cP) | |
| 1 | 50 | 80 | 0 | 43 | 166 | 4.0 |
| 2 | 75 | 40 | 0.5 | 40 | 53 | 3.9 |
| 3 | 75 | 120 | 1.5 | 49.5 | 193 | 4.2 |
| 4 | 100 | 80 | 1 | 50 | 212 | 4.3 |
| 5 | 75 | 40 | 1.5 | 42 | 150 | 4.0 |
| 6 | 25 | 40 | 0.5 | 26.5 | 132 | 3.5 |
| 7 | 50 | 80 | 2 | 45.5 | 169 | 4.1 |
| 8 | 50 | 160 | 1 | 50 | 211 | 4.2 |
| 9 | 0 | 80 | 1 | 42 | 158 | 3.5 |
| 10 | 50 | 80 | 1 | 48.5 | 206 | 4.0 |
| 11 | 50 | 80 | 1 | 50 | 215 | 4.0 |
| 12 | 50 | 0 | 1 | 28 | 119 | 3.9 |
| 13 | 25 | 120 | 1.5 | 43.5 | 156 | 4.0 |
| 14 | 75 | 120 | 0.5 | 49.5 | 198 | 4.1 |
| 15 | 25 | 40 | 1.5 | 32 | 135 | 3.7 |
| 16 | 50 | 80 | 1 | 48 | 209 | 4.0 |
| 17 | 50 | 80 | 1 | 46.5 | 171 | 4.0 |
| 18 | 25 | 120 | 0.5 | 42 | 158 | 3.8 |
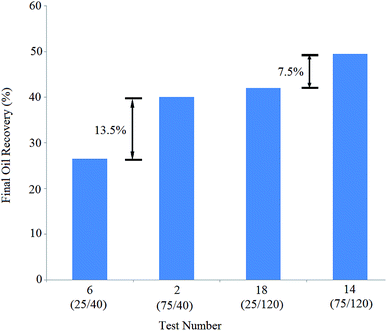
The solutions of tests 14 and 18 exhibited equal BS concentration of 120 ppm. The concentration of NPs in the solution of test 14 (75 ppm) was three times greater than that of the solution of test 18 (25 ppm), leading to 7.5% more oil recovery: oil recovery increased from 42% (test 18) to 49.5% (test 14). The obtained results show that NPs have a positive effect on oil recovery, especially at lower BS concentrations.
Similarly, the BS concentration in solutions 18 and 14 (120 ppm) was three times greater than that of solutions 6 and 2 (40 ppm), yielding 9.5% and 15.5% more recoveries, respectively: the oil recovery was enhanced from 40% (test 2) to 49.5% (test 14) and improved from 26.5% (test 6) to 42% (test 18).
The comparison of pair tests (6,18) and (2,14) shows that increasing the BS concentration strongly affects oil recovery, which is more effective at lower NP concentrations.
At lower NP concentrations, the interface was not saturated with NPs and therefore, BS molecules could easily diffuse into the interface and decrease the IFT value between the crude oil and aqueous phase. When the NP concentration increased, NPs accumulated at the interface more; as a result, it was more difficult for BS molecules to diffuse into the interface. Therefore, fewer BS molecules were adsorbed at the interface and they were less effective at higher NP concentrations. A closer look at the final oil recovery differences (13.5%, 7.5%, 15.5%, and 9.5%) indicated that the increase in BS concentration was more effective than that in NP concentration.
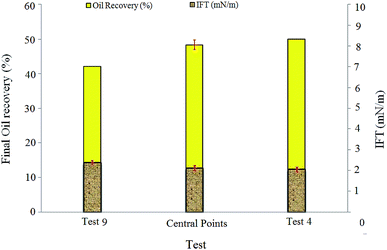
More IFT reduction was observed by increasing the NP concentrations of the central point solutions (50 ppm) and test 4 (100 ppm). NPs can change the IFT value of the surfactant/oil systems due to absorption at the interface. The zeta potentials of BS solution (120 ppm) and spherical silica particles (100 ppm) were measured as −51 mV and −33 mV, respectively, indicating a negative surface charge for both BS molecules and silica NPs. As the NP concentration increased, the repulsive electrostatic forces between NPs and BS molecules promoted the NPs penetration from the bulk of the solution to the water–oil interface. Consequently, the interface became more saturated with NPs and IFT between the injected fluid and residual oil decreased.
The capillary number is defined as a dimensionless number that relates the viscous forces in a system to the capillary forces:
 | (1) |
Higher values of this number indicate that viscous forces are more dominant and the capillary forces, which favor oil trapping, are less effective. IFT reduction lowers the capillary forces in the pores and throats and therefore increases the capillary number.11 In this case, the injected fluid can penetrate into more pores and throats and release the trapped oil, which will lead to oil recovery improvement. The capillary numbers for tests 9, central points, and 4 were 7.82 × 10⁻⁴, 1.01 × 10⁻³, and 1.1 × 10⁻³, respectively. The ratio of the capillary number of test 4 to the capillary number of test 9 was almost 1.41, which indicated 41% enhancement. After a closer look at the obtained results, it was concluded that the addition of silica NPs has a positive effect on oil recovery by IFT reduction and increasing the capillary number. The BS-NP solution lowered the IFT value between crude oil and aqueous phase, which led to the reduction of the capillary forces in pores and throats. Therefore, the dimensionless capillary number increased and the trapped oil mobilized, which in turn increased the final oil recovery.
The viscosity values of the injected fluids in test 4, central points, and test 9 (Table 2) were 4.3, 4, and 3.5 times greater than water viscosity (1 cP), respectively. These values show that the displacing fluid viscosity increases as the NP concentration increases. This is due to the formation of three-dimensional and complex networks of silica particles. Moreover, increase in the viscosity of the displacing fluid decreases the viscosity difference between the oil and injected fluid, improving the mobility ratio and delaying BT, which can promote oil recovery from porous media. The final oil recovery and BT of test 9 were 42% and 158 min, respectively, while the corresponding values for test 4 were 50 and 212 min; this indicates the positive effect of viscosity enhancement on oil recovery.
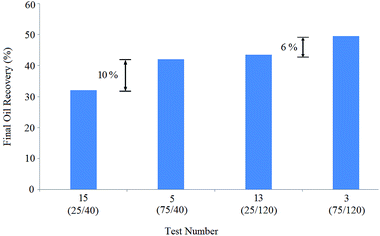
Indeed, the BS concentrations of the solutions of tests 3 and 13 were equal (120 ppm), but the NP concentration in solution 3 (75 ppm) was thrice that of solution 13 (25 ppm), resulting in 6% oil recovery enhancement: oil recovery increased from 43.5% (test 13) to 49.5% (test 3).
Considering the obtained results, NPs were efficient in oil recovery enhancement and were more effective at lower BS concentrations. Indeed, the BS concentrations in solutions 3 and 13 were thrice that of solutions 5 and 15, yielding 7.5% and 11.5% more recoveries, respectively: oil recovery increased from 42% (test 5) to 49.5% (test 3) and enhanced from 32% (test 15) to 43.5% (test 13).
Similarly, the comparison of the pair tests (3,5) and (13,15) shows that increasing the BS concentration positively affects oil recovery, especially at lower NP concentrations. A closer look at the final oil recovery differences (10%, 6%, 7.5%, and 11.5%) shows that the BS concentration enhancement was more effective than NP concentration increase for oil recovery.
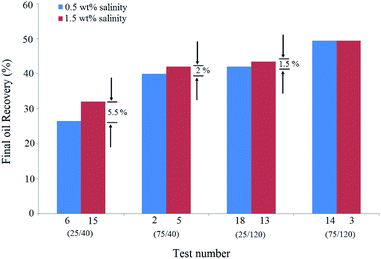
This means that BS concentration has an effective role in higher salinities. In other words, the increase in salinity was more effective at lower BS concentrations. At low BS concentrations, at which the accumulation and adsorption of BS molecules at the interface are not considerable, sodium cations can diffuse and adsorb at the interface easily and lower the electrostatic repulsion between BS and NPs with a negative surface charge. On increasing the BS concentration in the solution, fewer sodium cations can diffuse and adsorb at the interface. As a result, the salinity increase is less effective at higher BS concentrations.
Similarly, the comparison of the pair tests of (6,15) and (18,13) shows that increasing the salinity from 0.5 wt% to 1.5 wt% reduces the positive role of BS concentration. Indeed, oil recovery differences of the pair test of (2,5) were 3.5% less than that of the (6,15) pair test. The NP concentration tripled in these pair tests. It can be concluded that the impact of salinity enhancement is more noticeable at lower NP concentrations. In other words, the increase in salinity reduces the positive effect of NPs on recovery.
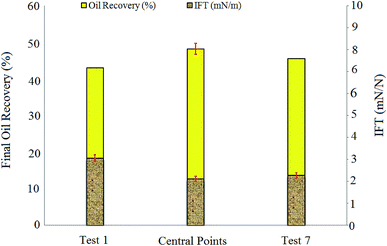
IFT measurements showed that increasing salinity up to 1 wt% led to IFT reduction from 3.06 mN m−1 (test 1) to 2.12 mN m−1 (central point tests), but further increase in salinity caused slight increase in IFT (2.27 mN m−1 for test 7).
The capillary numbers for test 1, central points, and test 7 were 6.98 × 10⁻⁴, 1.01 × 10⁻³, and 9.64 × 10⁻⁴, respectively. The ratio of the capillary number in central points to the capillary number in test 1 was almost 1.44. It is obvious that central point experiments with the highest oil recovery compared to tests 1 and 7 resulted in the highest capillary number too.
Initially, the crude oil-aqueous phase interface was negatively charged due to the presence of NPs and anionic BS. After the addition of sodium chloride, some positively charged sodium ions were attracted towards the interface and were placed between BS and NPs. This decreased the electrostatic repulsive forces between negatively charged BS and NPs; also, the electrostatic attraction between the positively charged sodium ions and negatively charged BS and NPs increased. As a result, the effective charge of the interface layer was reduced. Consequently, NPs and BS molecules accumulated easier and were more closely packed at the oil-aqueous phase interface.12,39 In other words, the electrostatic effect of the salt changed the distribution of NPs and BS at the interface and led to better interactions between the crude oil-BS hydrophobic chain and the water-hydrophilic head group of BS.
Indeed, the presence of the salt in the aqueous solution increased the movement of BS and NPs from the bulk into the interface. Other sodium ions remained in the bulk of the solution and compressed the electrical double layers around NPs and BS molecules. This increased the electrostatic repulsion between NPs and BS surfaces and promoted their movement to the interface. The salting-out effect of NPs and biosurfactants is another reason for IFT reduction. Salt ions attract some water molecules, which can lower their availability to interact with the BS molecules and NPs in the bulk solution. This accelerates the movement of BS molecules and NPs from the bulk to the interface.12
All the above reasons were involved in IFT reduction with increasing salinity. This trend was true until optimum salinity was reached, after which IFT decreased to its minimum value. Beyond this point, a very high sodium ion content prevented the accumulation of NPs and BS molecules at the interface due to hindrance effects. This increased IFT of the solution. Therefore, there was an optimum concentration for salinity to achieve minimum IFT and afford the greatest performance. This is in agreement with the results reported by other researchers.40,41
3.3 Statistical modeling
The results of ANOVA are summarized in Table 3. The relatively high R2 (0.9016) value indicates that the given model correlates well with the experimental values. The p-value (0.0035) implied that the model is significant at a 95% probability level. The best model was a modified quadratic polynomial to state the relationships between oil recovery, as the response, and the selected parameters.| Oil recovery (%) = −1.37083 + 0.42058A + 0.49411B + 17.27917C − 1.31250AB − 0.05500AC − 0.034375BC − 1.29333A2 − 1.59896B2 − 4.98333C2 | (2) |
| Source | Sum of squares | DOF | Mean square | F-value | p-value |
|---|---|---|---|---|---|
| Model | 843.91 | 9 | 93.77 | 8.15 | 0.0035 |
| A – NP conc. (ppm) | 172.27 | 1 | 172.27 | 14.96 | 0.0048 |
| B – BS conc. (ppm) | 489.52 | 1 | 489.52 | 42.52 | 0.0002 |
| C – salinity (wt%) | 13.14 | 1 | 13.14 | 1.14 | 0.3165 |
| AB | 13.78 | 1 | 13.78 | 1.20 | 0.3057 |
| AC | 3.78 | 1 | 3.78 | 0.33 | 0.5823 |
| BC | 3.78 | 1 | 3.78 | 0.33 | 0.5823 |
| A2 | 14.26 | 1 | 14.26 | 1.24 | 0.2981 |
| B2 | 142.80 | 1 | 142.80 | 12.40 | 0.0078 |
| C2 | 33.86 | 1 | 33.86 | 2.94 | 0.1247 |
| R2 | 0.9016 |
Fig. 10a shows the interaction effect of NP concentration on oil recovery at BS concentrations of 40 and 120 ppm and constant salinity of 1.0 wt%.
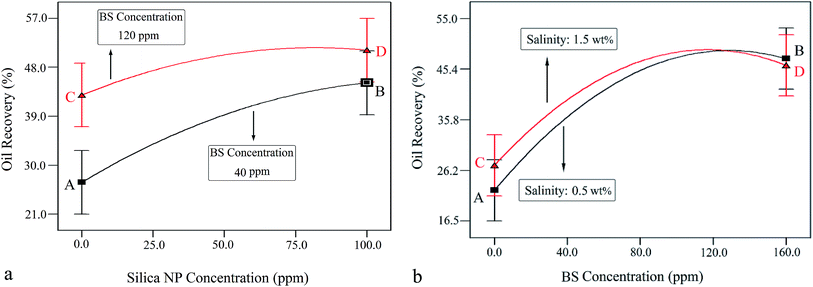 | ||
| Fig. 10 (a) Interaction of NP and BS concentrations at constant salinity (1 wt%). (b) Interaction of BS concentration and salinity at a constant NP concentration (50 ppm). | ||
As observed, the oil recovery increased from 26.7% to 45.1% with increasing NP concentration from zero (point A) to 100 ppm (point B), respectively, indicating 18.4% oil recovery enhancement. Indeed, more oil recovery was achieved at a higher BS concentration (120 ppm). In this case, the oil recovery was enhanced from 43.1% to 51% with increasing NP concentration from zero (point C) to 100 ppm (point D), respectively, indicating 7.9% increase in oil recovery. This behavior indicates that the effect of NP concentration on oil recovery is greater at lower BS concentrations. It is worth noting that oil recovery enhances more steeply at the BS concentration of 40 ppm, which confirms the obtained result. This trend was in agreement with the results obtained in Section 3.1.1, where an increase in NP concentration from 25 ppm to 75 ppm at BS concentrations of 40 ppm and 120 ppm led to 13.5% and 7.5% enhancements in oil recovery, respectively.
Fig. 10b shows the interaction effect of the rhamnolipid concentration on oil recovery at two salinity values of 0.5 and 1.5 wt% and a constant NP concentration of 50 ppm. The crossed curves state that the effect of salinity on oil recovery is dependent on the level of BS concentration and vice versa. Indeed, the sharp slopes indicate that the interaction of these two factors is significant. In other words, the addition of the salt has a synergistic effect on the oil recovery from porous media. According to this figure, as the salinity increases, the oil recovery enhances to a maximum value and then decreases. At 0.5 wt% salinity, with increasing BS concentration, the oil recovery enhances from 22.4% (point A) to its maximum value (48.1%) at the BS concentration of 125 ppm and then declines to 47.3% (point B, BS concentration of 160 ppm). A similar trend was observed at 1.5 wt% salinity: the oil recovery increased from 27.1% (point C) to the highest value of 48.6% at the BS concentration of 115 ppm and then declined gradually; the plotted graph crosses the other at 125 ppm, 48.1%. Then, the oil recovery decreased further to 46.4% (point D, BS concentration of 160 ppm). It is concluded from this figure that the increasing salinity has a positive effect on oil recovery at BS concentrations less than 125 ppm but beyond this concentration, it adversely affects the process.
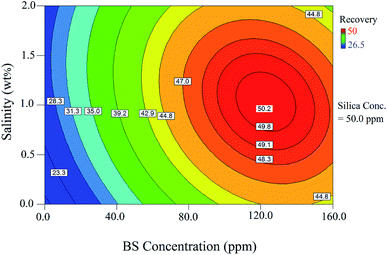
The relationship between the BS concentration and salinity is shown by the 2D contour in Fig. 11. As illustrated in this figure, there is an optimum value for salinity to achieve the maximum oil recovery; this figure is consistent with Fig. 10b. This behavior was also observed as the BS concentration increased: The oil recovery increased with increasing BS concentration. After the optimum concentration, the oil recovery showed a declining trend when the BS concentration was further increased. Oil recovery reduction after an optimum BS concentration was due to micelle formation, which reduced the concentration of the BS molecules at the interface and decreased their ability to reduce the IFT value. The optimal conditions to reach maximum oil recovery were determined at the NP concentration of 97.5 ppm, BS concentration of 110.8 ppm, and salinity of 1.17 wt%. Under the optimal conditions, the predicted oil recovery value was 51.2% and the corresponding oil recovery was 53.4% (confirmation test). Therefore, the value predicted by the model was very close to the experimental value, indicating good accuracy of the model to optimize the process.
3.4 The effect of NP morphology (in simultaneous flooding of BS-NPs) on oil recovery
| NP morphology | Test 1 | Test 2 | Test 3 | Test 4 | Test 5 |
|---|---|---|---|---|---|
| Spherical | Sponge-like | Mixture of spherical, rod-like and irregular NPs | One-dimensional nanowires and irregular NPs | Rod-like (tetragonal cross section) | |
| Breakthrough time (% PV) | 79 | 76 | 63 | 59 | 57 |
| Breakthrough time (min) | 211 | 201 | 166 | 156 | 151 |
| Final oil recovery (%) | 53.4 | 47 | 45.6 | 44.5 | 40 |
| IFT (mN m−1) | 1.85 | 1.94 | 2.11 | 2.23 | 2.31 |
| Capillary number × 104 | 12.7 | 11.8 | 11.1 | 11.0 | 10.8 |
| Initial contact angle (°) | 112 | 113 | 117 | 118 | 120 |
| Final contact angle (°) | 8 | 12 | 15 | 16 | 17 |
| Contact angle change (%) | 92.8 | 89.3 | 87.2 | 86.4 | 85.8 |
| Viscosity (cp) | 4.4 | 4.3 | 4.4 | 4.6 | 4.7 |
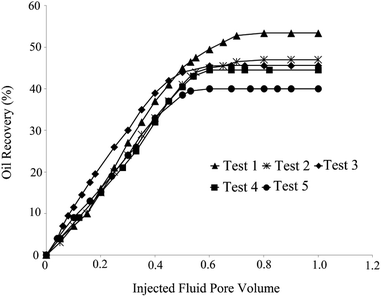
Tests 5 and 4 yielded the minimum oil recoveries of 40% and 44.5%, respectively. One-dimensional nanowires along with irregular-shaped NPs (aspect ratio of 8) were present in the solution of test 4 (Fig. 1B). Rod-like NPs with tetragonal cross-sections (aspect ratio of 6) were present in test 5 (Fig. 1E). Low oil recovery in these tests was related to the log-jamming mechanism. NPs, which are smaller than pore throats, accumulated and blocked the rock throats. Moreover, the constant differential pressure and narrowing fluid cross area enhanced the fluid velocity at the pore throats. Water molecules moved faster than silica NPs. Consequently, the accumulation of NPs and pores occurred, and oil recovery decreased.20 This is more likely to happen for non-uniform particles with a high aspect ratio compared with spherical particles with high uniformity. The results are shown in Table 4.
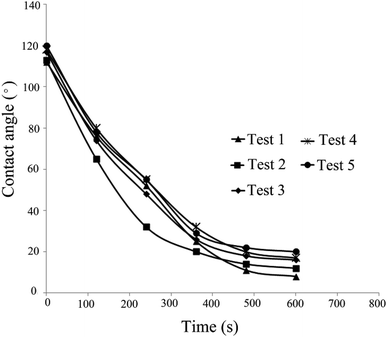
As can be observed, spherical NPs have a greater effect on wettability than non-spherical NPs. The solution of test 1 (Table 4), which reduced the contact angle from 112° to 8°, exhibited the greatest impact on contact angle (92.8% reduction). However, the solution of test 5, which changed the contact angle from 120° to 17° with 85.8% reduction, showed the least effect on the contact angle.
NPs create a wedge-film structure at the contact region of three phases (oil, fluid, and solid). This film spreads along the solid surface and separates the oil from the solid surface. This mechanism is called the structural disjoining pressure.20 When the weight fraction of NPs in the fluid increases, more NPs are located inside the wedge film, leading to a higher disjoining pressure and mobilization of more trapped oil. Additionally, sodium cations present in the injected fluid interact with the anionic acidic components of the crude oil adsorbed on the solid surface, which improves the wettability alteration (ion-binding mechanism).43 Indeed, the hydrophobic interactions of the anionic BS molecules with the anionic components of crude oil have a great effect on wettability alteration. All the above factors have synergistic effects on detaching the oil layer from the solid surface and changing the wettability to the water-wet state.
Spherical NPs were more effective in IFT reduction. The higher uniformity of spherical NPs compared to that of other synthesized NPs led to better and more effective dispersion in the base fluid, resulting in more IFT reduction, better wettability alteration, and as a result, more oil recovery. Achieving wettability alteration to more water-wet state along with other mechanisms including IFT reduction and good mobility ratio is essential for the successful oil recovery process.
3.5 Core flooding tests
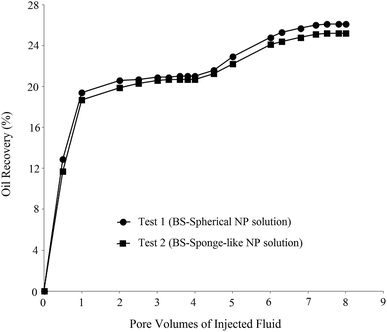
In order to investigate the effect of the BS-NP solution on oil recovery from the oil-wet carbonate core, two core-flood tests were carried out. BS-NP solutions with spherical and sponge-like particles, which resulted in the highest oil recovery in the micromodel tests (Table 4), were applied in the core flood tests as tests 1 and 2, respectively. Fig. 14 demonstrates the profile of oil recovery versus pore volumes of the injected fluid for four pore volumes of brine injection and four pore volumes of the BS-NP solution injection. It can be observed from this figure that both solutions have a positive impact on oil recovery after brine flooding. As shown in the figure, the increase in oil recovery is almost constant (∼21%) after two pore volumes of brine flooding, but the total oil recoveries increase to 26.1% and 25.1% after the injections of BS-NPs with spherical NPs and sponge-like NPs, respectively. Indeed, the oil recovery is almost constant after three pore volumes of injected BS-NP solution. The results obtained confirmed that BS-NP fluids enhanced the oil recovery from the carbonate rock. In brine flooding, the displacing fluid prefers to pass through large throats and pores with less resistance. Mobility ratio improvement, IFT reduction, and wettability alteration are the parameters that lead to more oil recovery compared to brine flooding. BS-NP solutions with higher viscosity improved the mobility ratio and decreased the amount of oil bypassed by the displacing fluid.They also lowered the IFT value and dominated the capillary forces in the pore scale. As a result, the fluid passed through smaller pores with higher resistance and changed the wall wettability to more water-wet states, which increased the oil recovery from porous media. Similar to that observed in the micromodel tests (Table 4), the solution with spherical NPs was more effective for oil recovery compared to the solution with sponge-like particles.
3.6 Rock wettability alteration
The contact angles of pellet surfaces were measured to evaluate the effect of BS-NP solutions on rock wettability alteration. BS-spherical NP and BS-sponge-like NP solutions, used in core flooding, were applied in these experiments as tests 1 and 2, respectively. The NP concentration in the third solution was considered zero (test 3) to investigate the effect of BS solution (110.8 ppm) without NPs on wettability alteration. The measured initial contact angle between the crude oil droplet and the surface of the carbonate sample was 26°, indicating a strong oil-wet state.Fig. 15a and b show that the average contact angles of oil on the solid surface are about 114° and 106° for tests 1 and 2, respectively, indicating intermediate water-wet conditions. In these tests, NPs and BS were mainly responsible for wettability alteration from oil-wet to water-wet state. In test 3, the average contact angle obtained was 99.5° (Fig. 15c). In this case, the produced BS was mainly responsible for wettability alteration of the rock sample to more water-wet states. The hydrophobic interactions between the tails of anionic BS and adsorbed anionic organic components from oil on the rock surface caused the wettability alteration of the core sample to more water-wet states.
The comparison of Fig. 15a and b with Fig. 15c indicates that silica NPs can alter the wettability of the rock surface to a more water-wet state. The wedge-shaped film structure created by NPs changes the wettability and detaches the oil layer from the surface by the structural disjoining pressure. Indeed, spherical NPs (test 1) are more capable of changing wettability as compared to the sponge-like NPs in test 2. As previously indicated, high uniformity of spherical particles led to better dispersion in solution and stronger interaction with the adsorbed components on the rock surface, which resulted in more efficient wettability alteration.
A glance at the results obtained from the wettability alteration of glass and carbonate surfaces showed that the BS-NP solutions could change the wettability of both glass and carbonate surfaces from oil-wet to water-wet conditions. It is worth mentioning that a strongly water-wet state was achieved for the glass surface, especially for BS-spherical and BS-sponge-like NP solutions; the droplets were almost totally spread out on the surface. However, an intermediate water-wet condition was established for carbonate surfaces. This is due to the nature of solid surfaces: carbonate rock surfaces reflect the real conditions of oil reservoirs much better; the results obtained were more realistic than those obtained from the glass surfaces.
4. Conclusion
In this study, simultaneous flooding of a rhamnolipid (anionic BS) and synthesized silica NPs was investigated. Micromodel flooding tests were designed using RSM and carried out using BS-spherical NPs. The effect of variables (NP concentration, BS concentration, and salinity) on oil recovery and their interactions were thoroughly investigated. It was shown that the maximum oil recovery was achieved at an optimum salt concentration. Indeed, NPs exhibited a positive effect on oil recovery, especially at lower BS concentrations. Furthermore, salinity increase was more effective at lower BS concentrations. The results showed that NPs along with biosurfactants resulted in enhancing oil recovery as well as the release of more amounts of trapped oil inside throats and pores due to IFT reduction, wettability alteration of the porous medium, and an increase in the viscosities of the injected fluids as the main mechanisms involved in oil recovery. IFT reduction lowered capillary forces; the BS molecules and NPs could diffuse easily into the pores and throats, altering the wettability. Adding NPs and BS to water resulted in viscosity increase by 3–4 times, which led to a better mobility ratio. To study the effect of NP morphology (in BS-NP solutions) on oil recovery, several tests were conducted with BS and NPs (having different morphologies) at the optimum point predicted by the mathematical model. The results showed that BS-spherical NPs exhibited a better performance than BS-non-spherical NPs in terms of improving oil recovery (53.4%). The minimum IFT value, 1.85 mN m−1, and the highest change in the glass contact angle, 92.8%, were achieved by the BS-spherical NP solution. This means that spherical NPs have a greater effect on oil recovery than non-spherical NPs. The high uniformity of spherical NPs, which resulted in better distribution and more effective interactions with crude oil components, was considered as the main reason for this observation. Indeed, the BS-spherical NP solution yielded 26.1% oil recovery after brine flooding in the core flooding test, which was higher than that of the BS-sponge-like NP solution (25.1%). Finally, better wettability alteration of the oil-wet carbonate rock was achieved with BS-NP solutions compared to that with the BS solution (without NPs).Conflicts of interest
The authors have no conflicts of interest to declare.References
- P. Purswani and Z. T. Karpyn, Laboratory investigation of chemical mechanisms driving oil recovery from oil-wet carbonate rocks, Fuel, 2019, 235, 406–415 CrossRef CAS.
- F. Moeini, A. Hemmati-Sarapardeh, M. H. Ghazanfari, M. Masihi and S. Ayatollahi, Toward mechanistic understanding of heavy crude oil/brine interfacial tension: The roles of salinity, temperature and pressure, Fluid Phase Equilib., 2014, 375, 191–200 CrossRef CAS.
- A. Moslemizadeh, A. Shirmardi Dezaki and S. R. Shadizadeh, Mechanistic understanding of chemical flooding in swelling porous media using a bio-based nonionic surfactant, J. Mol. Liq., 2017, 229, 76–88 CrossRef CAS.
- S. J. Geetha, I. M. Banat and S. J. Joshi, Biosurfactants: Production and potential applications in microbial enhanced oil recovery (MEOR), Biocatal. Agric. Biotechnol., 2018, 14, 23–32 CrossRef.
- G. Changhong, Experiences of microbial enhanced oil recovery in Chinese oil fields, J. Pet. Sci. Eng., 2018, 166, 55–62 CrossRef.
- Y. Al-Wahaibi, S. Joshi, S. Al-Bahry, A. Elshafie, A. Al-Bemania and B. Shibulalb, Biosurfactant production by Bacillus subtilis B30 and its application in enhancing oil recovery, Colloids Surf., B, 2014, 114, 324–333 CrossRef CAS PubMed.
- S. Seo, M. Mastiani, B. Mosavati, D. Peters, P. Mandin and M. Kim, Performance evaluation of environmentally benign nonionic biosurfactant for enhanced oil recovery, Fuel, 2018, 234, 48–55 CrossRef CAS.
- P. Kanokkarn, T. Shiina, M. Santikunaporn and S. Chavadej, Equilibrium and dynamic surface tension in relation to diffusivity and foaming properties: Effects of surfactant type and structure, Colloids Surf., A, 2017, 524, 135–142 CrossRef CAS.
- Y. Tu, C. Yang, Y. Cheng, G. Zeng, L. Lu and L. Wang, Effect of saponins on n-hexane removal in biotrickling filters, Bioresour. Technol., 2015, 175, 2231–2238 CrossRef PubMed.
- N. Chegenizadeh, A. Saeedi and X. Quan, Most common surfactants employed in chemical enhanced oil recovery, Petroleum, 2017, 3, 197–211 CrossRef.
- R. Khademolhosseini, A. Jafari, S. M. Mousavi, H. Hajfarajollah, K. A. Noghabi and M. Manteghian, Physicochemical characterization and optimization of glycolipid biosurfactant production by native strain of Pseudomonas aeruginosa HAK01 and its performance evaluation for MEOR process, RSC Adv., 2019, 9, 7932–7947 RSC.
- N. Saxena, N. Pal, S. Dey and A. Mandal, Characterizations of surfactant synthesized from palm oil and its application in enhanced oil recovery, J. Taiwan Inst. Chem. Eng., 2017, 81, 343–355 CrossRef CAS.
- T. Song, C. Yang, G. Zeng, G. Yu and C. Xu, Effect of surfactant on styrene removal from waste gas streams in biotrickling filters, J. Chem. Technol. Biotechnol., 2012, 87(6), 785–790 CrossRef CAS.
- C. Yang, H. Qian, X. Li, Y. Cheng, H. He, G. Zeng and J. Xi, Simultaneous removal of multi-component VOCs in biofilters, Trends Biotechnol., 2018, 36(7), 673–685 CrossRef CAS PubMed.
- Y. Cheng, H. He, C. Yang, G. Zeng, X. Li, H. Chen and G. Yu, Challenges and solutions for biofiltration of hydrophobic volatile organic compounds, Biotechnol. Adv., 2016, 34(6), 1091–1102 CrossRef CAS PubMed.
- J. A. Ali, K. Kolo, A. Khaksar Manshad and A. H. Mohammadi, Recent advances in application of nanotechnology in chemical enhanced oil recovery: Effects of nanoparticles on wettability alteration, interfacial tension reduction, and flooding, Egypt. J. Pet., 2018, 27, 1371–1383 CrossRef.
- N. Moghaddam, A. Bahramian, Z. Fakhroueian, A. Karimi and S. Arya, Comparative study of using nanoparticles for enhanced oil recovery: wettability alteration of carbonate rocks, Energy Fuels, 2015, 29, 2111–2119 CrossRef.
- S. Al-Anssari, A. Barifcani, S. Wang, M. Lebedev and S. Iglauer, Wettability alteration of oil-wet carbonate by silica nanofluid, J. Colloid Interface Sci., 2016, 461, 435–442 CrossRef CAS PubMed.
- W. Kuang, S. Saraji and M. Piri, A systematic experimental investigation on the synergistic effects of aqueous nanofluids on interfacial properties and their implications for enhanced oil recovery, Fuel, 2018, 220, 849–870 CrossRef CAS.
- A. I. El-Diasty and A. M. Aly, Understanding the mechanism of nanoparticles applications in enhanced oil recovery, TPS technical Petroleum Services, SPE-175806-MS, 2015 Search PubMed.
- I. Y. Magda, R. M. El-Maghraby, S. M. Saleh and A. Elgibaly, Silica nanofluid flooding for enhanced oil recovery in sandstone rocks, Egypt, Egypt. J. Pet., 2018, 27, 105–110 CrossRef.
- H. Zhang, T. S. Ramakrishnan, A. D. Nikolov and D. Wasan, Enhanced oil recovery (EOR) driven by nanofilm structural disjoining pressure: flooding experiments and micro visualization, Energy Fuels, 2016, 30, 2771–2779 CrossRef CAS.
- A. M. S. Ragab and A. E. Hannora, An experimental investigation of silica nano particles for enhanced oil recovery applications, Presented at the SPE North Africa Technical Conference and Exhibition, Cairo, Egypt, SPE-175829eMS, 2015b, 14–16 September Search PubMed.
- R. Khademolhosseini, A. Jafari and M. H. Shabani, Micro scale investigation of enhanced oil recovery using nano/bio materials, Procedia Mater. Sci., 2015, 11, 171–175 CrossRef CAS.
- S. Emadi, S. R. Shadizadeh, A. K. Manshad, A. M. Rahimi and A. H. Mohammadi, Effect of nano silica particles on Interfacial Tension (IFT) and mobility control of natural surfactant (Cedr Extraction) solution in enhanced oil recovery process by nano-surfactant flooding, J. Mol. Liq., 2017, 248, 163–167 CrossRef CAS.
- S. Eshraghi, Y. Kazemzadeh, M. Qahramanpour and A. Kazemi, Investigating Effect of SiO2 Nanoparticle and Sodium-Dodecyl-Sulfate Surfactant on Surface Properties: Wettability Alteration and IFT Reduction, J. Pet. Environ. Biotechnol., 2017, 8, 1–5 Search PubMed.
- M. Mohajeri, M. Hemmati and A. S. Shekarabi, An experimental study on using a nanosurfactant in an EOR process of heavy oil in a fractured micromodel, J. Pet. Sci. Eng., 2015, 126, 162–173 CrossRef CAS.
- M. Zargartalebi, R. Kharrat and N. Barati, Enhancement of Surfactant Flooding Performance by use of Silica Nanoparticles, Fuel, 2015, 143, 21–27 CrossRef CAS.
- M. A. Ahmadi and S. R. Shadizadeh, Induced effect of adding nano silica on adsorption of a natural surfactant onto sandstone rock: Experimental and theoretical study, J. Pet. Sci. Eng., 2013, 112, 239–247 CrossRef CAS.
- L. N. Nwidee, M. Lebedev, A. Barifcani, M. Sarmadivaleh and S. Iglauer, Wettability alteration of oil-wet limestone using surfactant-nanoparticle formulation, J. Colloid Interface Sci., 2017, 504, 334–345 CrossRef CAS PubMed.
- Z. Mingwei, L. Wenjiao, L. Yuyang, D. Caili, W. Xink, Z. Hongda, Z. Chenwei, G. Mingwei, Z. Yue and W. Yining, Study on the synergy between silica nanoparticles and surfactants for enhanced oil recovery during spontaneous imbibition, J. Mol. Liq., 2018, 261, 373–378 CrossRef.
- D. P. Suhas, T. M. Aminabhavi, H. M. Jeong and A. V. Raghu, Hydrogen peroxide treated graphene as an effective nanosheet filler for separation application, RSC Adv., 2015, 5(122), 100984–100995 RSC.
- D. P. Suhas, T. M. Aminabhavi and A. V. Raghu, para-Toluene sulfonic acid treated clay loaded sodium alginate membranes for enhanced pervaporative dehydration of isopropanol, Appl. Clay Sci., 2014, 101, 419–429 CrossRef CAS.
- D. P. Suhas, T. M. Aminabhavi and A. V. Raghu, Mixed Matrix Membranes of H-ZSM5-Loaded Poly(vinyl alcohol) Used in Pervaporation Dehydration of Alcohols: Influence of Silica/Alumina Ratio, Polym. Eng. Sci., 2014, 54(8), 1774–1782 CrossRef CAS.
- S. M. G. Elyaderani and A. Jafari, Microfluidics experimental study in porous media applied for nanosilica/alkaline flooding, J. Pet. Sci. Eng., 2019, 173, 1289–1303 CrossRef.
- M. I. Bajestani, S. M. Mousavi, A. Jafar and S. A. Shojaosadati, Biosynthesis and physicochemical characterization of a bacterialpolysaccharide/polyamide blend, applied for microfluidics study in porous media, Int. J. Biol. Macromol., 2017, 96, 100–110 CrossRef CAS PubMed.
- A. Akbari, R. Yegani and B. Pourabbas, Synthesis of poly ethylene glycol (PEG) grafted silica nanoparticles with a minimum adhesion of proteins via one-pot one-step method, Colloids Surf., A, 2015, 484, 206–215 CrossRef CAS.
- A. Akbari, R. Yegani and B. Pourabbas, Synthesis of high dispersible hydrophilic poly ethylene glycol/vinyl silane grafted silica nanoparticles to fabricate protein repellent polyethylene nanocomposite, Eur. Polym. J., 2016, 81, 86–97 CrossRef CAS.
- M. Saki and A. R. Khaz'ali, Influence of Surfactant Type, Surfactant Concentration, and Salinity on Interfacial Tension of a Brine/Live Oil/Surfactant Fluid System: A Case Study of Iranian Asmari Oil Reservoir, Iranian Journal of Oil & Gas Science and Technology, 2017, 6(1), 1–12 Search PubMed.
- S. Kumar and A. Mandal, Studies on interfacial behavior and wettability change phenomena by ionic and nonionic surfactants in presence of alkalis and salt for enhanced oil recovery, Appl. Surf. Sci., 2016, 372, 42–51 CrossRef CAS.
- L. Wang, C. Yang, Y. Cheng, J. Huang, H. He, G. Zeng and L. Lu, Effects of surfactant and Zn (II) at various concentrations on microbial activity and ethylbenzene removal in biotricking filter, Chemosphere, 2013, 93(11), 2909–2913 CrossRef CAS PubMed.
- Kh. Jarrahian, O. Seiedi, M. Sheykhan, M. Vafaie Sefti and Sh. Ayatollahi, Wettability alteration of carbonate rocks by surfactants: A mechanistic study, Colloids Surf., A, 2012, 410, 1–10 CrossRef CAS.
- F. Hajibagheri, A. Hashemi, M. Lashkarbolooki and S. Ayatollahi, Investigating the synergic effects of chemical surfactant (SDBS) and biosurfactant produced by bacterium (Enterobacter cloacae) on IFT reduction and wettability alteration during MEOR process, J. Mol. Liq., 2018, 256, 277–285 CrossRef CAS.
| This journal is © The Royal Society of Chemistry 2019 |

