 Open Access Article
Liquid membrane catalytic model of hydrolyzing cellulose into 5-hydroxymethylfurfural based on the lattice Boltzmann method
Qun Meiab,
Xiangqian Weia,
Weitao Suna,
Xinghua Zhang b,
Wenzhi Li
 *a and
Longlong Ma*b
aLaboratory of Basic Research in Biomass Conversion and Utilization, Department of Thermal Science and Energy Engineering, University of Science and Technology of China, Hefei 230026, PR China. E-mail: liwenzhi@ustc.edu.cn
bCAS Key Laboratory of Renewable Energy, Guangzhou Institute of Energy Conversion, Chinese Academy of Sciences, Guangzhou 510640, PR China. E-mail: mall@ms.giec.ac.cn
First published on 25th April 2019
Abstract
Conversion of cellulose to 5-hydroxymethylfurfural (HMF) is an important means of biomass utilization. However, simulation of hydrolysis of cellulose and species transport in multiphase systems is still missing. In this paper, a multiphase lattice Boltzmann method of the Shan–Chen model has been applied for simulating the complex chemical reactions and interphase mass transfer in a liquid membrane catalytic reactor. For the sake of simplification, a single particle liquid membrane catalytic model is developed to simulate the hydrolysis of cellulose into HMF and its side reactions, which include the adsorption of cellulose particles on the liquid membrane, the complex chemical reactions inside the liquid membrane and the interphase transfer of HMF. This simulation presents the results of hydrolysis of cellulose and the HMF transport process. Additionally, the results show that the thinner liquid membrane thickness is beneficial for increasing the yield of HMF.
Introduction
With the consumption of fossil fuels and the consequent environmental problems, conversion of renewable biomass into fuels and value added chemicals has attracted widespread attention.1 5-Hydroxymethylfurfural (HMF), as an important chemical raw material, can be obtained from the abundant cellulose.2,3 In general, HMF is formed from fructose.4–6 First, cellulose is converted into glucose through hydrolyzation. Then, the glucose is converted into fructose through isomerization. Finally, fructose is converted into HMF through dehydration. The method of hydrolyzing cellulose into HMF in heterogeneous systems has been widely used.7–11 Ning Shi introduced two kinds of heterogeneous systems for degradation of cellulose into HMF.8,9 One is to degrade in hot compressed steam with inorganic acidic salts,8 and the other is to degrade in a biphasic system of water and organic solvent with a high concentration of sulfates.9 There are many similar parts in the two systems. Both of them are multiphase systems which include a solid phase (cellulose particle), liquid membrane phase (salt solution) and bulk phase (water vapor or organic solvent). The physicochemical problem is schematically shown in Fig. 1. Cellulose hydrolysis occurs on the solid surface. Then the resulting glucose enters the liquid membrane phase and continues to react to form fructose and HMF. As the same time, HMF diffuses into the bulk phase to reduce the concentration of HMF in the liquid membrane that can significantly inhibit subsequent side reaction of HMF. The system covers an extensive reaction network including the cellulose hydrolysis, glucose isomerization, HMF dehydration and complex side reactions. In addition, the system includes three phases and exists mass transfer at the phase interface.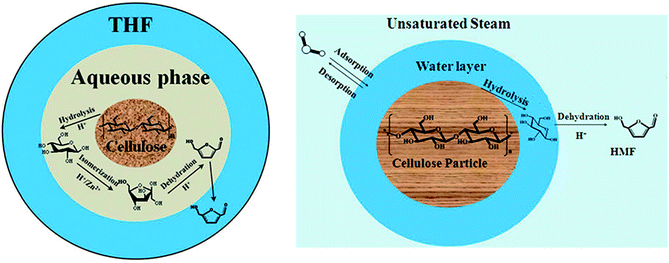 | ||
| Fig. 1 Proposed schematic illustration of HMF production from direct degradation of cellulose with acidic liquid membrane. | ||
The complex interaction of multiphase flow, interfacial mass transfer, and chemical reactions is hard to understand. Computational Fluid Dynamics (CFD) is a powerful tool for increasing our understanding, which is helpful in optimizing these reactions and their applications. After carefully reviewing the literature on utilization of cellulose, we found that there are many experimental studies, but theoretical research is still lacking. In the limited theoretical research literature, most of them focus on cellulose pyrolysis and cellulose hydrolysis performed enzymatically.12–14 There is hardly CFD modeling of liquid membrane hydrolysis of cellulose to HMF to the best of our knowledge. Therefore, a liquid membrane catalytic model of hydrolyzing cellulose into HMF needs to be built. But there are still challenges to model the multiphase reactions and interfacial mass transfer. Great efforts have been made to develop multiphase flow and mass transfer, such as gas–liquid modeling,15 heat transfer,16 chemical reaction.17 However, very few numerical studies have concentrated on multiphase solute mass transfer, especially interphase mass transfer, which is a necessary part of many multiphase reactions. In order to solve the problem, assuming an equilibrium state at the phase interface, the solute mass transfer is controlled by single phase convection–diffusion equation coupled with a species distribution law at the phase interface such as Henry law.18,19 Volume of fluid (VOF) method20 is commonly used in mass transfer simulation, which is largely based on continuity of the solute concentration at interface. But the numerical approach faces challenges on discontinuous physical problems that could affect the stability of the model.
In recent years, the lattice Boltzmann method (LBM), a mesoscopic method based on the discrete kinetic theory, has been rapidly developed and widely used in porous media,21,22 reactive transport23 and multiphase flow.24–26 Especially in terms of multiphase flow, lattice Boltzmann method does not need to track the phase interface as volume of fluid method27 or level set method.28 For example, in Shan–Chen model, phase separation can occur spontaneously by computing density variations. In dealing with solute mass diffusion problems, chemical reactions can be effectively incorporated in the bulk and at catalytic surface by adding source terms to the lattice Boltzmann equation.29 In addition, the lattice Boltzmann method is very convenient in dealing with complex solid boundary conditions.
However, there are some shortcomings with the Shan–Chen model which greatly limit its broad application. The spurious current at the two phase interfaces is a particularly important problem that could cause the numerical instability and limit the maximum density ratios achievable.30,31 Spurious current cannot be easily distinguished from the real flow velocities, which could lead to inaccuracies in calculating species transport across the phase interfaces. In this article, the Carnahan–Starling equation of state is employed that is beneficial to obtain a larger density ratio and reduce spurious current.32
The goal of the article is to establish a multiphase model that helps us understand the problems of multiphase reactions and solutes transport. The article is divided into two main parts. In the first part, the theory of the numerical model is introduced. Shan–Chen model for bulk flows with solid boundaries is reviewed. The techniques of incorporating C–S equation of state and calculating cohesive force and adsorption force are discussed in detail. Then, the lattice Boltzmann model for mass transfer is reviewed. In order to simulating two-phase interface solute transport, an additional collision operator is added to mass transfer equation. In the second part, the self-written LB codes for the model are validated. Finally, the results of the simulation are given and discussed.
Numerical model
Shan–Chen multiphase LBM
The lattice Boltzmann method is a mesoscopic simulation method between macroscopic continuous simulation and microscopic molecular dynamics simulation. In the LBM, the fluid is replaced by swarm of particles that migrate in a particular direction and collide at the grid nodes. Here, the Shan–Chen multiphase model (SC model) originally proposed by Shan and Chen33,34 is used to simulate liquid membrane reaction and mass transfer. Shan and Chen used a pseudo-potential to reflect the microscopic interactions between the fluid particles at the neighboring lattices. With the interaction of cohesive forces, spontaneous separation into gas and liquid phase occurs.Lattice Boltzmann calculation can be divided into two steps. The first is collision where density distributions become quasi equilibrium distributions. The second is streaming where the distributions move to neighboring nodes. To simplify the collision process, the Bhatnagar–Gross–Krook collision operator35 is employed. The standard lattice Boltzmann equation can be expressed as follows:
 | (1) |
 | (2) |
The weight factors ωi are 4/9 for i = 0, 1/9 for i = 1, 2, 3, 4, and 1/36 for i = 5, 6, 7, 8. ei are velocity vectors with subscript i indicating the discrete velocity direction for the D2Q9 model. τ is the single relaxation time, having the relation with the kinematic viscosity: υ = (τ − 0.5)cs2Δt, cs = c/√3, c = Δx/Δt. Δt is the time step, Δx is the lattice spacing.
The fluid density ρ and fluid velocity u can be achieved by the first order and second order moments of the density distribution function.
 | (3) |
 | (4) |
The previous section introduces a pure fluid system without interactions with solid surfaces. In order to realize the coexistence of different phase states and the adsorption of solid to fluid, two forces can be introduced into lattice Boltzmann equation on the basis of SC model.36 One is the cohesive force between fluid particles at the neighboring lattices and the other is the adsorption force of solid surface to fluid.
The cohesive force play an important role in phase separation in the SC model. The force is given as follows:
 | (5) |
| ψ = ρ0[1 − exp(ρ/ρ0)]. | (6) |
But the effective mass can be changed when we want to use different equations of state.
Theoretically, the effective mass can be changed to obtain different equations of state. If there is no interaction, the fluid is liked an ideal gas. Yuan and Schaefer32 tried a variety of EOS in the SC model and gave their advantages and disadvantages. Based on their studies, the Carnahan–Starling EOS is employed and effective mass is as follows:
 | (7) |
In addition to the fluid interior, the fluid–solid interface must be considered. The wettability of solid surface determines the adsorption of cellulose particles to water, which is a necessary condition for the formation of liquid membrane. Contact angle is a common measure of the solid surface wettability. If the contact angle is less than 90 degrees, the fluid is wetting and tends to form thin films on solid surfaces. On the contrary, when the contact angle of the fluid is greater than 90 degrees, the fluid is non-wetting, and the fluid tends to form a droplet on the solid surface. The adsorption force determines the wettability of the solid surface which can be written as follows:
 | (8) |
The method of incorporating forcing terms into the LBM greatly affects the spurious currents and stability. Here, we use the speed correction method for equilibrium distribution proposed by Shan and Chen.33
The LB model for mass transfer
Like the density distribution function fi(x,t), a component distribution function gi(x,t) is used to describe the solute transfer. The following equation is used to describe mass transfer:
 | (9) |
 | (10) |
In general, the solute concentration is low enough that cannot influence the macroscopic motion. Therefore, the macroscopic velocity can be calculated from the density distribution function of the solvents. The component concentration can be achieved by the first order of the component distribution function.
 | (11) |
Non-ideal solutes component
These solutes which may exist in different phases at thermodynamic equilibrium and exhibit different concentration in the phase interface region are called non-ideal solutes. For example, there are some solutes with different solubility in different solvents. When they dissolve in a heterogeneous system, concentration discontinuities may occur at the phase interface. Therefore we take some steps to make the concentration smooth through the phase interface. The solute concentration distribution can be shown in Fig. 2. Two kinds of components are distributed on the opposite of the interface and mix in the interface layer which can result in a smooth transition of the mass fraction. From the picture, the non-ideal solute is weakly soluble in component σ1 and more soluble in component σ2. And it can be found that the solute concentration in the interface is smooth, facilitating numerical simulation greatly.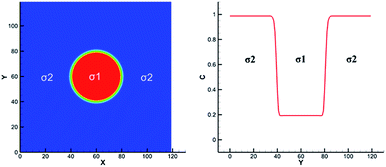 | ||
| Fig. 2 Example of non-ideal solute distribution along a cross section of a spherical droplet. Solute concentration with red solid line. Solvent mass fraction with red for σ1 and blue for σ2. | ||
It is not exactly the same as the mass transfer model introduced earlier. In order to apply the equation to multiphase flow, a solute–solvent interaction is introduced. But we need to pay attention to that the interaction just affect the solute without affecting the solvent, which is not inconsistent with the previous mass transfer model.
Antoine Riaud37 and Yu-Hang Fu38 studied the reaction of dilute species and multiphase mass transfer using a color-field LBM. Referring to the re-coloration process of color-field LBM, we add a collision operator to mass transfer equation to reflect the interaction. An arbitrary function Ws(xσ) is chosen to make the solute sensitive to the solvent distribution. The lattice Boltzmann equation can be written as
 | (12) |
In the equation, geqi = wiC, vector n is normal vector of solvent mass distribution xσ which is given in equations:
| n = −∇xσ/|∇xσ|. | (13) |
 | (14) |
| xσ = (ρ − ρg)/(ρl − ρg). | (15) |
In a two-phase system, Ws(xσ) could be xσ(xσ − 1). βs is an important quantity that determines the distribution of the solute in different phases. And it is a function of the solubility of solute or Henry coefficient.39
Results and discussion
Code validation of Shan–Chen multiphase LBM
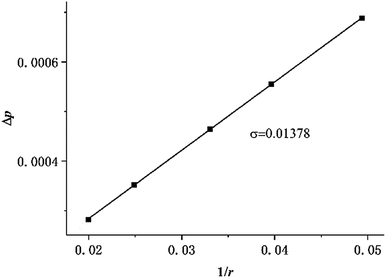
Two physical problems are chosen for validating Shan–Chen multiphase model. The first problem is Laplace law that reflects the cohesive force of fluid. Another is the contact angle problem that contains cohesive force and adsorption force.In order to validation of Laplace law, we build a periodic two dimensional simulation domain of 200 × 200 lattices. And a liquid droplet with initial radius r is placed in the middle of the domain. In the multiphase flow simulation, the droplet density is initialized to ρhigh and other gas phase domain is initialized to ρlow. The numerical values of ρhigh and ρlow can be set as the theoretical densities calculated by Maxwell equal area construction or the actual densities obtained by simulation of phase separation. Then, we change the radius of the droplet to calculate surface tension coefficient. The Laplace law indicates that the pressure difference inside and outside a droplet is proportional to the reciprocal of the radius.
 | (16) |
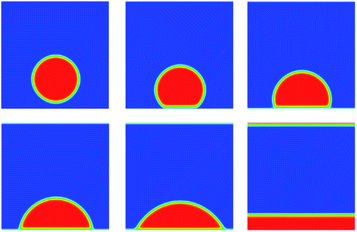
Another problem for validation of Shan–Chen multiphase flow is contact angle. We build a periodic two dimensional simulation domain of 200 × 200 lattices. A liquid droplet is placed on the surface of the plate at the bottom of the computational domain. Meanwhile, the top and bottom boundaries are set to solid wall boundary conditions. Here, the solid surface wettability is changed by adjusting the density of the solid that is just an imaginary density for calculating the interaction force. In the simulation results, the size of contact angle can reflect solid surface wettability. The imaginary density of the solid is defined as follows:
| ρs = λ(ρh − ρl) + ρl. | (17) |
The coefficient λ ranges from 0 to 1 that determines the wettability of solid surface. From the Fig. 4, as the value of λ increases from zero, the contact angle decreases from 180 degrees.
Code validation of LB model for mass transfer
In our simulation, the system is divided into three parts, including solid phase, liquid membrane and bulk phase. In addition, some chemical substances dissolve in liquid membranes and bulk phase, such as HMF and glucose. HMF is soluble in both phase without different solubility. Glucose and other substances dissolve only in liquid membrane and not in the bulk phase. Therefore, the two non-ideal solutes need to be distinguished in the mass transfer model. As shown in the Table 1, the parameter Ws(xσ) can solve the problem well.| Type | Single phase | Two phase |
|---|---|---|
| Ws(xσ) | xσ − 1 | xσ(xσ − 1) |
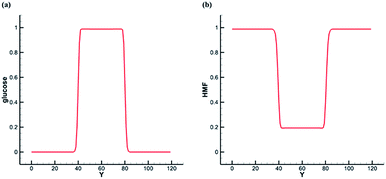
Based on the previous SC model, the center of the simulation domain is water phase, and the rest is bulk phase. We tune Ws(xσ) and compare the interface concentration distribution of the two solutes. Initially, we set concentration of glucose in the liquid membrane phase as one, and concentration of glucose in the bulk phase as zero. As shown in the Fig. 5a, glucose is only dissolved in the water phase at the steady state. We set concentration of HMF in the liquid membrane phase as zero, and concentration of HMF in the body phase as one. As shown in the Fig. 5b, HMF is soluble in both phase at the steady state, and its solubility in the bulk phase is about five times that in the water phase. The differences of solubility depend on the parameter βs. Here, the solubility of HMF in the bulk phase is set at 5 times that in water phase.
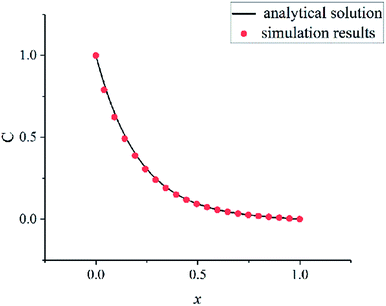
In order to verify the written program, a convection–diffusion reaction problem is simulated. The system is discretized by 100 × 100 lattices. The concentration of solute A is one at the left boundary (x = 0) and is zero at the right boundary (x = 100). The solvent flows in the x direction at a velocity u. Solute A is reacting at whole computation domain. The concentration control equation of solute A is as follows:
 | (18) |
The eqn (18) is an ordinary differential equation and can be solved directly. Here, the reaction constant k is set to 2000. The Fig. 6 shows the concentration distribution of solute A in the x direction. The simulation results agree well with the analytical solutions that can verify the written program.
Single particle liquid membrane catalytic reaction
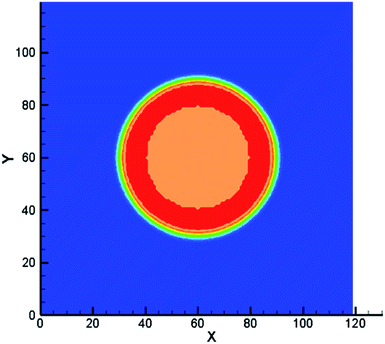
In this section, previous numerical model that has been verified is applied to the study of liquid membrane catalytic reaction. As described above, the hydrolysis of cellulose to HMF is a complex physicochemical process. Therefore, we just simulate the reactions of single particle system to simplify the simulation. Two hypotheses are given in the single particle liquid membrane model. Cellulose particle is regarded as a rigid sphere and the particle size is considered constant. The simulation domain is shown in Fig. 7, which is a three phase system. The system is discretized by 120 × 120 lattices. Initially, a circular particle with the radius of 20 lattices is located in the middle of the domain. Liquid membrane with the thickness of 10 lattices is adsorbed on the surface of the particle due to the hydrophilicity of the cellulose particles. The outermost phase can be an organic solvent such as tetrahydrofuran (THF). Cellulose is first hydrolyzed to glucose on the surface of the particle. Then, the resulting glucose diffuses into the liquid membrane and participate in subsequent reactions. Finally, HMF generated in the liquid membrane diffuses into the bulk phase. The size of cellulose particle is assumed to be constant for simplification.The following equation is utilized to connect the real physical parameters and dimensionless physical parameters. The particle diameter is 4 × 10⁻⁴ m and kinematic viscosity υ is 1.006 × 10⁻⁶ m2 s−1.
 | (19) |
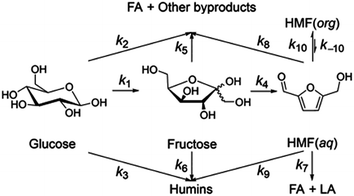
Jinqiang Tang41 performed a systematic experimental kinetics study on conversion of glucose to 5-hydroxymethylfurfural in water/THF biphasic solvent. As the Fig. 8 shown, referring to the proposed mechanism of glucose to HMF, we derive the following system of ordinary differential equations applying first order reaction. The values of reaction kinetics parameters are obtained from the ref. 41 that are summarized in Table 2.
 | (20) |
 | (21) |
 | (22) |
| Rate constant | k1 | k2 | k3 | k4 | k5 |
| ×10−3 min−1 | 2.9 | 2.9 | 0.003 | 10.1 | 3.9 |
| Rate constant | k6 | k7 | k8 | k9 | |
| ×10−3 min−1 | 2.5 | 0.07 | 0.6 | 0.001 |
Among these complex reactions, glucose, fructose and HMF are the main research subjects. Other products are the result of side reaction. Fig. 9 shows the concentration of glucose, fructose and HMF as a function of time for the whole reaction system. In the initial stage of the reactions, the concentration of glucose increases rapidly. Soon, its growth slows down. When the amount of glucose reaches a certain level, the concentration of fructose and HMF starts to rise. Ultimately, the concentration of glucose and fructose remains unchanged with the reactions tending to balance. This behavior supports glucose and fructose as an intermediate for HMF production from cellulose in this system. But the amount of HMF continues to increase rapidly at a constant rate. It can be explained by concentration of HMF in the liquid membrane.
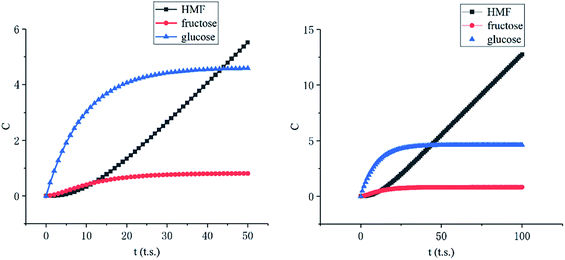 | ||
| Fig. 9 Concentration of glucose, fructose and HMF as a function of time (left: initial stage, right: stable stage). | ||
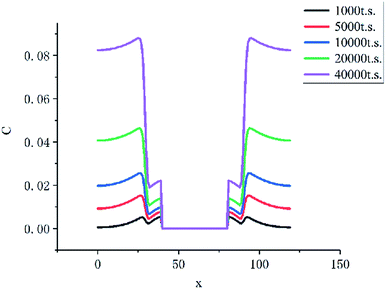
As the Fig. 10 shown, the concentration of HMF in the liquid membrane (between 30 to 40 lattices) is far less than that in the bulk phase (between 0 to 30 lattices), which is caused by the differences in solubility of HMF. In addition, the volume of the bulk phase is much larger than that of the liquid membrane phase. These two factors make HMF in the system almost concentrates in the bulk phase, which significantly inhibits the side reaction of HMF.
Effects of the thickness of liquid membrane
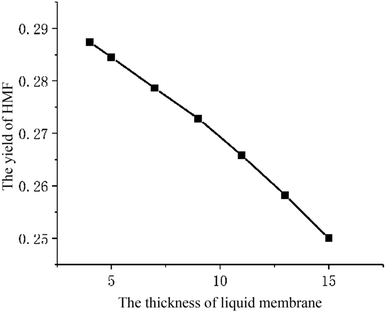
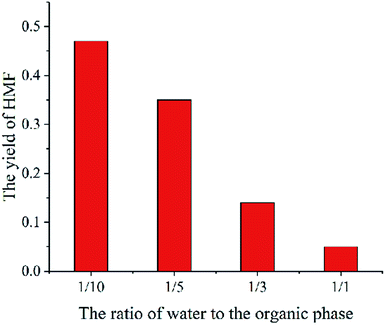
The parameter studies examining the effects of the thickness of liquid membrane on the catalytic reaction processes are presented. Flowing the single particle liquid membrane catalytic reaction model, only the thickness of liquid membrane is changed. Fig. 11 shows the relationship between the yield of HMF and the thickness of liquid membrane. With the rise in thickness of the liquid membrane, the yield of HMF decreases. Such phenomena is qualitatively consistent with the experimental results (Fig. 12)9 where cellulose is hydrolysed at different volume ratios of water and THF solvent (a larger ratio of water and THF means a larger thickness of liquid membrane). In addition, comparing the concentration of HMF in the liquid membrane at different thicknesses, we found that the concentration is higher with the thickness increasing, which is conducive to side reaction of HMF. Therefore, the yield of HMF is inversely proportional to the thickness of the liquid membrane. But in some ref. 8 and 9, there will be tremendously low yield of HMF at low amounts of water. The reason may be that cellulose is pyrolyzed or liquid membrane could not completely cover cellulose particles, which is beyond the scope of the model.Conclusion
A liquid membrane catalytic model based on the LBM is developed including multiphase flow, complex chemical reactions and interphase mass transfer. In this model, adsorption force is used to achieve the adsorption of cellulose particle on the liquid membrane and cohesion force is used to achieve the phase separation of water and THF. The problem that the concentration of HMF is discontinuous at water–THF phase interface is solved by adding a collision operator into mass transfer lattice Boltzmann equation. With the help of the proposed model, complex chemical reactions are simulated through a multiphase lattice Boltzmann approach. The glucose, fructose and HMF distributions in the liquid membrane and THF are presented. In addition, the effect of membrane thickness on the reaction is discussed. To simplification, the liquid membrane catalytic model contains only one particle. In the near future, we aim to apply the model to study gas–liquid–solid catalytic reactor8 and water–THF biphasic catalytic reactor9 by increasing cellulose particle number and removing the assumption that the particle size is constant.Conflicts of interest
There are no conflicts to declare.Acknowledgements
This work was supported by grants from the National Natural Science Foundation of China (No. 51576198 and 51536009), the “Transformational Technologies for Clean Energy and Demonstration”, Strategic Priority Research Program of the Chinese Academy of Sciences (No. XDA21060102).References
- A. Takagaki, S. Nishimura and K. Ebitani, Catal. Surv. Asia, 2012, 16, 164–182 CrossRef CAS.
- D. K. Shen, R. Xiao, S. Gu and K. H. Luo, RSC Adv., 2011, 1, 1641–1660 RSC.
- Z. M. Xue, M. G. Ma, Z. H. Li and T. C. Mu, RSC Adv., 2016, 6, 98874–98892 RSC.
- P. Dornath and W. Fan, Microporous Mesoporous Mater., 2014, 191, 10–17 CrossRef CAS.
- A. Pande, P. Niphadkar, K. Pandare and V. Bokade, Energy Fuels, 2018, 32, 3783–3791 CrossRef CAS.
- Z. M. Xue, B. B. Cao, W. C. Zhao, J. F. Wang, T. T. Yu and T. C. Mu, RSC Adv., 2016, 6, 64338–64343 RSC.
- F. Buendia-Kandia, G. Mauviel, E. Guedon, E. Rondags, D. Petitjean and A. Dufour, Energy Fuels, 2018, 32, 4127–4138 CrossRef CAS.
- N. Shi, Q. Y. Liu, L. L. Ma, T. J. Wang, Q. Zhang, Q. Zhang and Y. H. Liao, RSC Adv., 2014, 4, 4978–4984 RSC.
- N. Shi, Q. Y. Liu, Q. Zhang, T. J. Wang and L. L. Ma, Green Chem., 2013, 15, 1967–1974 RSC.
- L. S. Yan, R. S. Ma, H. X. Wei, L. Z. Li, B. Zou and Y. W. Xu, Bioresour. Technol., 2019, 279, 84–91 CrossRef CAS PubMed.
- C. L. Cai, Q. Y. Liu, J. Tan, T. J. Wang, Q. Zhang and L. L. Ma, BioResources, 2017, 12, 1201–1215 CAS.
- Q. Xue, T. J. Heindel and R. Fox, Chem. Eng. Sci., 2011, 66, 2440–2452 CrossRef CAS.
- Y. H. Li, X. X. Cao, Z. F. Geng and M. H. Zhang, Can. J. Chem. Eng., 2018, 96, 770–778 CrossRef CAS.
- Q. G. Xiong and S. C. Kong, ACS Sustainable Chem. Eng., 2016, 4, 5456–5461 CrossRef CAS.
- L. Amaya-Bower and T. Lee, Philos. Trans. R. Soc., A, 2011, 369, 2405–2413 CrossRef PubMed.
- X. He, S. Chen and G. D. Doolen, J. Comput. Phys., 1998, 146, 282–300 CrossRef.
- Y. Y. Pan and S. C. Kong, Energy Fuels, 2017, 31, 635–646 CrossRef CAS.
- N. D. Raimondi, L. Prat, C. Gourdon and P. Cognet, Chem. Eng. Sci., 2008, 63, 5522–5530 CrossRef.
- N. D. Raimondi and L. Prat, AIChE J., 2011, 57, 1719–1732 CrossRef CAS.
- M. R. Davidson and M. Rudman, Numer. Heat Transfer, Part B, 2002, 41, 291–308 CrossRef CAS.
- Q. Liao, Y. X. Yang, X. Zhu, R. Chen and Q. Fu, Int. J. Heat Mass Transfer, 2017, 109, 1132–1142 CrossRef CAS.
- Q. G. Xiong, E. Madadi-Kandjani and G. Lorenzini, Continuum Mech. Thermodyn., 2014, 26, 907–917 CrossRef CAS.
- P. Rama, Y. Liu, R. Chen, H. Ostadi, K. Jiang, Y. A. Gao, X. X. Zhang, R. Fisher and M. Jeschke, Energy Fuels, 2010, 24, 3130–3143 CrossRef CAS.
- L. Chen, Q. J. Kang, Y. T. Mu, Y. L. He and W. Q. Tao, Int. J. Heat Mass Transfer, 2014, 76, 210–236 CrossRef CAS.
- J. Sato, T. Iida, F. Kiyono and T. Sato, Energy Fuels, 2016, 30, 7100–7107 CrossRef CAS.
- Q. Li, Y. Yu, P. Zhou and H. J. Yan, RSC Adv., 2017, 7, 14701–14708 RSC.
- R. Bonhomme, J. Magnaudet, F. Duval and B. Piar, J. Fluid Mech., 2012, 707, 405–443 CrossRef CAS.
- R. I. Saye and J. A. Sethian, Proc. Natl. Acad. Sci. U.S.A., 2011, 108, 19498–19503 CrossRef CAS PubMed.
- G. De Prisco and X. W. Shan, Commun. Comput. Phys., 2011, 9, 1362–1374 CrossRef.
- J. F. Zhang, Microfluid. Nanofluid., 2011, 10, 1–28 CrossRef.
- T. Lee and P. F. Fischer, Phys. Rev. E: Stat., Nonlinear, Soft Matter Phys., 2006, 74, 046709 CrossRef PubMed.
- P. Yuan and L. Schaefer, Phys. Fluids, 2006, 18, 11 Search PubMed.
- X. W. Shan and H. D. Chen, Phys. Rev. E: Stat. Phys., Plasmas, Fluids, Relat. Interdiscip. Top., 1993, 47, 1815–1819 CrossRef.
- X. W. Shan and H. D. Chen, Phys. Rev. E: Stat. Phys., Plasmas, Fluids, Relat. Interdiscip. Top., 1994, 49, 2941–2948 CrossRef CAS.
- P. L. Bhatnagar, E. P. Gross and M. Krook, Phys. Rev., 1954, 94, 511–525 CrossRef CAS.
- M. C. Sukop and D. Or, Water Resour. Res., 2004, 40, 11 CrossRef.
- A. Riaud, S. F. Zhao, K. Wang, Y. Cheng and G. S. Luo, Phys. Rev. E: Stat., Nonlinear, Soft Matter Phys., 2014, 89, 053308 CrossRef PubMed.
- Y. H. Fu, L. Bai, K. H. Luo, Y. Jin and Y. Cheng, Phys. Rev. E, 2017, 95, 043304 CrossRef PubMed.
- M. Latva-Kokko and D. H. Rothman, Phys. Rev. E: Stat., Nonlinear, Soft Matter Phys., 2005, 71, 056702 CrossRef CAS PubMed.
- L. Chen, Q. J. Kang, B. A. Robinson, Y. L. He and W. Q. Tao, Phys. Rev. E: Stat., Nonlinear, Soft Matter Phys., 2013, 87, 043306 CrossRef PubMed.
- J. Q. Tang, L. F. Zhu, X. Fu, J. H. Dai, X. W. Guo and C. W. Hu, ACS Catal., 2017, 7, 256–266 CrossRef CAS.
| This journal is © The Royal Society of Chemistry 2019 |

