 Open Access Article
Controllable synthesis of three-dimensional nitrogen-doped hierarchical porous carbon and its application in the detection of lead†
Runying Dai *,
Xue Ma,
Quan Xu and
Limin Lu*
Key Laboratory of Crop Physiology, Ecology and Genetic Breeding, Ministry of Education, Institute of Functional Materials and Agricultural Applied Chemistry, College of Science, Jiangxi Agricultural University, Nanchang 330045, PR China. E-mail: runyingdai@163.com; lulimin816@hotmail.com
First published on 17th June 2019
Abstract
In this study, gelatin-based microcapsules were first proposed as a carbon source for the synthesis of nitrogen-doped hierarchical porous carbon (N-HPC) via a facile one-pot high-temperature treatment. The morphologies of the microcapsules could be well controlled by adjusting the synthesis parameters; this ensured the repeatability of the calcined products. The as-prepared N-HPC possesses a favorable three-dimensional network structure and hierarchical porous structure. As a promising modified electrode, N-HPC displayed remarkably improved stability and sensitivity for lead ion (Pb2+) detection. Moreover, two factors are responsible for the good analytical performance: (i) the morphologies of the microcapsules are controllable and reproducible; this improves the detection stability; and (ii) the nitrogen atoms in the shells of the microcapsules can efficiently interact with Pb2+; this enhances the detection sensitivity. The influences of various experimental parameters, including the pH value of the supporting electrolyte, deposition potential and deposition time, on the stripping signal of Pb2+ were investigated. The method displayed a wide linear range of the Pb2+ concentration from 7 nM to 7000 nM with the detection limit of 1.44 nM under the optimized conditions. The modified electrode possessed high selectivity, which might be due to the high binding affinity of the NH2− groups to Pb2+. The developed method has been successfully applied to the detection of Pb2+ in actual water samples; this demonstrates that the N-HPC-based electrochemical sensors have prospective applications in the environmental monitoring of Pb2+.
Introduction
Heavy metal pollution causes significant damage to the environment and human health. Lead (Pb2+) is one of the highly poisonous metals, which can be deposited in plants and animals and ultimately harms human health by transfer via the food chain. Small amounts of Pb2+ may have severe effects on the human soft tissues, blood, organs, bone and immune system.1,2 The World Health Organization (WHO) has designated the maximum allowable limit of 10 ppb (48 nM) for Pb2+ in drinking water.3 Consequently, the quantitative determination of Pb2+ in the environment is important.To date, various techniques, such as atomic absorption spectroscopy,4 inductively coupled plasma mass spectrometry,5 ion chromatography,6 surface enhanced Raman spectrometry,7 and electrochemical methods,8 have been widely used in the detection and monitoring of Pb2+. Among them, electrochemical methods are considered as a valid technique for the trace determination of heavy metal ions due to their good selectivity, high sensitivity, fast response and convenience.9,10 The key to electrochemical sensing technique is the enrichment of target ions on the surface of a working electrode and electron transfer between the composite material and the electrode. Therefore, the selection of suitable materials to construct the electrode interface has a significant influence on the sensing performance.
Carbon nanomaterials, especially carbon with a three-dimensional (3D) heterostructure, are considered to be unique and attractive electrode modification materials due to their fast electron transfer and large specific surface area.9,11–13 Wang et al. prepared a novel supporting material for an electrochemical sensing platform using three-dimensional macroporous carbon (3D-KSCs) obtained from kenaf stem (KS).14 The 3D-KSC-modified electrode had a 3D honeycomb porous structure and exhibited good electrochemical behavior for the reduction or oxidation of H2O2, glucose and amino acids.14 Qiu et al. developed a 3D graphene/sodium dodecyl benzene sulfonate hemimicelle (GF/SDBS HM) composite electrode. The GF/SDBS HM-based sensor exhibited excellent peel performance in Pb2+ analysis, and the detection limit was 0.0145 nM, which could be ascribed to the unique accumulation and deposition behavior of the 3D graphene foam.15 Although the above mentioned 3D carbon materials showed significant electrochemical behavior, their morphologies were unpredictable; this might result in poor electrode reproducibility. Thus, a method for the controllable preparation of a 3D carbon nanomaterial is highly required.
To date, the template method has been demonstrated to be an effective approach to obtain 3D heterostructured carbon. For example, recently, Deng et al. reported 3D graphene-like carbon frameworks (3DGLCFs) with high specific surface area and high content of nitrogen dopant. For the sensing of ascorbic acid, dopamine and uric acid, the current response at the 3DGLCF electrode was much higher than that at commercial graphene.16 Liu et al. prepared porous graphene-like carbon materials (PGCMs) using petroleum pitch as a carbon source and nano-CaCO3 as a template. At 0.5 A g−1, the obtained materials displayed the high surface area and specific capacitance of 899 m2 g−1 and 218.75 F g−1, respectively.17 Indeed, these methods show high controllability and reproducibility; however, complex steps are required for template removal; hence, the development of a controllable and reproducible synthetic method in a simple and green fashion remains a significant challenge.
Microcapsules, a kind of core–shell structure materials, can be commonly obtained by in situ polymerization, interfacial polymerization, spray drying, solvent evaporation, and complex coacervation. Compared to other methods, complex coacervation is simple and efficient, and the involved raw materials, such as gelatin, gum arabic, chitosan, etc., are also very cheap.18 Especially, the morphologies of gelatin-based microcapsules can be easily controlled by adjusting the synthesis parameters.19–21 Moreover, note that the gelatin-based microcapsules are rich in N atoms, which have high electronegativity and exhibit strong metal ion-coordinating ability. Thus, it is expected that microcapsules would be ideal precursors for the preparation of N-doped 3D porous carbons, which can be regarded as an excellent electrochemical sensing platform for the detection of heavy metals.
Herein, for the first time, nitrogen-doped 3D hierarchical porous carbon (N-HPC) was synthesized via a simple one-pot high-temperature treatment by adopting gelatin-based microcapsules as the carbon source without any additional template. The obtained N-HPC was used as an efficient sensing material for the detection of Pb2+ using the differential pulse anodic stripping voltammetry (DPASV) method. Due to strong coordination between Pb2+ and the N atoms in N-HPC and large specific surface area of N-HPC, the N-HPC-modified electrode significantly improved the sensitivity and selectivity of the sensor towards Pb2+ detection. Moreover, the modified electrode showed superior reproducibility, stability, and repeatability.
Experimental
Materials
Gelatin (GE, isoelectric point pH, pI = 4.7) was purchased from Qunli Gelatin Chemical Co. (Hangzhou, China). Sodium carboxymethyl-cellulose (NaCMC), acetic acid and glutaraldehyde (25 wt%) were purchased from Aladdin Reagent Co. (Shanghai, China). Nitric acid, tetrachloroethylene, HAc and NaAc were bought from Tianjin Damao Chemical Reagent Factory (Tianjin, China). Dioctyl sulfosuccinate sodium (DSS) was produced by Shanghai Chuanxin Chemical Co. Ltd (Shanghai, China). At pH values of 3.0–8.0, the effect of the supporting electrolyte was studied by using HAc–NaAc buffer solutions. The preserved Pb2+ solutions were fabricated by diluting PbCl2 with the 0.1 M HNO3 solution. Distilled water was used in all experiments. All chemicals were directly employed and required no purification.Apparatus
The optical microscopy (OM, BX-51, Olympus Co., Japan) and scanning electron microscopy (SEM, S-3400N, Hitachi Co., Japan) were used for characterizing the morphologies of the GE/NaCMC/DSS microcapsules (GMs). Energy dispersive X-ray spectroscopy (EDX, EMAX X-act, Horiba Co., Japan) was used to analyze the elements of the N-HPC. An adopting laser particle size analyzer (LS 13320, Beckman Coulter Co., USA) was used to measure the particle size distribution of the GMs. The thermal behavior of the GMs was measured on a thermogravimetric analyzer (TGA, TGA 4000, PerkinElmer Co. USA). The GMs were carbonized in a vacuum tube furnace (SKGL-1200C, Shanghai Jvjing Precision Instrument Manufacturing Co., China). The GMs were freeze-dried in vacuum (FD-1A-50, Beijing Boyikang Experimental Instrument Co., China). An electrochemical workstation (ECW, CHI 660D, Shanghai Chen Hua instruments Co., China) was used to record the electrochemical tests. The three-electrode system was comprised of an auxiliary electrode, reference electrode (SCE) and working electrode. The working electrode was the modified electrode.Preparation of microcapsules by complex coacervation
GE/NaCMC/DSS microcapsules, which belong to the gelatin-based microcapsules (GMs), were made according to a previous publication with some modifications.22 Briefly, the GMs were prepared with 14 g GE (10%, w/v), 40 g NaCMC (0.5%, w/v) and 0.0267 g (0.6 mM) dioctyl sulfosuccinate sodium (DSS) and the shell materials were prepared by dissolving in distilled water, which was stirred (250 rpm) in a water bath (40 °C) for 1 h. 12 g of a tetrachloroethylene suspension served as the core material and was quickly added into the shell materials to form the mixture solution, which was stirred at 250 rpm. The complex coacervates were formed when the pH of the mixture solution was lower than the pI of the gelatin solution. After the temperature was slowly cooled to below 5 °C, 2.0 g glutaraldehyde (25%) as a crosslinker was added to the complex coacervates. After washing with distilled water, the obtained microcapsules were freeze dried.N-HPC modified GCE (N-HPC/GCE)
The GCE (Ф = 3 mm) was buffed with a ruthenium containing lithium oxide, cleaning with distilled water, then drying at room temperature prior to modification.The nitrogen-doped 3D hierarchical porous carbon (N-HPC) was obtained via carbonizing the above prepared GMs at high temperature. A 1.0 mg mL−1 N-HPC suspension solution was prepared by dispersing 2.0 mg N-HPC in a 2.0 mL aqueous solution. The N-HPC suspension solution was sonicated for 30 minutes, and then 5 μL of the N-HPC suspension was spun on the GCE surface. Finally, the N-HPC-modified GCE (N-HPC/GCE) was air dried before use.
Electrochemical determination for Pb2+
All of the electrochemical tests were executed in 0.1 M HAc-NAc buffer solution containing a certain amount of Pb2+ at pH 5.0. Pb2+ was deposited on the N-HPC/GCE surface for 300 s with a deposition potential of −0.8 V in an agitated solution. Differential pulse anodic stripping voltammetry (DPASV) was adopted to detect Pb2+, tested in the potential range of −0.8 V–0.6 V with the following test parameters: 50 mV amplitude, 50 ms pulse width, 4 mV potential step, 0.2 s pulse period, 16.7 ms sample width, and 2 s quiet time. Prior to the next measurement, a “cleaning” step was performed as follows: N-HPC/GCE was immersed in 0.1 M HAc–NaAc buffer solution with a pH of 5.0. Then, a chronoamperometric technique with a potential of +0.3 V was performed on N-HPC/GCE for 150 s. All the tests were performed in air at room temperature.Results and discussion
Characterization of GMs and N-HPC
The FTIR spectrum of the obtained N-HPC is shown in Fig. S1.† The big peak located at 3421 cm−1 corresponds to the stretching vibration of –NH. The peaks at 2922 cm−1 and 2853 cm−1 are attributed to the asymmetric and symmetric stretching vibrations of –CH2, respectively. The peaks at 1460 cm−1 and 1399 cm−1 are assigned to the asymmetric and symmetric stretching vibrations of –CH3, respectively. The peak at 1056 cm−1 is attributed to the C–O–C stretching vibration.Fig. 1 shows the surface morphology and the particle size distribution of the microcapsules obtained using GE/NaCMC/DSS at pH 4.5. The gelatin microcapsules (GMs) had a good appearance and were optically transparent (Fig. 1a). A uniform particle size of the GMs and the mean diameter of 6.75 μm were observed, as shown in Fig. 1b. Fig. 1c demonstrates a cross-section image of the GMs. The shell materials of the microcapsules were composed of many uniform micropores with the pore size of about 6.5 μm. The microcapsules exhibited shrinkage due to the removal of water. Fig. 1d displays a cross-section image of N-HPC. Compared with the GMs, the shell materials of the microcapsules shrunk after calcination, and the pore size of the microcapsules decreased to about 1.2 μm. The TEM image in Fig. S2† exhibits that N-HPC is composed of carbon thin films with macropores or mesopores, which would be favorable for the adsorption of target ions.
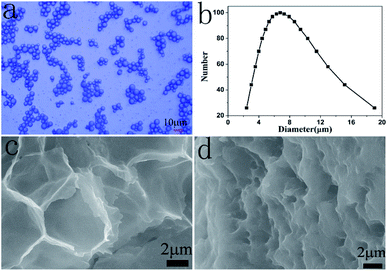 | ||
| Fig. 1 Surface morphology and particle size distribution of the microcapsules: (a) OM of GMs; (b) particle size distribution of GMs; (c) SEM of GMs; and (d) SEM of N-HPC. | ||
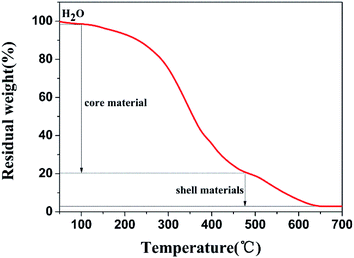
Fig. 2 shows the thermal stability of the GMs as a function of temperature. The gradual weight loss of 1.74% represents the volatilization of water in the microcapsules before 100 °C. The sharp weight loss of 77.32% between 100 °C and 480 °C may represent the decomposition of the core materials including tetrachloroethylene. At 480–640 °C, the weight loss of 18.10% may be attributed to the decomposition of the shell materials of the microcapsules, which suggests that the shell materials can be carbonized at temperatures higher than 640 °C. Therefore, N-HPC was formed at the temperature of 650 °C in 6 h with the GMs.
The XRD pattern of N-HPC is shown in Fig. S3.† A broad peak around 25° in the XRD pattern is indexed as the (002) reflection, which can be attributed to the non-crystallite components present in N-HPC. Moreover, the XRD pattern has sharp peaks at around 32°, 46° and 50°, which can be ascribed to the crystallite components in N-HPC. The crystalline structure confers good electrochemical properties to N-HPC.
Electrochemical characterization of the electrochemical sensor
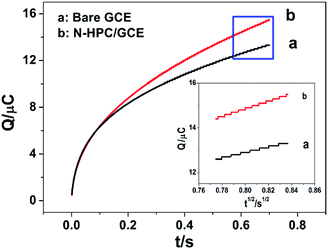
Electrochemical impedance spectroscopy (EIS) was applied to characterize the modified electrode interface. The electron transfer resistance Ret can be derived from the diameter of the semicircle in the high frequency region of the EIS spectrum;23,24 Fig. S4† shows that the Ret of the N-HPC/GCE (b) is smaller than that of bare GCE (a); this is due to the fact that N-HPC with good conductivity increases the electron transfer of [Fe3(CN)6] on the surface of the electrode.The effective surface area curves of the bare GCE and N-HPC/GCE as a function of time are shown in Fig. 3. The effective surface area of the modified electrode was determined using 1 μM K3[Fe(CN)6] as a model complex by the chrono-coulomb method. The Anson equation25 applied herein is as follows:
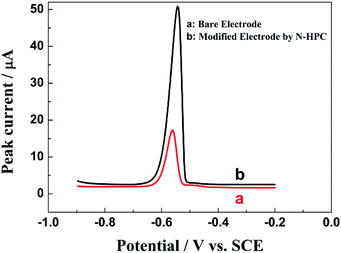
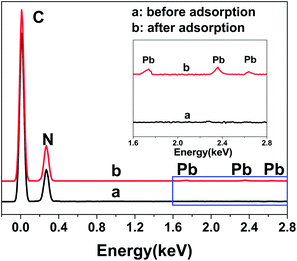
Fig. 4 shows the electrochemical behaviors of the bare electrode and N-HPC/GCE in a 0.1 M HAc–NaAc buffer solution at pH 5.0 containing 5.0 μM Pb2+. As shown, the stripping peak was observed for Pb2+ at the bare GCE (curve a). Importantly, a sharper stripping peak with obviously improved current for Pb2+ is exhibited by the N-HPC/GCE (curve b), which may be attributed to the superior effective specific surface area and satisfactory electrical conductivity of N-HPC. In addition, high density N-containing groups on N-HPC can effectively bind to Pb2+, as confirmed by EDX. As shown in Fig. 5, the C and N peaks were obviously detected in the EDX spectrum of N-HPC before and after its interaction with Pb2+. The magnified images (curve b) show additional distinct Pb peaks at 1.74 keV, 2.36 keV and 2.63 keV for N-HPC after the adsorption of Pb2+, which indicate that the N-HPC-modified GCE has successfully adsorbed Pb2+.
Optimization of the experimental parameters
The influence of the pH value on the stripping peak current was investigated in the range of 3.0–8.0 by DPASV in the HAc–NaAc buffer solution containing 1.0 mM Pb2+. Fig. 6a demonstrates that the peak current of Pb2+ increases as the pH increases from 3.0 to 5.0; this may be due to strong complexation between the NH2− groups from N-HPC and Pb2+.26 When the pH was further increased to 8.0, the peak current conversely decreased; this could be attributed to the precipitation of Pb(OH)2 from the solution.8 Therefore, the HAc–NaAc buffer solution pH of 5.0 was selected as the optimal condition in this study.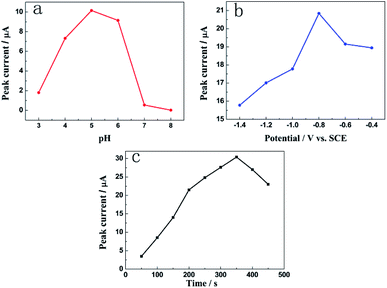 | ||
| Fig. 6 The effects of (a) the pH of the acetate buffer solution; (b) deposition potential; and (c) deposition time on the current signal of Pb2+. | ||
The effect of deposition potential on the stripping peak currents of Pb2+ at the deposition time of 300 s was investigated between −0.4 and −1.4 V vs. the SCE. Fig. 6b reveals that the peak current of Pb2+ improves remarkably as the deposition potential shifts from −0.4 V to −0.8 V. As the deposition potential shifts to more negative values, the peak current decreases due to hydrogen evolution.27 Hence, −0.8 V was chosen as the best deposition potential.
The effect of accumulation time on the stripping peak current of Pb2+ was studied at the deposition potential of −0.8 V. As shown in Fig. 6c, the peak current response increased with an increase in the deposition time from 50 to 350 s. However, after the deposition time exceeded 350 s, the peak current decreased gradually. Thus, the deposition time of 350 s was employed in the further studies taking into account the work efficiency and sensitivity of the sensor.
Analytical properties
The analytical properties of the N-HPC/GCE in the detection of Pb2+ were researched using DPASV under the optimal conditions. Fig. 7a demonstrates the peak current responses to Pb2+ at different concentrations in the 0.1 M HAc–NaAc buffer solution (pH 5.0). The anodic peak current was linearly correlated to the Pb2+ concentration in the range from 7.0 to 7000.0 nM (R2 = 0.992), as shown in Fig. 7b. The corresponding equation is indicated as I (μA) = −0.9808 + 0.00948c (nM), and the detection limit is 1.44 nM (S/N = 3).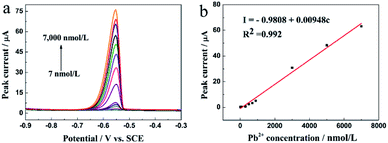 | ||
| Fig. 7 (a) DPASV responses of the N-HPC/GCE for the detection of Pb2+ at different concentrations in the 0.1 M HAc–NaAc buffer solution at pH 5.0. DPASV conditions are identical to those shown in Fig. 4; and (b) the corresponding linear calibration plots of the current signal for Pb2+. | ||
Table 1 shows a comparison of the performance of this modified electrode with those of other reported Pb2+ sensors. It can be seen that the N-HPC/GCE reported in this study has wider linear range than the previously reported materials. The detection limit of the proposed approach is lower than that of the RGO-NH-Ci/GCE and similar to that of TAPB-DMTP-COF/CPE. In addition, compared with TAPB-DMTP-COF/CPE, the proposed material has the advantages of easier preparation and lower cost. Moreover, N-HPC as the modification material of this sensor has a controllable and reproducible morphology, which can provide stability and sensitivity. Hence, the N-HPC/GCE is strongly expected to be used as a valid working electrode for Pb2+ detection.
| Electrode | Method | Liner range (nM) | Determination limit (nM) | Reference |
|---|---|---|---|---|
| a Poly(DTCPA)/GCE: poly(7,9-dithiophene-2yl-8H-cyclopenta[a] acenaphthalene-8-one)-modified GCE.b SWASV: square-wave adsorptive stripping voltammetry.c TAPB-DMTP-COF/CPE: 1,3,5-tris(4-aminophenyl)benzene-2,5-dimethoxyterephaldehyde-covalent organic framework-modified carbon paste electrode.d Mn(TPA)-SWCNTs/GCE: manganese-terephthalic acid MOF/single-walled carbon nanotube modified GCE.e L-cys-RGO/GCE: L-cysteine-reduced graphene oxide-modified GCE. | ||||
| Poly(DTCPA)/GCEa | SWASVb | 100–1000![[thin space (1/6-em)]](https://www.rsc.org/images/entities/char_2009.gif) 000 000 |
— | 28 |
| TAPB-DMTP-COF/CPEc | DPASV | 5–2000 | 1.9 | 8 |
| Mn(TPA)-SWCNTs/GCEd | DPASV | 100–14![[thin space (1/6-em)]](https://www.rsc.org/images/entities/char_2009.gif) 000 000 |
38 | 29 |
| L-cys-RGO/GCEe | DPASV | 400–1200 | 1.04 | 30 |
| RGO-NH-Ci/GCE | DPASV | 5–1200, 1200–10![[thin space (1/6-em)]](https://www.rsc.org/images/entities/char_2009.gif) 000 000 |
3.0 | 9 |
| N-HPC/GCE | DPASV | 7–7000 | 2.0 | This work |
Repeatability, reproducibility, stability and interference
To certify the repeatability, reproducibility and stability of the N-HPC/GCE, 5.0 μM Pb2+ was successively detected using the same electrode. After 10 continuous measurements, the relative standard deviation (RSD) of the N-HPC/GCE repeatability was 2.5%, as shown in Fig. S5A.† The reproducibility was examined using five different N-HPC/GCEs treated with the same method; the RSD of 3.2% for the N-HPC/GCE was determined based on Fig. S5B.† These results demonstrate that the designed sensor has good reliability. In addition, to assess the long-term stability of the N-HPC/GCE, 5.0 μM Pb2+ was measured after 15 days of storage in air. The current signal change in response to Pb2+ is less than 4%, indicating that the modified electrode has an excellent stability.The anti-interference properties of different interfering substances in the HAc–NaAc buffer solution containing 5.0 μM Pb2+ were tested. From Fig. S5C,† it is found that the current signal change relative to the original signal for Pb2+ is within ±5.0%, which proves that 50-fold Co2+, Ni2+, Ca2+, Mg2+, Zn2+, Mn2+, and Al3+, 20-fold Cd2+, and 10-fold Hg2+ and Cu2+ have no effect on the determination of Pb2+. These results suggest that the N-HPC/GCE material has excellent selectivity that may be due to the high binding affinity of the NH2− groups towards Pb2+.
Actual sample analysis
The sensor containing the N-HPC/GCE electrode was used to analyze Pb2+ in actual samples for testing its feasibility and validity. The waste water was filtered with a standard 0.45 μm filter, and the pH value was adjusted to 5.0 with the HAc–NaAc buffer solution before determination. Table 2 shows the Pb2+ recovery results in wastewater achieved using the N-HPC/GCE electrode by the standard addition method to assess the preciseness of the developed sensor. The Pb2+ recovery was determined to be between 96.8% and 100.4% by spiking the samples at three concentration levels (50 nM, 100 nM and 150 nM). The results demonstrate the accuracy of the prepared sensor for Pb2+ determination in actual samples.| Spiked (nM) | Founded (nM) | Recovery (%) |
|---|---|---|
| 0 | 24.8 | — |
| 50 | 73.2 | 96.8 |
| 100 | 125.2 | 100.4 |
| 150 | 171.6 | 97.9 |
Conclusions
In this study, a new electrochemical sensor was developed for the detection of Pb2+ based on nitrogen-doped hierarchical porous carbon (N-HPC), which was easily obtained by calcination of gelatin-based microcapsules with good repeatability and controllability. The N-HPC/GCE material presented a good linear response to the Pb2+ concentrations ranging from 7 nM to 7000 nM with the detection limit of 1.44 nM. The excellent sensitivity of the obtained method can be ascribed to the strong Pb2+ coordinating ability of the N atoms and large surface area of the N-HPC. In addition, the N-HPC-modified GCE exhibited good repeatability, reproducibility, stability, and selectivity and was successfully applied to the detection of Pb2+ in actual samples. These results suggested that the N-HPC/GCE electrochemical sensor might be a prospective candidate for the environmental monitoring of Pb2+.Conflicts of interest
There are no conflicts to declare.Acknowledgements
This research was financially supported by the National Natural Science Foundation of China (Grant No. 21304039); the Science & Technology Program of Jiangxi Province (Grant No. 2013BAB213014); and the Department of Education Science & Technology Program of Jiangxi Province (Grant No. GJJ150405); Natural Science Foundation of Nanchang City (No. 2018CXTD014).References
- W. Kang, X. Pei, C. A. Rusinek, A. Bange, E. N. Haynes, W. R. Heineman and I. Papautsky, Anal. Chem., 2017, 89, 3345–3352 CrossRef CAS PubMed.
- M. A. Moreno, JAMA Pediatr., 2018, 172, 204 CrossRef PubMed.
- W. H. Organization, Guidelines for drinking-water quality, WHO Press, Geneva, Switzerland, 4th edn, 2011 Search PubMed.
- V. Kazantzi, A. Kabir, K. G. Furton and A. Anthemidis, Microchem. J., 2018, 137, 285–291 CrossRef CAS.
- A. A. Krata, M. Wojciechowski, M. Kalabun and E. Bulsk, Microchem. J., 2018, 142, 36–42 CrossRef CAS.
- S. Tanikkul, J. Jakmune, S. Lapanantnoppakhun, M. Rayana-korn, P. Sooksamiti, R. E. Synovec, G. D. Christian and K. Grudpan, Talanta, 2004, 64, 1241–1246 CrossRef CAS PubMed.
- Y. Ma, H. Liu, K. Qian, L. Yang and J. Liu, J. Colloid Interface Sci., 2012, 386, 451–455 CrossRef CAS PubMed.
- T. Zhang, C. Gao, W. Huang, Y. Chen, Y. Wang and J. Wang, Talanta, 2018, 188, 578–583 CrossRef CAS PubMed.
- H. Xing, J. Xu, X. Zhu, X. Duan, L. Lu, Y. Zuo, Y. Zhang and W. Wang, J. Electroanal. Chem., 2016, 782, 250–255 CrossRef CAS.
- L. Yua, Q. Zhang, B. Yang, Q. Xua, Q. Xub and X. Hu, Sens. Actuators, B, 2018, 259, 540–551 CrossRef.
- S. Wu, Q. He, C. Tan, Y. Wang and H. Zhang, Small, 2013, 9, 1160–1172 CrossRef CAS PubMed.
- H. Xing, J. Xu, X. Zhu, X. Duan, L. Lu, W. Wang, Y. Zhang and T. Yang, J. Electroanal. Chem., 2016, 760, 52–58 CrossRef CAS.
- A. T. E. Vilian, J. Y. Song, Y. S. Lee, S.-K. Hwang, H. J. Kim, Y.-S. Jun, Y. S. Huh and Y.-K. Han, Biosens. Bioelectron., 2018, 117, 597–604 CrossRef CAS PubMed.
- L. Wang, Q. Zhang, S. Chen, F. Xu, S. Chen, J. Jia, H. Tan, H. Hou and Y. Song, Anal. Chem., 2014, 86, 1414–1421 CrossRef CAS PubMed.
- N. Qiu, Y. Liu and R. Guo, Electrochim. Acta, 2016, 212, 147–154 CrossRef CAS.
- W. Deng, X. Yuan, Y. Tan, M. Ma and Q. Xie, Biosens. Bioelectron., 2016, 85, 618–624 CrossRef CAS PubMed.
- M. J. Liu, F. Wei, X. M. Yang, S. A. Dong, Y. J. Li and X. J. He, New Carbon Mater., 2018, 33, 316–323 CrossRef.
- L. L. Shen, J. P. Chen, Y. J. Bai, Z. C. Ma, J. Huang and W. Feng, J. Food Sci., 2016, 81, 2258–2262 CrossRef PubMed.
- X. Yang, N. Gao, L. Hu, J. Li and Y. Sun, J. Food Eng., 2014, 161, 87–93 CrossRef.
- R. Y. Dai, S. Y. You, L. M. Lu, Q. Liu, Z. X. Li, L. Wei, X. G. Huang and Z. Y. Yang, Colloids Surf., A, 2017, 530, 13–19 CrossRef CAS.
- E. Duhoranimana, E. Karangwa, L. Lai, X. Xu, J. Yu, S. Xia, X. Zhang, B. Muhoza and I. Habinshuti, Food Hydrocolloids, 2017, 69, 111–120 CrossRef CAS.
- R. Y. Dai, G. Wu, W. G. Li, Q. A. Zhou, X. H. Li and H. Z. Chen, Colloids Surf., A, 2010, 362, 84–89 CrossRef CAS.
- Y. Qian, C. Wang and F. Gao, Biosens. Bioelectron., 2015, 63, 425–431 CrossRef CAS PubMed.
- Y. Qian, D. Tang, L. Du, Y. Zhang, L. Zhang and F. Gao, Biosens. Bioelectron., 2015, 64, 177–181 CrossRef CAS PubMed.
- F. C. Anson, Anal. Chem., 1964, 36, 932–934 CrossRef CAS.
- H. Xu, J. Gao and D. Jiang, Nat. Chem., 2015, 7, 905–912 CrossRef CAS PubMed.
- A. Afkhami, H. Bagheri, H. Khoshsafar, M. Saber-Tehran, M. Tabatabaee and A. Shirzadmehr, Anal. Chim. Acta, 2012, 746, 98–106 CrossRef CAS PubMed.
- P. Kumar, S. Saravanan, K. Ranjith and P. C. Ramamurthy, J. Appl. Electrochem., 2014, 44, 133–139 CrossRef CAS.
- F. Cai, Q. Wang, X. Chen, W. Qiu, F. Zhan, F. Gao and Q. Wang, Biosens. Bioelectron., 2017, 98, 310–316 CrossRef CAS PubMed.
- S. Muralikrishna, K. Sureshkumar, T. S. Varley, D. H. Nagaraju and T. Ramakrishnappa, Anal. Methods, 2014, 6, 8698–8705 RSC.
Footnote |
| † Electronic supplementary information (ESI) available. See DOI: 10.1039/c9ra02270h |
| This journal is © The Royal Society of Chemistry 2019 |

