 Open Access Article
Separating graphene quantum dots by lateral size through gel column chromatography†
Wentian Wua,
Jiamin Caob,
Min Zhonga,
Haixia Wua,
Fangwei Zhanga,
Jingyan Zhangb and
Shouwu Guo *a
*a
aDepartment of Electronic Engineering, School of Electronic Information and Electrical Engineering, Shanghai Jiao Tong University, Shanghai 200240, P. R. China. E-mail: swguo@sjtu.edu.cn
bState Key Laboratory of Bioreactor Engineering, Shanghai Key Laboratory of New Drug Design, School of Pharmacy, East China University of Science and Technology, Shanghai 200237, P. R. China
First published on 17th June 2019
Abstract
Graphene quantum dots (GQDs) prepared through photo-Fenton reaction of graphene oxide are separated via gel column chromatography. The as-separated GQDs were selectively introduced into the active layer of organic solar cells and achieved an enhancement of power conversion efficiency (PCE).
Graphene quantum dots (GQDs) show potential applications in photovoltaic devices, bio-probers, sensors, and catalysts.1–6 As the properties of GQDs can be affected severely by their lateral sizes and size distributions,7,8 to acquire GQDs with controlled size and narrow distribution is prerequisite. However, GQDs prepared directly by the methods developed so far usually assume wide size distribution which limits somehow the practical applications of GQDs.2,9–12
Recently, several protocols have been developed for post separation of GQDs, such as dialysis,13 ultrafiltration,14 gel electrophoresis,8 reverse micelle methods,15 column chromatography on silica16 or Sephadex G-25 gel,17 chromatographic separation,18 and size-selective precipitation,19,20 but can't satisfy the bulk production. For examples, Kim et al. successfully obtained GQDs with different sizes using dialysis bags with different interception molecular weights and a 20 nm nanoporous membrane, but with an unacceptable yield.13 Fuyuno et al. obtained the GQDs with different fluorescence by the size-exclusion high performance liquid chromatography (HPLC).18 Jiang et al. separated the single atomic layered GQDs from reaction mixture containing double multilayer allotropes successfully through a Sephadex G-25 gel.17 In our previous work, the GQDs generated through the photo-Fenton reaction of graphene oxide (GO) have been sorted into three categories with different fluorescence by gel electrophoresis.2,8,20 Nevertheless, it is still challenging to obtain high quality GQDs with controlled size and size distribution which can satisfy the practical applications.
Herein, we describe an efficient GQDs separation procedure via Sephadex G25 gel column. The GQDs prepared through photo-Fenton reaction of GO with wide size distribution are separated into eight groups of GQDs with different size and fluorescent colours.2 The size and morphology of as-obtained GQDs were characterized by atomic force microscopy (AFM) and transmission electron microscopes (TEM) measurements. The optoelectronic properties of the GQDs were studied by photoluminescence (PL) and UV-vis absorption spectroscopy techniques. The results showed that this separating technique is very beneficial for obtaining high quality GQDs with a variety of specific sizes and properties. Finally, the as-separated GQDs were introduced into the inverted hybrid solar cells based on the poly(3-hexylthiophene) (P3HT) and poly(3-hexylthiophene)/(6,6)-phenyl-C61 butyric acid methylester (PCBM), and it is found that the solar cell containing the separated GQDs showed a higher performance than that with the raw GQDs, which verified the importance of the size separation for GQDs.
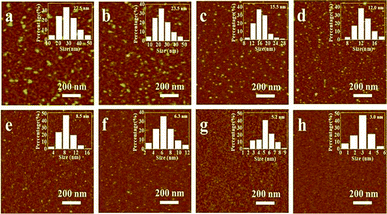
The raw GQDs used in the work are first characterized using atomic force microscopy imaging. As shown in Fig. S1a and b,† their sizes are ranged from 2 to 40 nm with obviously large size distribution, that is further confirmed by PL spectrum and image (Fig. S1c,† and the inset). Sephadex G25 gel column, one of common size exclusion column, is widely used to purify or separate protein or peptide.21 Here, GQDs are separated through Sephadex G25 gel column by size and the as-separated GQDs are named as GQDs 1–8 according to the collection order. The yield of GQDs is close to 80% with this separating technique. Actually, unlike other separating methods such as multiple dialysis13 and ultrafiltration,14 there is almost no significant loss of GQDs in our separation process. Taking the well dispersibility of as-prepared GQDs in water into consideration, we selected water as developing solvent in this work. Their morphologies, size and size distributions are revealed by AFM imaging and the results are shown in Fig. 1. The average size of GQDs 1–8 (calibrated with the parameters of AFM tip deconvolution8) are of 27.5, 23.5, 15.5, 12.0, 8.5, 6.3, 5.2 and 3.0 nm, respectively, with narrow size distributions (see the as-inset histograms in Fig. 1). As shown in Fig. S2,† the sizes of GQDs 1–8 are also measured by TEM imaging, which are in agreement with the AFM images.
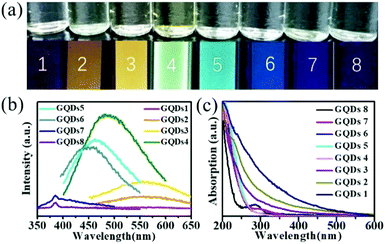
The PL and UV-vis spectra of the GQDs can reflect the size difference, too.7,8,13,18 The top row of Fig. 2a shows the optical images of the GQDs 1–8 acquired under a daylight lamp, and they were all transparent. The bottom row of Fig. 2a shows the optical images of the corresponding GQDs 1–8 observed under a UV irradiation (302 nm), illustrating that the GQDs 1–8 have fluorescence properties, which are red, orange, yellow, green, cyan, light blue, blue, and purple, respectively. In contrast to the raw GQDs, the result indicates that the GQDs are successfully separated by size through Sephadex G-25 gel column. This should be beneficial for further exploring the relationship between the size and properties of GQDs. As shown in Fig. 2b, the PL spectra of GQDs 1–8 match well with the fluorescence photos. The peak wavelengths of their PL are 587, 565, 554, 483, 462, 452, 385, 384 nm, correspondingly.
As shown in Fig. 2c, with the size decreasing, the absorption onset of the GQDs blue-shifted gradually. The absorption around 225 nm corresponding to the π → π* transition of sp2 domains in GQDs, and the absorption in the range of 275–325 nm from the n → π* transition of C![[double bond, length as m-dash]](https://www.rsc.org/images/entities/char_e001.gif) O groups at the edge of GQDs are also observed clearly, which is similar to the literature.8 More specifically, the absorption peak in the range of 275–325 nm becomes more and more obvious with the GQDs size decreasing, indicating the density of carboxylic groups at the edge of GQDs increases from GQDs-1/red to GQDs-8/purple. The reason is that the number of GQD carboxylic groups is directly proportional to its lateral size and the area of GQDs is proportional to the square of its size, as a result the small sized GQDs have higher density of carboxylic groups than the large sized GQDs and present the obvious peak around 275–325 nm.8
O groups at the edge of GQDs are also observed clearly, which is similar to the literature.8 More specifically, the absorption peak in the range of 275–325 nm becomes more and more obvious with the GQDs size decreasing, indicating the density of carboxylic groups at the edge of GQDs increases from GQDs-1/red to GQDs-8/purple. The reason is that the number of GQD carboxylic groups is directly proportional to its lateral size and the area of GQDs is proportional to the square of its size, as a result the small sized GQDs have higher density of carboxylic groups than the large sized GQDs and present the obvious peak around 275–325 nm.8
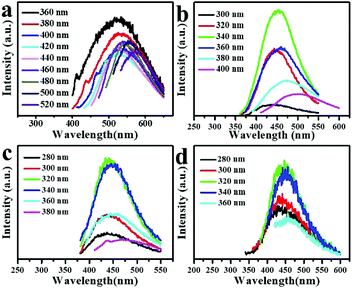
The PL spectra of the as-separated GQDs are shown in Fig. 3 and Fig. S3.† Comparably, the PL intensities of GQDs 3, GQDs 4, GQDs 5, GQDs 6 (Fig. 3) are stronger than those of others (Fig. S3†). The PL emission peaks of the GQDs 3 and GQDs 4 shift more obviously than that of GQDs 5 and GQDs 6 with the increase of the excitation wavelength, implying the size distributions of GQDs 3 and GQDs 4 are worse than those of GQDs 5 and GQDs 6. For GQDs 3, as shown in Fig. 3a, there are two peaks in the emission spectra with the excitation wavelength of 360, 380, 400 nm. The left peak is attributed to the π* → n transition of carbonyl or carboxylic and the right peak is attributed to the sp2 domains in carbon skeleton. For GQDs 4, as displayed in Fig. 3b, with the excitation wavelength increasing from 300 to 400 nm, the main contribution for the PL is still the sp2 domains in carbon skeleton. With the excitation wavelength of 380, 400 nm, two slight shoulders occur in the emission spectra, the left is attributed to the π* → n transition of carbonyl or carboxylic, too. With the decreasing of GQDs size, the PL intensity from the sp2 domains gets weak, but the one of π* → n transition increases. The emission peaks of GQDs 5 and GQDs 6 shift slightly (Fig. 3c and d), which is mainly attributed to the π* → n transition of carbonyl or carboxylic, but partly from the sp2 domains in carbon skeleton.8,22
The PL quantum yields (QYs) of raw and separated GQDs are measured using quinine sulfate as a reference (QY = 57.7%),3,23 and are summarized in Table S1.† The QYs of the raw GQDs and GQDs 1–8 are 0.99, 0.611, 0.758, 2.592, 5.905, 1.816, 0.486, 0.259, and 0.199%, respectively. Obviously, the QYs of GQDs 3, GQDs 4, and GQDs 5 are much higher than those of others, but the QYs of GQDs 1, GQDs 2, GQDs 6, GQDs 7, and GQDs 8 are much lower than that of the raw GQDs. This may be resulted from the comprehensive factors from the quantum confinement effect, and the functional groups on the edge of GQDs.
In fact, the size and surface functionality of the raw GQDs are the key factors dominating Sephadex G25 gel column separation efficiency. By simply varying the photo-Fenton reaction time, different raw GQDs are prepared. Accordingly, as shown in Fig. S4,† GQDs assuming different fluorescent colours can be obtained. When the photo-Fenton reaction time was 90 minutes, big sized GQDs with yellow and orange fluorescence can be rarely obtained. Only blue and cyan fluorescence GQDs could be separated using G25 gel chromatography (Fig. S5†). It can be concluded that the separating extent is seriously depended on the size and surface functionality of GQDs as-obtained via photo-Fenton reaction. Similarly, only the GQDs with blue fluorescence could be separated from the raw material of GQDs prepared by hydrothermal method4 using G25 gel chromatography. Recently, various GQDs prepared by reported methods are mono-fluorescence such as blue or green and they are not suitable for the suggested separating technique.24–26 Thus, the suggested separating technique is not universal for GQDs obtained via different preparing methods.
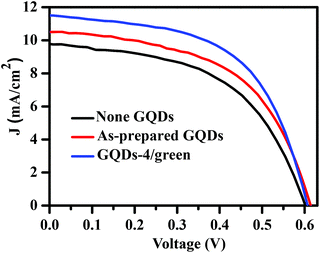
In order to explore the advantages of the as-separated GQDs, raw GQDs and GQDs 4 with the highest QY are used as additivity for the electron acceptor material PCBM, and inverted structure organic ternary hybrid solar cells (Ag/MoO3/P3HT:PCBM:GQDs/ZnO/ITO) were assembled. The photovoltaic performances of as-fabricated solar cells were characterized, and the results are depicted in Fig. 4 and Table S2.† The power conversion efficiencies (PCEs) of the solar cells containing raw GQDs and GQDs 4 are of 3.46% and 3.91%, respectively, which are higher than that of the control group (3.07%). Further, the performance of the solar cell with GQDs 4 is even better than that with raw GQDs, which means that the size and size distribution are crucial to the optoelectronic performances. However, the detailed mechanism of the photovoltaic performances of the as-assembled inverted structure organic ternary hybrid solar cells are not clear for us at moment, and will be further addressed in our coming work.
 | ||
| Fig. 4 J–V characteristics of the solar cells based on P3HT:PCBM:GQDs active layers with different GQDs. | ||
Conclusions
In summary, GQDs generated through photo-Fenton reaction of GO are separated by size through gel column chromatography. Specifically, eight categories GQDs with average size of 27.5, 23.5, 15.5, 12.0, 8.5, 6.3, 5.2, 3.0 nm, respectively, are obtained and their photoelectronic properties are studied systematically. Inverted structure organic ternary hybrid solar cells were assembled with raw and as-separated GQDs as additivities in the active layer, and found the solar cell containing GQDs 4 shows relatively higher the PCEs (3.91%). This verifies the importance of the size and size distribution of GQDs to their properties. This separation method provides a simple and fast way to obtain GQDs of specific sizes for device applications.Conflicts of interest
There are no conflicts to declare.Acknowledgements
We thank the National Science Foundation of China (No. 21376148), for financial support of this work. The authors also wish to express their appreciation to the Instrumental Analysis Center of SJTU.Notes and references
- J. Shen, Y. Zhu, X. Yang and C. Li, Chem. Commun., 2012, 48, 3686–3699 RSC
.
- X. Zhou, Y. Zhang, C. Wang, X. Wu, Y. Yang, B. Zheng, H. Wu, S. Guo and J. Zhang, ACS Nano, 2012, 6, 6592–6599 CrossRef CAS PubMed
.
- H. Sun, N. Gao, L. Wu, J. Ren, W. Wei and X. Qu, Chemistry, 2013, 19, 13362–13368 CrossRef CAS PubMed
.
- S. Paulo, E. Palomares and E. Martinez-Ferrero, Nanomaterials, 2016, 6, 1–20 CrossRef PubMed
.
- L. Lin, X. Song, Y. Chen, M. Rong, T. Zhao, Y. Jiang, Y. Wang and X. Chen, Nanoscale, 2015, 7, 15427–15433 RSC
.
- Y. Li, Y. Hu, Y. Zhao, G. Shi, L. Deng, Y. Hou and L. Qu, Adv. Mater., 2011, 23, 776–780 CrossRef CAS PubMed
.
- S. Zhu, Y. Song, J. Wang, H. Wan, Y. Zhang, Y. Ning and B. Yang, Nano Today, 2017, 13, 10–14 CrossRef CAS
.
- F. Zhang, F. Liu, C. Wang, X. Xin, J. Liu, S. Guo and J. Zhang, ACS Appl. Mater. Interfaces, 2016, 8, 2104–2110 CrossRef CAS PubMed
.
- D. Pan, J. Zhang, Z. Li and M. Wu, Adv. Mater., 2010, 22, 734–738 CrossRef CAS PubMed
.
- S. Zhu, J. Zhang, C. Qiao, S. Tang, Y. Li, W. Yuan, B. Li, L. Tian, F. Liu and R. Hu, Chem. Commun., 2011, 47, 6858–6860 RSC
.
- L. A. Ponomarenko, F. Schedin, M. I. Katsnelson, R. Yang, E. W. Hill, K. S. Novoselov and A. K. Geim, Science, 2008, 320, 356–358 CrossRef CAS PubMed
.
- J. Lu, P. S. E. Yeo, C. K. Gan, P. Wu and K. P. Loh, Nat. Nanotechnol., 2011, 6, 247 CrossRef CAS PubMed
.
- S. Kim, S. W. Hwang, M.-K. Kim, D. Y. Shin, D. H. Shin, C. O. Kim, S. B. Yang, J. H. Park, E. Hwang, S.-H. Choi, G. Ko, S. Sim, C. Sone, H. J. Choi, S. Bae and B. H. Hong, ACS Nano, 2012, 6, 8203–8208 CrossRef CAS PubMed
.
- Q. Xue, H. Huang, L. Wang, Z. Chen, M. Wu, Z. Li and D. Pan, Nanoscale, 2013, 5, 12098–12103 RSC
.
- W. Kwon and S.-W. Rhee, Chem. Commun., 2012, 48, 5256–5258 RSC
.
- S. Zhu, J. Zhang, X. Liu, B. Li, X. Wang, S. Tang, Q. Meng, Y. Li, C. Shi, R. Hu and B. Yang, RSC Adv., 2012, 2, 2717–2720 RSC
.
- F. Jiang, D. Chen, R. Li, Y. Wang, G. Zhang, S. Li, J. Zheng, N. Huang, Y. Gu, C. Wang and C. Shu, Nanoscale, 2013, 5, 1137–1142 RSC
.
- N. Fuyuno, D. Kozawa, Y. Miyauchi, S. Mouri, R. Kitaura, H. Shinohara, T. Yasuda, N. Komatsu and K. Matsuda, Adv. Opt. Mater., 2014, 2, 983–989 CrossRef CAS
.
- E. Lee, J. Ryu and J. Jang, Chem. Commun., 2013, 49, 9995–9997 RSC
.
- J. Liu, F. Zhang, F. Liu, H. Liu, J. Zhang and S. Guo, Eur. J. Inorg. Chem., 2017, 2017, 2201–2206 CrossRef CAS
.
- A. Sila and A. Bougatef, J. Funct. Foods, 2016, 21, 10–26 CrossRef CAS
.
- L. Cao, M. J. Meziani, S. Sahu and Y.-P. Sun, Acc. Chem. Res., 2013, 46, 171–180 CrossRef CAS PubMed
.
- H. Sun, L. Wu, N. Gao, J. Ren and X. Qu, ACS Appl. Mater. Interfaces, 2013, 5, 1174–1179 CrossRef CAS PubMed
.
- P. Yang, L. Zhou, S. Zhang, N. Wan, W. Pan and W. Shen, J. Appl. Phys., 2014, 116, 244306 CrossRef
.
- Y. Dong, J. Shao, C. Chen, H. Li, R. Wang, Y. Chi, X. Lin and G. Chen, Carbon, 2012, 50, 4738–4743 CrossRef CAS
.
- J. Gu, M. J. Hu, Q. Q. Guo, Z. F. Ding, X. L. Sun and J. Yang, RSC Adv., 2014, 4, 50141–50144 RSC
.
Footnote |
| † Electronic supplementary information (ESI) available. See DOI: 10.1039/c9ra03623g |
| This journal is © The Royal Society of Chemistry 2019 |


