 Open Access Article
An eco-friendly route for template-free synthesis of high specific surface area mesoporous CeO2 powders and their adsorption for acid orange 7†
Yaohui Xua,
Ruixing Li *b and
Yang Zhou*c
aSchool of Physics and Electronic Engineering, Laboratory for Functional Materials, Leshan Normal University, Leshan, Sichuan 614004, China
bKey Laboratory of Aerospace Materials and Performance (Ministry of Education), School of Materials Science and Engineering, Beihang University, Beijing 100191, China
cSchool of Textile Science and Engineering, National Engineering Laboratory for Advanced Yarn and Clean Production, Wuhan Textile University, Wuhan, 430200, China
First published on 18th July 2019
Abstract
An eco-friendly route was developed for the synthesis of mesoporous CeO2 powders without any additional template. The original cerium precursors were separated from Ce3+ aqueous solution by (NH4)2CO3 or Na2CO3 via a chemical precipitation method, then H2O2 was introduced to induce the phase transformation from original cerium precursors to CeO2 precursors with initial porous structures, finally the crystallinities of CeO2 precursors were improved by a hydrothermal treatment, meanwhile the mesoporous structures of final CeO2 powders were formed. The BET surface areas of mesoporous CeO2 powders synthesized using (NH4)2CO3 and Na2CO3 as precipitants were 106.1 and 76.9 m2 g−1, respectively. Moreover, a mesoporous CeO2 sample with BET surface area of 100.0 m2 g−1 was also synthesized using commercial Ce2(CO3)3·xH2O as an existing cerium precursor under the same conditions as control, which could shorten experimental processes and reduce costs. The oxidation-induced phase transformation from original cerium precursors to CeO2 precursors with initial porous structures was the precondition for further forming of mesoporous structures of final CeO2 powders during the hydrothermal process. These mesoporous CeO2 powders showed the rapid and effective adsorption for acid orange 7 dye from simulated wastewater without pH pre-adjustment at room temperature. Furthermore, the adsorption capacities of these mesoporous CeO2 powders for removal of acid orange 7 dye were determined according to the Langmuir linear fits.
Introduction
Acid orange 7 (AO7) dye is one of the most common synthetic dyes in various industries ranging from dyeing to printing.1–3 AO7 is considered toxic and could cause harmful health effects to human and aquatic organisms, such as skin diseases and carcinogenesis.4,5 Moreover, it is difficult to biologically degrade AO7 in wastewaters because of its recalcitrant azo bond with an aromatic structure.6 Therefore, it is essential to treat the industrial wastewaters containing AO7.7–9 To date, many approaches have been conducted to control organic pollutants, such as biodegradation,10–12 photooxidation,13,14 chemical oxidation,15–17 electrochemistry,18,19 ultrasonic destruction20,21 and adsorption.22–24 Among these techniques, adsorption using adsorbents is considered to be one of the most convenient and cost-efficient methods.25 Huang et al. prepared a nitrilotriacetic acid anhydride modified ligno-cellulosic bio-adsorbent for removal of Cd2+ and Pb2+, the maximum sorption capacities for Cd2+ and Pb2+ could reach 143.4 and 303.5 mg g−1 at 298.0 K, respectively.26 Lu et al. reported the removal of acenaphthene by biochar and raw biomass, and investigated the effects of coexisting metal ions and organic compounds on their sorption performances.27 Moreover, Wu et al. reviewed the role of biochar on composting of organic wastes and remediation of contaminated soils.28 The mesoporous ceria (CeO2) can serve as a promising candidate for removal of AO7 because of its high specific surface area and well-defined pore topology.Generally, mesoporous CeO2 powders are prepared by template methods with either surfactants as soft templates29,30 or other porous material as hard templates.31,32 However, the template methods require either additional procedures or high energy consumption in order to eliminate the hard or soft sacrificial templates, such as dissolution or heat treatment.33–35 Moreover, the crystallinity of mesoporous CeO2 even needs to be improved again by calcination, which easily causes the collapse of pore structures and thus reduces the specific surface area of CeO2.36 To date, there are limited reports for template-free synthesis of CeO2 powders with mesoporous structures. For example, Wei et al. fabricated mesoporous CeO2 nanoflowers with a BET surface area (SBET) of 95.7 m2 g−1, however, polyvinylpyrrolidone (PVP) was introduced as a structure-directing agent to synthesize Ce(HCOO)3 precursor in alcoholic solution, in which formic acid and ammonia solution were also added. Then, hydrogen peroxide was introduced as an oxidant to induce the phase transformation from Ce(HCOO)3 to CeO2 with inherited morphology. Finally, mesoporous CeO2 nanoflowers were obtained by following solvothermal treatment at 150 °C for 6 h and drying at 70 °C for 10 h.37 In another study, Xie et al. reported a template-free hydrothermal synthesis of flower-like CeO2 powders, and its SBET was 38.8 m2 g−1. The potassium chlorate and dimethyl formamide were employed, and the interaction effect of them played an important role in the formation of flower-like CeO2.38 Moreover, He et al. synthesized mesoporous CeO2 colloidal spheres by the assembly of CeO2 nanoparticles and nanocubes, respectively. The SBET of mesoporous CeO2 colloidal spheres assembled by nanoparticles and nanocubes were 114.3 and 122.5 m2 g−1, respectively. The whole process could be divided into three steps: the CeO2 nanoparticles and nanocubes were first synthesized by a hydrothermal method and CO-assisted hydrothermal approach, respectively. Then, the CeO2 nanocrystals self-assembled into colloidal spheres via an emulsion-based bottom-up self-assembling method. Finally, the colloidal spheres were obtained after following drying at 70 °C and calcination at 350 °C for 4 h.39 From the above, one sample, mild, low-cost and environment-friendly route for template-free synthesis of mesoporous CeO2 powders is desirable.
In the previous work, we presented a combined bottom-up and top-down route for template-free synthesis of mesostructured CeO2 particles using Ce(NO3)3·6H2O (cerium source), NH4HCO3 (precipitant), H2O2 (oxidant) and H2O (solvent) as starting reagents, and its specific surface area was 166.5 m2 g−1.40 In this work, (NH4)2CO3 or Na2CO3 was employed in place of NH4HCO3 as a precipitant for separation of cerium precursors from Ce3+ aqueous solution. As an expansive research, commercial Ce2(CO3)3·xH2O powders were used as an existing precursor for synthesis of mesoporous CeO2 powders. The roles of H2O2 were discussed, and the effects of calcination on the grain sizes and SBET of mesoporous CeO2 powders were investigated. Additionally, the absorption characteristics of these mesoporous CeO2 powders for AO7 dye were investigated.
Furthermore, it is worth noting that the mesoporous CeO2 powders were synthesized in this work just using (NH4)2CO3, Na2CO3, H2O2 and H2O without any additional reagent and post-treatment. (NH4)2CO3, Na2CO3 and H2O2 are accessible, cheap and safe chemistry reagents, which not only can save the cost, but also reduce the pollution degree to environment. Moreover, the route, using commercial Ce2(CO3)3·xH2O as an existing precursor for synthesis of mesoporous CeO2 powders, can shorten experimental processes and reduce costs.
Experimental
Materials
Cerium nitrate hexahydrate (Ce(NO3)3·6H2O, 99.95%), ammonium carbonate ((NH4)2CO3, 99.999%), sodium carbonate (Na2CO3, 99.5%), hydrogen peroxide (H2O2, 30 wt%) and commercial cerium carbonate hydrate (Ce2(CO3)3·xH2O, 99.9%) were supplied by Aladdin Co. Ltd. Acid orange 7 (AO7, >97.0%) was obtained from Tokyo Chemical Industry Co. Ltd.Synthesis of mesoporous CeO2 powders
As shown in Fig. 1, firstly, the original cerium precursors were separated from Ce3+ aqueous solution by (NH4)2CO3 or Na2CO3 via a chemical precipitation method. Typically, 4 mmol Ce(NO3)3·6H2O was dissolved into 28 mL distilled water to form a clear Ce3+ solution, and 16 mmol precipitant ((NH4)2CO3 or Na2CO3) was added to the above solution under continuous stirring, immediately forming a white precipitate (labelled as Precursor 1 and Precursor 2, respectively). Meanwhile, as an extension experiment, commercial Ce2(CO3)3·xH2O powders were used as an existing precursor. The commercial Ce2(CO3)3·xH2O powders were dispersed in 28 mL distilled water, and the subsequent experimental steps were similar to that of the suspension of Precursor 1 and Precursor 2.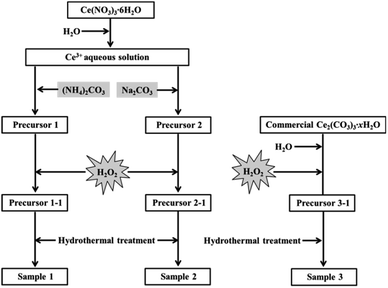 | ||
| Fig. 1 Synthesis of mesoporous CeO2 using (NH4)2CO3, Na2CO3 as precipitants, and using commercial Ce2(CO3)3·xH2O as an existing precursor in the presence of H2O2. | ||
Then, H2O2 was introduced to induce the phase transformation from original cerium precursors to CeO2 precursors. Typically, 7 mL H2O2 was added to the above suspension containing Precursor 1, Precursor 2 and commercial Ce2(CO3)3·xH2O, then stirring for 30 min and aging for 3 h. The as-prepared orange precipitates using (NH4)2CO3, Na2CO3 as precipitants and using commercial Ce2(CO3)3·xH2O as an existing precursor were labelled as Precursor 1-1, Precursor 2-1 and Precursor 3-1, respectively. Note that all operations were performed at room temperature.
The last step was the synthesis of mesoporous CeO2 powders by a hydrothermal treatment. Typically, the above CeO2 precursors in the total mother liquor were transferred into a 50 mL Teflon-lined stainless steel autoclave. After reacting at 200 °C for 24 h, the autoclave was cooled down. Then the resulting precipitates were washed with distilled water and ethanol, and dried at 60 °C for 24 h. These hydrothermally produced CeO2 powders were labelled as Sample 1, Sample 2 and Sample 3, respectively.
For comparison, the samples were synthesized under the same conditions as control, however, in the absence of H2O2. Moreover, in order to investigate the effects of calcination on the grain sizes and SBET of mesoporous CeO2, these samples (Sample 1, Sample 2 and Sample 3) were treated by following calcination at 500 °C for 2 h, and their SBET were also determined.
Characterization
The crystallographic phases of precursors and samples were characterized by X-ray diffraction (XRD, D/Max 2200PC). The microstructures of precursors and samples were evaluated by transmission electron microscopy (TEM, JEM-2100F). The specific surface areas, pore volumes and pore size distributions of mesoporous CeO2 powders were obtained from nitrogen adsorption–desorption measurements (QuadraSorb SI).Adsorption studies
About 10.3 g of AO7 powders (>97.0%) were dissolved in distilled water, and diluted to 100 mL with distilled water, the as-obtained concentration of AO7 solution was 10 g L−1. The different concentrations of AO7 solution (20–120 mg L−1) were obtained by pipetting varied volume of the above 10 g L−1 AO7 solution into 100 mL volumetric flask and bringing to volume by distilled water. Subsequently, 0.2 g CeO2 sample was dispersed into 100 mL of AO7 solution at varying initial concentrations (adsorbent dosage: 2.0 g L−1) without pH pre-adjustments. The mixture was stirred at a constant speed (200 rpm) and temperature (298.0 K). Then, 4 mL suspension was withdrawn at regular intervals and centrifuged. The absorbance of supernatant was measured using an UV-2600 spectrophotometer.The Beer–Lambert law is linear relationship between the absorbance and concentration of absorbing species.41 So, the concentration of AO7 dye can be converted from its absorbance based on Beer–Lambert law. The adsorption efficiency (η, %) and adsorption amount (q, mg g−1) for AO7 dye were calculated using eqn (1) and (2), respectively.42
 | (1) |
 | (2) |
Langmuir model as shown in eqn (3) was used to examine the adsorption characteristics of the as-obtained mesoporous CeO2 powders.43 And the saturated adsorption amount (qm, mg g−1) was obtained based on Langmuir linear fitting of adsorption isotherm curve.
 | (3) |
 | (4) |
Results and discussion
Phase characterizations of precursors
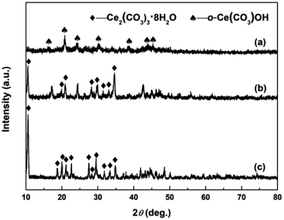
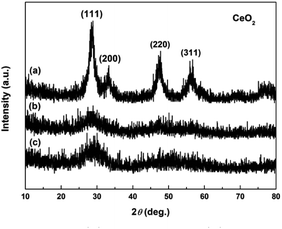
The crystallographic phases of precursors after adding the precipitant and H2O2 were determined by XRD. Fig. 2a and b show the XRD patterns of Precursor 1 and Precursor 2 obtained by adding (NH4)2CO3 and Na2CO3 to Ce3+ aqueous solution, respectively. As an verification and comparison, the XRD analysis of commercial Ce2(CO3)3·xH2O powders also were performed, and its XRD pattern was showed in Fig. 2c. As observed in Fig. 2a, the phase structure of Precursor 1 synthesized following adding (NH4)2CO3 to Ce3+ aqueous solution was o-Ce(CO3)OH (JCPDS no. 41-0013; density = 4.545 g cm−3). The XRD pattern of Precursor 2 in Fig. 2b was similar to that of commercial Ce2(CO3)3·xH2O in Fig. 2c, indicating its major phase of Ce2(CO3)3·8H2O (JCPDS no. 38-0377; density = 2.790 g cm−3). Moreover, the phase of precursor synthesized following adding NH4HCO3 to Ce3+ aqueous solution in our previous report40 was similar to that of Precursor 2 in Fig. 2b and commercial Ce2(CO3)3·xH2O in Fig. 2c. However, the difference in phase structure of original cerium precursors will subtly affect the SBET of final CeO2 samples. Interestingly, the Precursor 1 synthesized following adding (NH4)2CO3 to Ce3+ aqueous solution depended on the amount of (NH4)2CO3. When the amount of (NH4)2CO3 was less than 8 mmol, the major phase of as-obtained precursor was Ce2(CO3)3·8H2O. And the major phase structure was o-Ce(CO3)OH when the amount of (NH4)2CO3 was more than 10 mmol (see Fig. S1†).Fig. 3a–c show the XRD patterns of precursors obtained following addition of H2O2 (Precursor 1-1, Precursor 2-1 and Precursor 3-1, respectively). As observed in Fig. 3a–c, the peaks related to Ce2(CO3)3·8H2O and o-Ce(CO3)OH were no longer present. The XRD pattern of Precursor 1-1 in Fig. 3a displayed several relatively well-resolved peaks that could be indexed to the (111), (200), (220) and (311) planes of face-centred cubic CeO2 (JCPDS no. 34-0394; density = 7.215 g cm−3). The XRD pattern of Precursor 2-1 in Fig. 3b and Precursor 3-1 in Fig. 3c all showed three broad featureless peaks centred at 2θ = 29, 47 and 56°, and the broad featureless peaks centred at 2θ = 29° was more easily observed than others. Compared with the XRD pattern in Fig. 3a, the broad featureless peaks centred at 2θ = 29° in Fig. 3b and c could be indexed to the (111) plane of CeO2 phase, but with relatively low crystallinities. Combining with the XRD analyses in Fig. 2, we can derive a conclusion that H2O2 can induce the phase transformations from original cerium precursor (Ce2(CO3)3·xH2O or o-Ce(CO3)OH) to CeO2 precursor because of its oxidation.
Physical characterizations of the hydrothermally produced CeO2 powders
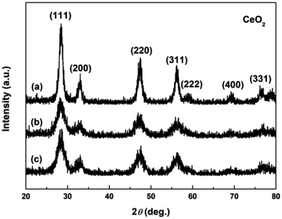
Fig. 4a–c show the XRD patterns of the hydrothermally produced CeO2 samples (Sample 1, Sample 2 and Sample 3, respectively). As observed, all the hydrothermally produced samples displayed several well-resolved peaks that indexed to the (111), (200), (220), (311), (222), (400) and (331) planes of face-centred cubic CeO2 (JCPDS no. 34-0394), and no additional phases were observed. Moreover, the crystallinities of the hydrothermally produced CeO2 in Fig. 4 were improved compared with that of the CeO2 precursors in Fig. 3, which may be attributed to the rearrangement of CeO2 grains with good crystallinities under certain temperatures and pressures during the hydrothermal process.40 Combining with the results of XRD analyses in Fig. 3, we can draw a conclusion that the crystallinities of CeO2 precursors could be improved and the pure CeO2 samples can be obtained through a hydrothermal treatment.To understand the microstructures of the hydrothermally produced CeO2 samples, TEM analyses were performed. Fig. 5a, c and e show the TEM images of the hydrothermally produced CeO2 (Sample 1, Sample 2 and Sample 3, respectively). As observed in Fig. 5a, c and e, the porous structure of CeO2 particles and the presence of pores around CeO2 grains can be observed. In addition, the grain size of Sample 1 was obviously greater than that of Sample 2 and Sample 3. The corresponding high-magnification TEM images of Sample 1, Sample 2 and Sample 3 were showed in Fig. 5b, d and f, respectively. The porous structures of these CeO2 particles could be further evidenced, and these CeO2 particles consisted of aggregated grains. Moreover, these pores resulted from these aggregated grains, and the calculated grain sizes were about 7.7, 4.3 and 4.8 nm for Sample 1, Sample 2 and Sample 3, respectively. The existence of pore structure resulted from these CeO2 particles possessing bigger specific surface area, consequently, more active sites can be provided for the adsorption of pollutants, which are beneficial to improving their capture capability.44 The grain size of CeO2 will have an impact on the pore diameter and pore volume of CeO2 powders, and then affected their SBET. Further analysis of SBET was conducted by nitrogen adsorption–desorption experiments as discussed later.
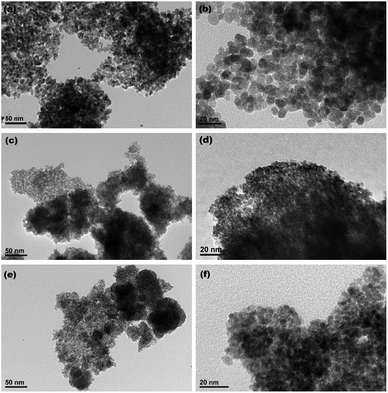 | ||
| Fig. 5 TEM images of (a) Sample 1, (c) Sample 2 and (e) Sample 3 ((b), (d) and (f) show the corresponding high-magnification TEM images, respectively). | ||
To further clarify the porous structures of the final hydrothermally produced CeO2 samples (Sample 1, Sample 2 and Sample 3, respectively), nitrogen adsorption–desorption experiments were conducted to determine their SBET, average pore sizes and pore volumes. Fig. 6a–c show the nitrogen adsorption–desorption isotherms of Sample 1, Sample 2 and Sample 3, respectively. From Fig. 6a–c, the recorded adsorption–desorption isotherms exhibited the hysteresis loops ranging from 0.4 to 1.0, suggesting their mesoporous structures.45 Furthermore, the profiles of the nitrogen adsorption–desorption isotherms were similar to that of the mesoporous CeO2 reported in previous literature.29 The insets in Fig. 6a–c show the corresponding Barrett–Joyner–Halenda (BJH) pore size distribution curves. As observed the inset in Fig. 6a and b, BJH calculations for the pore size distributions presented a single distribution centred at about 7.8 and 3.4 nm for Sample 1 and Sample 2, respectively. By contrast, the BJH pore size distribution curves of Sample 3 presented two distributions centred at about 3.8 and 5.5 nm as observed the inset in Fig. 6c.
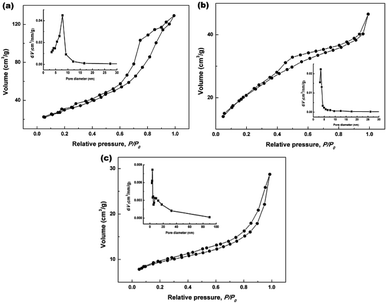 | ||
| Fig. 6 Nitrogen adsorption–desorption isotherms of (a) Sample 1, (b) Sample 2 and (c) Sample 3 (the insets in (a–c) show the corresponding BJH pore size distribution curves). | ||
The specific surface areas were determined using Brunauer–Emmett–Teller (BET) method, the average pore sizes and pore volumes were determined by BJH analysis, and these calculated textural parameters were compiled in Table 1. From Table 1, the SBET of 106.1 and 76.9 m2 g−1 were obtained for Sample 1, Sample 2 and Sample 3, respectively, which had a lower SBET than one using NH4HCO3 as a precipitant (166.5 m2 g−1) in our previous report.40 The average pore size and pore volume were 7.8 nm and 0.19 cm3 g−1 for Sample 1, while 3.4 nm and 0.05 cm3 g−1 for Sample 2. Moreover, the mesoporous CeO2 powders synthesized using commercial Ce2(CO3)3·xH2O as an existing precursor (Sample 3) showed a SBET of 100.0 m2 g−1, the average pore size and pore volume were 3.8 nm and 0.10 cm3 g−1.
| Sample | Precipitant | Existing cerium precursor | |
|---|---|---|---|
| (NH4)2CO3 | Na2CO3 | Ce2(CO3)3·xH2O | |
| Sample 1 | Sample 2 | Sample 3 | |
| SBET (m2 g−1) | 106.1 | 76.9 | 100.0 |
| Pore diameter (nm) | 7.8 | 3.4 | 3.8 |
| Pore volume (cm3 g−1) | 0.19 | 0.05 | 0.10 |
In summary, the presented route for template-free synthesis of mesoporous CeO2 powders with different SBET was feasible, in which (NH4)2CO3 or Na2CO3 as a precipitant was used to separate original cerium precursors (Ce2(CO3)3·8H2O or o-Ce(CO3)OH) from Ce3+ aqueous solution, H2O2 as an oxidant was introduced to induce the phase transformation from these original cerium precursors to CeO2 precursors, finally the mesoporous CeO2 were obtained by following hydrothermal treatment at 200 °C for 24 h. It is worth noting that (NH4)2CO3, Na2CO3 and H2O2 are common, cheap, accessible and safe chemistry reagents, which not only can save the cost, but also can reduce the pollution degree to environment. Moreover, the route, using commercial Ce2(CO3)3·xH2O as an existing precursor for synthesis of mesoporous CeO2, can shorten experimental processes and reduce costs, and the SBET of the as-obtained mesoporous CeO2 powders was 100.0 m2 g−1. Inspired by the template-free synthesis of mesoporous CeO2 powders using commercial Ce2(CO3)3·xH2O as an existing precursor, the commercial Ce(CO3)OH should be a feasible precursor for synthesis of mesoporous CeO2 powders. However, it is with great regret that the existing Ce(CO3)OH precursor cannot be obtained through purchase, so the experiment with commercial Ce(CO3)OH as an existing precursor cannot be performed. Next, the effects of H2O2 on the phase structures and microstructures of samples will be investigated.
Role of H2O2
To clarify the effects of H2O2 on the phase structures of samples, the XRD analyses of samples synthesized in the absence of H2O2 was performed. Fig. 7 shows the XRD patterns of the hydrothermally produced samples synthesized under the same conditions as control, however, in the absence of H2O2. From Fig. 7a and c, the hydrothermally produced Sample 1 and Sample 3 obtained in the absence of H2O2 showed similar XRD patterns, and both consisted of h-Ce(CO3)OH (JCPDS no. 32-0189) and CeO2 (JCPDS no. 34-0394). From Fig. 7b, the hydrothermally produced Sample 2 obtained in the absence of H2O2 consisted of Ce(CO3)2 (JCPDS no. 22-0542), h-Ce(CO3)OH and CeO2. The results of XRD analyses in Fig. 7 indicates that the pure CeO2 cannot be synthesized in the absence of H2O2, which can be attributed to the missing link of the oxidation-induced phase transformation from original cerium precursors to CeO2 precursors (see Fig. 3). In other words, the phase transformations from original cerium precursor (Ce2(CO3)3·8H2O or o-Ce(CO3)OH) to pure CeO2 cannot be achieved by depending upon the following hydrothermal treatment only. Combining the XRD results in Fig. 2–4, it further indicates that the link of addition of H2O2 acts as a relay station for CeO2 precursors from original cerium precursors that are then forwarded to the link of hydrothermal treatment for the formation of final CeO2 products.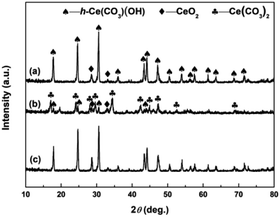 | ||
| Fig. 7 XRD patterns of (a) Sample 1, (b) Sample 2 and (c) Sample 3 synthesized in the absence of H2O2. | ||
To understand the effects of H2O2 on the microstructures of precursors obtained in the absence and presence of H2O2, TEM analyses were performed. Fig. 8a, c and e show the TEM images of Precursor 1-1, Precursor 2-1 and Precursor 3-1 synthesized in the absence of H2O2, respectively. As observed, all precursors synthesized in the absence of H2O2 were dense. In contrast, the TEM images of precursors synthesized in the presence of H2O2 in Fig. 8b, d and f revealed the porous structures. The area with lower contrast showed more and clearer pores compared to one with higher contrast, and the similar phenomenon could be observed in Fig. 5a, c and e. The formation of pore structures could be explained by the oxidation-induced phase transformation from original cerium precursor (Ce2(CO3)3·8H2O or o-Ce(CO3)OH) to CeO2 precursor that accompanied by the evolution of porous structure. It indicates that H2O2 plays a key role in the formation of initial pore structures of CeO2 precursors, which provides the precondition for the further growth of pores during the hydrothermal process (see Fig. 5).
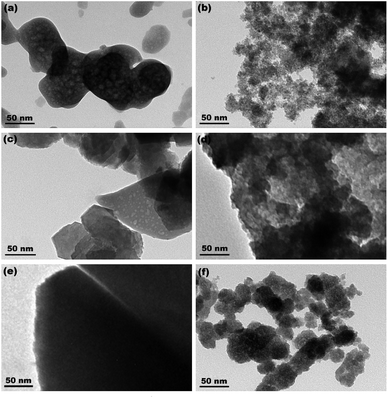 | ||
| Fig. 8 TEM images of Precursor 1-1, Precursor 2-1 and Precursor 3-1 synthesized in the absence (a, c and e) and presence (b, d and f) of H2O2. | ||
From the above, it can be found that H2O2 plays an indispensable role in the development of pure CeO2, which induces the phase transformation from original cerium precursors to CeO2 precursors with initial pore structures in the aqueous solution. Interestingly, the initial pore structures are the pre-requisite for formation of final mesoporous CeO2 products during the hydrothermal process. From a chemical perspective, the formation mechanism of the original cerium precursors with dense structures and the CeO2 precursors with pore structures are summarized as eqn (5)–(8). In eqn (5) and (6), the original precipitate (Ce2(CO3)3·8H2O or Ce2(CO3)3OH) is obtained upon the addition of (NH4)2CO3 or Na2CO3 to Ce3+ aqueous solution, respectively (see Fig. 2). After adding H2O2, the original precipitates are oxidized, and CeO2 precursors with low crystallinities are formed (see eqn (7) and (8)), which supported by the XRD analyses in Fig. 3. At the same time, the by-products of H2O and CO2 are produced. So, the phase transformation from original cerium precursors to CeO2 precursors could be due to the oxidation of H2O2, while the initial pores on CeO2 precursors (see Fig. 8b, d and f) could be attributed to the density difference between the original cerium precursors and CeO2 precursors and the loss of by-products (H2O and CO2). Above all, the formation of pore structures could be essentially ascribed to the oxidation-induced phase transformation from original cerium precursors to CeO2 precursors that accompanied by the evolution of porous structures. After addition of H2O2, cerium precursors are oxidized into CeO2 and simultaneously with the formation of by-products H2O and CO2 as shown in eqn (7) and (8). The difference in density between cerium precursors (Ce2(CO3)3·8H2O (2.790 g cm−3) and o-Ce(CO3)OH (4.545 g cm−3)) and CeO2 (7.215 g cm−3) is the main cause for the formation of pore structures of CeO2, while the by-product CO2 bubbles play a stirring role, which are beneficial to the process of oxidation reaction and the homogeneity of CeO2 particles. Moreover, the crystallinities of CeO2 precursors could be improved and the pores grow further by following hydrothermal treatment, which supported by the XRD analyses in Fig. 4 and TEM analyses in Fig. 5.
| 2Ce(NO3)3 + 3(NH4)2CO3 + H2O = 2Ce(CO3)OH + CO2↑ + 6NH4NO3 | (5) |
| 2Ce(NO3)3 + 3Na2CO3 + 8H2O = Ce2(CO3)3·8H2O + 6NaNO3 | (6) |
| Ce2(CO3)3·8H2O + H2O2 = 2CeO2 + 3CO2↑ + 9H2O | (7) |
| 2Ce(CO3)OH + H2O2 = 2CeO2 + 2CO2↑ + 2H2O | (8) |
The SBET of final mesoporous CeO2 powders not only relates to the difference in density between cerium precursors and CeO2, but also to the particle size of original cerium precursors. The phase transformation from original cerium precursors to CeO2 precursors under the stimulation of H2O2 could be considered to be a diffusion process of H2O2. The surface of cerium precursors is first oxidized to CeO2, these original CeO2 grains have the tendency to aggregate with time to decrease their energy, and the hole between the grains are consider as the initial porous structures, which was the precondition for further forming of mesoporous structures of final CeO2 powders during the hydrothermal process. However, the content of H2O2 decreases as the reaction progress, and the framework of cerium precursor is filled by the aqueous solution or by-product CO2 bubbles, which could influence the diffusion of H2O2 from the surface to the inside of the cerium precursor framework, and then will result in the lesser porosity (see the darker areas in Fig. 8b, d, f and 5a, c, e). Moreover, the small particle sizes of cerium precursor are favorable to the diffusion of H2O2 from its surface to internal framework. The greater the difference in density, and the smaller its particle size, the more its SBET. So, the SBET of final CeO2 products is the outcome of both the difference in density between cerium precursors and CeO2 and the diffusion of H2O2 from surface to internal framework of cerium precursors. This can be used to explain why Sample 1, Sample 2, Sample 3 in this work and the CeO2 sample in our previous report (ref. 40) possess different SBET, even if some CeO2 powders are synthesized with same phase of precursor.
Effect of calcination on SBET of mesoporous CeO2
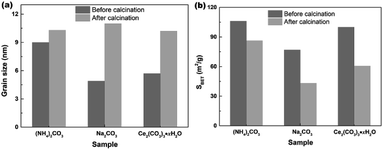
In order to investigate the effect of calcination on the grain sizes and SBET of samples, the hydrothermally produced mesoporous CeO2 powders were furthermore treated by following calcination at 500 °C for 2 h, and the grain sizes were estimated using Scherrer's formula. Fig. 9a shows the effect of calcination on the grain sizes of mesoporous CeO2 (Sample 1, Sample 2 and Sample 3, respectively). As observed, the mean grain sizes were 9.0, 4.9 and 5.7 nm for Sample 1, Sample 2 and Sample 3, respectively. After calcination, the mean grain sizes of samples increased by 14.4, 125.5 and 78.9%, which implied that the high temperature could cause the grains to grow. In addition, the hydrothermally produced CeO2 using Na2CO3 as a precipitant (Sample 2) treated by calcination showed the biggest change in grain size, which could ascribed to the minimum grain size in all hydrothermally produced CeO2 samples. Fig. 9b shows the effect of calcination on the SBET of mesoporous CeO2 (Sample 1, Sample 2 and Sample 3, respectively). As observed, the SBET of samples decreased by 18.7, 43.8 and 39.4% after calcination for Sample 1, Sample 2 and Sample 3, respectively. Moreover, the hydrothermally produced CeO2 powders using NH4HCO3 as a precipitant in our previous report (ref. 40) were also treated by calcination, the mean grain size increased from 5.4 to 10.9 nm with a gain of 101.8%, and the SBET decreased from 166.5 to 105.9 m2 g−1 with a gain of 36.4%. The reduction of SBET could be explained by the growing of grains or the collapse of pores during the calcination process. Obviously, the subsequent post-calcination treatment could lead to the growth of CeO2 grains, which in turn reduced the SBET of mesoporous CeO2 powders.Adsorption properties
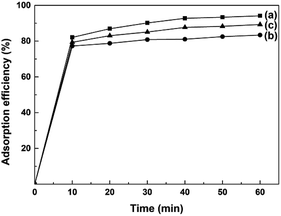
AO7 dye was selected as a model target to evaluate the adsorption abilities of mesoporous CeO2 powders. Fig. 10a–c depicts the time-dependence of adsorption profiles of AO7 dye on mesoporous CeO2 powders synthesized in the presence of H2O2 (Sample 1, Sample 2 and Sample 3, respectively). As observed, the adsorption efficiencies of AO7 dye achieved within 60 min were 94.2, 83.4 and 89.3% for Sample 1, Sample 2 and Sample 3, respectively. Furthermore, the adsorption of AO7 dye was rapid at the early stages, and the adsorption process was mostly completed within 40 min of reaction. The rapid adsorption of these mesoporous CeO2 powders for AO7 dye could be ascribed to their high SBET and pore structures. The high SBET could provide numerous adsorption sites for AO7 molecules, while the pore structures were conducive to the transportation of AO7 molecules to CeO2 framework and increasing the effective contact areas between CeO2 and AO7 molecule. Interestingly, CeO2 also can serve as an alternative photocatalyst for degradation of dye.46 The high SBET of mesoporous CeO2 powders contribute to providing more active adsorption and photocatalytic reaction sites, which favor the augmentation of photocatalytic performance.47 So, the proposed mesoporous CeO2 powders in this work have potential to photodegrade high density dye and dye intermediate from industrial effluents. The concentrations of dyes are reduced rapidly though the rapid and remarkable adsorption of mesoporous CeO2 powders. The reduced concentrations of dyes are benefit to increase the transmission of exciting lights, and thus enhance the intensity of the exciting lights reached the surface of CeO2, which could improve the photocatalytic activity of CeO2.Table 2 shows the adsorption efficiencies from the recent literatures on CeO2 development for the adsorption of AO7 dye.48–56 By comparing the adsorption efficiencies of CeO2 in these reported literatures, we can find the mesoporous CeO2 in this work showed stronger adsorption ability and achieved the absorption equilibrium more quickly, which ascribed to the higher SBET of mesoporous CeO2 in this work. The adsorption mode of AO7 on CeO2 could be described as a Lewis acid–base reaction between the electron-rich groups (sulfonate group, SO3−) of AO7 and empty 4f orbital of cerium ion on the surface of CeO2, which eventually formed an inner–sphere complex.48,57 Moreover, CeO2 could serve as an excellent adsorbent for the adsorption of other azo dyes, such methyl orange,58 congo red,59 alizarin red S and eriochrome black-T,60 and the adsorption of the azo dyes onto CeO2 was solely associated with the oxygen atoms of SO3− group.57
| Authors | Operating conditions | Adsorption efficiencies (%) | SBET (m2 g−1) |
|---|---|---|---|
| Cai48 et al. | [CeO2] = 0.5 g L−1; [AO7] = 35 mg L−1; V = 50 mL; T = —; in the dark; no pH pre-adjustments; t = 2 h | ∼23 | 67 |
| Hu49 et al. | [CeO2] = 1.0 g L−1; [AO7] = 35 mg L−1; V = 60 mL; at room temperature; in the dark; no pH pre-adjustments; t = 1 h | ∼40 | 63 |
| Arul50,51 et al. | [CeO2] = ∼0.67 g L−1; [AO7] = ∼105 mg L−1; V = 15 mL; T = —; in the dark; no pH pre-adjustments; t = 10 h | Almost zero | 52 |
| Wang52 et al. | [CeO2] = 0.5 g L−1; [AO7] = 35 mg L−1; V = 50 mL; T = —; in the dark; pH = 6.35; t = 1 h | 44–56 | 40–46 |
| Ge53 et al. | [CeO2] = 0.5 g L−1; [AO7] = 35 mg L−1; V = 50 mL; T = —; in the dark; pH = 4.0; t = ∼27 h | ∼50 | 57.5 |
| Yao54 et al. | [CeO2] = 8.0 g L−1; [AO7] = 60 mg L−1; V = 25 mL; T = 25 °C; in the dark; pH = —; t = 1 h | ∼13.3 | 54.58 |
| Wen55 et al. | [CeO2] = 0.5 g L−1; [AO7] = 40 mg L−1; V = 20 mL; T = —; in the dark; pH = 5.0; t = 1 h | ∼20 | <67.8 |
| Zang56 et al. | [CeO2] = 0.5 g L−1; [AO7] = 40 mg L−1; V = 50 mL; T = 313 K; in the dark; no pH pre-adjustments; t = 1 h | 12.5–37.5 | — |
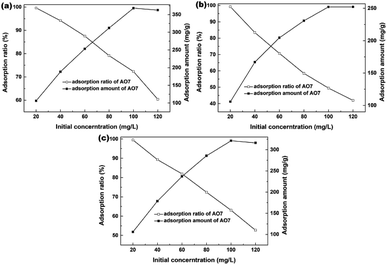
The effects of AO7 initial concentration on the AO7 adsorption amount and adsorption efficiency are shown in Fig. 11. For all samples, the adsorption amount increased with increasing AO7 initial concentrations until [AO7] = 100 mg L−1. In contrast, the removal efficiency decreased with increasing AO7 initial concentrations. More specifically, the removal efficiencies could reach 99.6, 99.2 and 99.5% at [AO7] = 20 mg L−1 for Sample 1, Sample 2 and Sample 3 synthesized in the presence of H2O2, respectively.
The adsorption experiments of AO7 dye at varying initial concentrations onto mesoporous CeO2 powders were performed, and the saturated adsorption amount of AO7 dye was obtained according to Langmuir linear fits. Fig. 12a–c shows the Langmuir linear fits of experimental data of adsorption of AO7 dye onto mesoporous CeO2 powders, and the resulting isotherm constants and correlation coefficients are presented in Table 3. From Table 3, we can see that the saturated adsorption amounts (qm) are 378.8, 261.1 and 332.2 mg g−1, and Langmuir adsorption constants (KL) are 0.4740, 0.3460 and 0.3830 for Sample 1, Sample 2 and Sample 3, respectively. In addition, all associated correlation coefficients (R2) are greater than 0.9920, confirming that Langmuir isotherm model is a good fit for modelling the adsorption of AO7 dye onto mesoporous CeO2 surface. The results indicate that the proposed route for template-free synthesis of mesoporous CeO2 powders is one marker of success to effectively and rapidly remove AO7 dye.
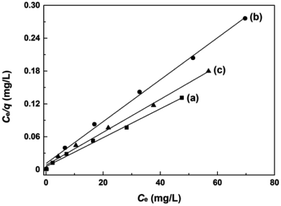 | ||
| Fig. 12 Langmuir linear fits of AO7 dye adsorbed onto mesoporous CeO2: (a) Sample 1, (b) Sample 2 and (c) Sample 3 synthesized in the presence of H2O2. | ||
| Sample | Langmuir isotherm model | ||||
|---|---|---|---|---|---|
| qm (mg g−1) | KL (L mg−1) | R2 | |||
| Precipitant | (NH4)2CO3 | Sample 1 | 378.8 | 0.4740 | 0.9929 |
| Na2CO3 | Sample 2 | 261.1 | 0.3460 | 0.9951 | |
| Existing precursor | Commercial Ce2(CO3)3·xH2O | Sample 3 | 332.2 | 0.3830 | 0.9937 |
Conclusions
The accessible, cheap and safe chemistry reagents (NH4)2CO3, Na2CO3 and H2O2 were employed for template-free synthesis of mesoporous CeO2 powders with high BET surface areas. (NH4)2CO3 or Na2CO3 as a precipitant was used to separate original cerium precursors from Ce3+ aqueous solution, while H2O2 served as an oxidant to induce the phase transformation from original cerium precursors to CeO2 precursors with initial porous structures, which was the precondition for the formation of final CeO2 phase and mesoporous structures during the following hydrothermal process at 200 °C for 24 h. The BET surface areas of mesoporous CeO2 powders synthesized using (NH4)2CO3 and Na2CO3 as precipitants were 106.1 and 76.9 m2 g−1. Moreover, another route, using commercial Ce2(CO3)3·xH2O as existing precursor for synthesis of mesoporous CeO2 powders with a BET surface area of 100.0 m2 g−1, can shorten experimental processes and reduce costs. These mesoporous CeO2 powders could be used as a suitable sorbent for rapid and effective removal of AO7 dye. Moreover, the saturated adsorption amounts could reach up to 378.8, 261.1 and 332.2 mg g−1 without pH pre-adjustments for these mesoporous CeO2 powders using (NH4)2CO3, Na2CO3 as precipitants and using commercial Ce2(CO3)3·xH2O as an existing precursor, respectively. Prompted by the high BET surface area, low cost, environmental friendliness and omissible calcination process, these mesoporous CeO2 powders synthesized with the routes in this work could be a promising candidate for practical application. In subsequent study, the optimization of experimental parameters will be explored, such as the additive amount of H2O2, hydrothermal treatment temperature and time, and so on.Conflicts of interest
There are no conflicts to declare.Acknowledgements
The authors appreciate the financial support from Leshan Normal University Research Program, China (No. Z16024), Science and Technology Bureau of Leshan city, China (No. 17GZD051).Notes and references
- K. Vinodgopal, J. Peller, O. Makogon and P. V. Kamat, Water Res., 1998, 32, 3646–3650 CrossRef CAS.
- L. Y. Liu, M. Pu, L. Yang, D. G. Evans and J. He, Mater. Chem. Phys., 2007, 106, 422–427 CrossRef CAS.
- S. Momeni and D. Nematollahi, Sci. Rep., 2017, 7, 41963 CrossRef CAS.
- E. Daneshvar, M. Kousha, N. Koutahzadeh, M. S. Sohrabi and A. Bhatnagar, Environ. Prog. Sustainable Energy, 2013, 32, 285–293 CrossRef CAS.
- K. Vinodgopal, J. Peller, O. Makogon and P. V. Kamat, Water Res., 1998, 32, 3646–3650 CrossRef CAS.
- H. Zollinger, Color Chemistry: Synthesis, Properties and Applications of Organic Dyes and Pigments, VCH Publishers, New York, 1987 Search PubMed.
- J. Li, P. Ye, J. Fang, M. Wang, D. Wu, A. Xu and X. Li, Appl. Surf. Sci., 2017, 422, 754–762 CrossRef CAS.
- W. Wang, G. Huang, C. An, X. Xin, Y. Zhang and X. Liu, Appl. Surf. Sci., 2017, 405, 119–128 CrossRef CAS.
- X. Li, W. Guo, Z. Liu, R. Wang and H. Liu, Appl. Surf. Sci., 2016, 369, 130–136 CrossRef CAS.
- R. G. Saratale, G. D. Saratale, J. S. Chang and S. P. Govindwar, J. Taiwan Inst. Chem. Eng., 2011, 42, 138–157 CrossRef CAS.
- W. E. Thung, S. A. Ong, L. N. Ho, Y. S. Wong, F. Ridwan, H. K. Lehl, Y. L. Oon and Y. S. Oon, Chem. Eng. J., 2018, 336, 397–405 CrossRef CAS.
- X. Wu, H. He, W. L. Yang, J. Yu and C. Yang, Appl. Microbiol. Biotechnol., 2018, 102, 7597–7610 CrossRef CAS.
- K. M. Reza, A. Kurny and F. Gulshan, Appl. Water Sci., 2017, 7, 1569–1578 CrossRef CAS.
- S. L. Lee, L. N. Ho, S. A. Ong, Y. S. Wong, C. H. Voon, W. F. Fhalik, N. A. Yusoff and N. Nordin, Chemosphere, 2018, 209, 935–943 CrossRef CAS.
- S. Wu, H. Li, X. Li, H. He and C. Yang, Chem. Eng. J., 2018, 353, 533–541 CrossRef CAS.
- M. Minière, O. Boutin and A. Soric, Can. J. Chem. Eng., 2018 DOI:10.1002/cjce.23195.
- C. Zhang, W. Chen, J. Xian and D. Fu, RSC Adv., 2018, 8, 3934–3940 RSC.
- Q. Qiao, S. Singh, S. L. Lo, Y. Li, J. Jin and L. Wang, J. Taiwan Inst. Chem. Eng., 2018, 84, 110–122 CrossRef CAS.
- J. Li, H. Lin, K. Zhu and H. Zhang, Chemosphere, 2017, 188, 139–147 CrossRef CAS.
- G. Li, W. Zhao, B. Wang, Q. Gu and X. Zhang, Desalin. Water Treat., 2016, 57, 2167–2174 CrossRef CAS.
- H. Oualid and M. Slimane, Water Environ. Res., 2017, 89, 250–259 CrossRef.
- M. Yusuf, M. A. Khan, M. Otero, E. C. Abdullah, M. Hosomi, A. Terada and S. Riya, J. Colloid Interface Sci., 2017, 493, 51–61 CrossRef CAS.
- W. Wang, G. Huang, C. An, S. Zhao, X. Chen and P. Zhang, J. Cleaner Prod., 2018, 172, 1986–1997 CrossRef CAS.
- X. Inthapanya, S. Wu, Z. Han, G. Zeng, M. Wu and C. Yang, Environ. Sci. Pollut. Res., 2019, 26, 5944–5954 CrossRef CAS.
- M. L. Ma, J. H. Qin, C. Ji, H. Xu, R. Wang, B. J. Li and S. R. Batten, J. Mater. Chem. C, 2014, 2, 1085–1093 RSC.
- Y. Huang, C. Yang, Z. Sun, G. Zeng and H. He, RSC Adv., 2015, 5, 11475–11484 RSC.
- L. Lu, Y. Lin, Q. Chai, S. He and C. Yang, Colloids Surf., A, 2018, 558, 103–109 CrossRef CAS.
- S. Wu, H. He, X. Inthapanya, C. Yang, L. Lu, G. Zeng and Z. Han, Environ. Sci. Pollut. Res., 2017, 24, 16560–16577 CrossRef CAS.
- Q. Wei, Q. Ma, P. Zuo, H. Fan, S. Qu and W. Shen, Chemcatchem, 2018, 10, 1019–1026 CrossRef CAS.
- H. Zhu, Y. Chen, Z. Wang, W. Liu and L. Wang, RSC Adv., 2018, 8, 14888–14897 RSC.
- K. Li, Y. Zhao, C. Song and X. Guo, Appl. Surf. Sci., 2017, 425, 526–534 CrossRef CAS.
- L. Wang and H. Liu, Catal. Today, 2018 DOI:10.1016/j.cattod.2018.04.015.
- S. Zhan, H. Zhang, Y. Zhang, Q. Shi, Y. Li and X. Li, Appl. Catal., B, 2017, 203, 199–209 CrossRef CAS.
- Y. Wang, D. Gao, C. Li, C. Li, F. Rosei, D. Ma and G. Chen, Part. Part. Syst. Charact., 2018, 35, 1700367 CrossRef.
- C. Ni, X. Li, Z. Chen, H.-Y. H. Li, X. Jia, I. Shah and J. Q. Xiao, Microporous Mesoporous Mater., 2008, 115, 247–252 CrossRef CAS.
- N. Nabih, R. Schiller, I. Lieberwirth, E. Kockrich, R. Frind, S. Kaskel, C. K. Weiss and K. Landfester, Nanotechnology, 2011, 22, 135606 CrossRef.
- J. Wei, Z. Yang, H. Yang, T. Sun and Y. Yang, CrystEngComm, 2011, 13, 4950–4955 RSC.
- A. Xie, W. Liu, S. Wang, X. Liu, J. Zhang and Y. Yang, Mater. Res. Bull., 2014, 59, 18–24 CrossRef CAS.
- Y. He, S. Du, J. Li, R. Zhang, X. Liang and B. Chen, Chemcatchem, 2017, 9, 4070–4082 CrossRef CAS.
- Y. Xu and R. Li, RSC Adv., 2015, 5, 44828–44834 RSC.
- D. F. Swinehart, J. Chem. Educ., 1962, 39, 333–335 CrossRef CAS.
- S. Duran, D. Şolpan and O. Güven, Nucl. Instrum. Methods, 1999, 151, 196–199 CrossRef CAS.
- I. Langmuir, J. Am. Chem. Soc., 1918, 40, 1361–1403 CrossRef CAS.
- Y. Lin, S. Wu, C. Yang, M. Chen and X. Li, Appl. Catal., B, 2019, 245, 71–86 CrossRef CAS.
- J. C. Groen, L. A. A. Peffer and J. Pérez-Ramírez, Microporous Mesoporous Mater., 2003, 60, 1–17 CrossRef CAS.
- D. Sun, M. Gu, R. Li, S. Yin and T. Sato, Appl. Surf. Sci., 2013, 280, 693–697 CrossRef CAS.
- Y. Lin, S. Wu, X. Li, X. Wu, C. Yang, G. Zeng, Y. Peng and L. Lu, Appl. Catal., B, 2018, 227, 557–570 CrossRef CAS.
- W. Cai, F. Chen, X. Shen, L. Chen and J. Zhang, Appl. Catal., B, 2010, 101, 160–168 CrossRef CAS.
- S. Hu, F. Zhou, L. Wang and J. Zhang, Catal. Commun., 2011, 12, 794–797 CrossRef CAS.
- N. S. Arul, D. Mangalaraj, P. C. Chen, N. Ponpandian, P. Meena and Y. Masuda, J. Sol-Gel Sci. Technol., 2012, 64, 515–523 CrossRef CAS.
- N. S. Arul, D. Mangalaraj, T. W. Kim, P. C. Chen, N. Ponpandian, P. Meena and Y. Masuda, J. Mater. Sci.: Mater. Electron., 2013, 24, 1644–1650 CrossRef.
- Y. Wang, X. Shen and F. Chen, J. Mol. Catal. A: Chem., 2014, 381, 38–45 CrossRef CAS.
- L. Ge, C. Zang and F. Chen, Chin. J. Catal., 2015, 36, 314–321 CrossRef CAS.
- H. Yao, X. Ding, Z. Wang, F. Zhang, Y. Wang and G. Luo, RSC Adv., 2016, 6, 112413–112419 RSC.
- T. Wen, Y. Tang, F. Chen and B. Mo, Arch. Environ. Prot., 2016, 42, 12–19 Search PubMed.
- C. Zang, X. Zhang, S. Hu and F. Chen, Appl. Catal., B, 2017, 216, 106–113 CrossRef CAS.
- P. Ji, J. Zhang, F. Chen and M. Anpo, Appl. Catal., B, 2009, 85, 148–154 CrossRef CAS.
- Z. Cui, J. Zhang, Y. Xue and H. Duan, Langmuir, 2018, 34, 3197–3206 CrossRef CAS.
- Z. Yang, J. Wei, H. Yang, L. Liu, H. Liang and Y. Yang, Eur. J. Inorg. Chem., 2010, 2010, 3354–3359 CrossRef.
- S. Mishra, S. Soren, A. K. Debnath, D. K. Aswal, N. Das and P. Parhi, Optik, 2018, 169, 125–136 CrossRef CAS.
Footnote |
| † Electronic supplementary information (ESI) available. See DOI: 10.1039/c9ra02294e |
| This journal is © The Royal Society of Chemistry 2019 |

