 Open Access Article
Heteroatom-doped nanoporous carbon initiated from bimetallic molecular framework micro-rods for supercapacitor electrodes†
Qiang Wang *a,
Hongwei Lianga and
Dun Wub
aSchool of Materials Science and Engineering, Changzhou University, 213164, P. R. China. E-mail: wq@cczu.edu.cn
bHuaide College, Changzhou University, 214500, P. R. China
First published on 4th June 2019
Abstract
We report herein that zinc and cobalt bimetallic-organic-framework (BMOF) crystalline micro-rods are able to be constructed instantly with the eco-friendly glutamate ligand and building unit of double metallic ions. After carbonization and acid leaching of these precursors, the resultant heteroatom-doped porous carbon occupies not only the enriched mesopore architectures but the ultrathin graphitic networks. Moreover, due to cyclizing dehydration reaction of the glutamate ligand upon thermal conversion, the predominant pyrrolic and pyridinic nitrogen atom sites within the carbon lattices are achieved. The supercapacitor electrodes from these carbonaceous materials without any conductive addictive deliver an impressive specific gravimetric capacitance of 230 F g−1 and a specific areal capacitance of 50 μF cm−2 at a current density of 1 A g−1 in alkaline aqueous electrolyte.
1 Introduction
The incorporation of heteroatoms in the silicon crystalline lattice is the cornerstone of the modern information society. And likewise, to tailor the intrinsic properties of carbonaceous materials such as electrical conductivity and energy levels as well as their specific interaction with guest molecules with the strategy of heteroatom doping has attracted much interest among the community of materials research.1–3 In the arena of electrochemical electrode materials, nitrogen doped carbon definitely plays a pivotal role. For example, the N-doped ordered mesoporous few-layer carbon cast by a hard template method can deliver a specific capacitance of 855 F g−1 at a current density of 1 A g−1 and an ultrahigh specific energy density of 41 W h kg−1 in acid electrolytes, which makes the carbon-based supercapacitors potentially on par with batteries on a gravimetric basis.4 Besides, nitrogen-doped porous carbon as well as transition metal-nitrogen co-doped (MN4 motif) carbon are also among the most promising candidates as alternatives to high-cost Pt electro-catalyst for fuel cell applications.5–7With the merits of atom-level control over composition and well-defined pore architectures, the thermal transformation of different MOF crystalline solids to highly porous carbon has been boosted as a routine self-template method in recent years.8 As far as N-doped carbon is concerned, the most popular precursors are zeolitic imidazolate frameworks (ZIFs) and Prussian blue analogues (PBAs) due to their high initial nitrogen content and the heritance of precursor's morphologies after carbonization.9–11 However, when the eco-friendly productions are regarded, the safaris of the alternative precursors became imperative.12,13 Another issue related to MOF derived porous carbon as electrode materials is the electrical conductivity. Due to the cellular textures of the MOF framework and incorporation of heteroatom to the carbon lattice are inevitable during the carbonization step, resulting in the decreased conductivity of as-prepared nanoporous carbon when compared with its counterparts of carbon nanotubes and graphene. As a result, the MOF precursor generally needs to combine with the high conductive substrates or to elevate the degree of graphitization by incorporation of the transition metals to the MOF precursor.14,15
In this study, we present a facile method to introduce cobalt atom to a three-dimension zinc glutamate (Glu) molecular frameworks with the solvent of water at mild condition. After carbonization and acid leaching, the prepared porous carbons exhibit tunable degree of graphitization, porosity and show promising performance as the supercapacitor electrodes.
2 Results and discussion
The powder X-ray diffraction (XRD) patterns of all the BMOF samples (Fig. 1) confirm their high crystallinity and are able to be assigned to the previously reported MOF compound of aquazinc(II) glutamate hydrate, [Zn(II) (L-Glu)H2O·H2O]n (JCPDS no. 21-1981). Due to the similar atom radius of Zn and Co, Co atoms are able to substitute partially the octahedral Zn atoms in these three-dimension frames structure with two water molecules standing at the chiral tunnels.16 In addition, the digital photograph of Scheme S1† delineates the evolution of colour for the BMOF precursor with the different Zn/Co ratio and the sample of the resultant porous carbon. With the naked eye, it was observed that the more initial Co concentration in the reaction solution, the more pink among the BMOF precursors powder. It must be addressed that no solid product can be achieved without the Zn element at the same experimental conditions. As revealed by scanning electron microscopy (SEM), Fig. 2A and B, all the BMOF samples showed a well-defined tetragonal rod shapes with the diameter of about 1 μm that was consistent with those of previous studies.17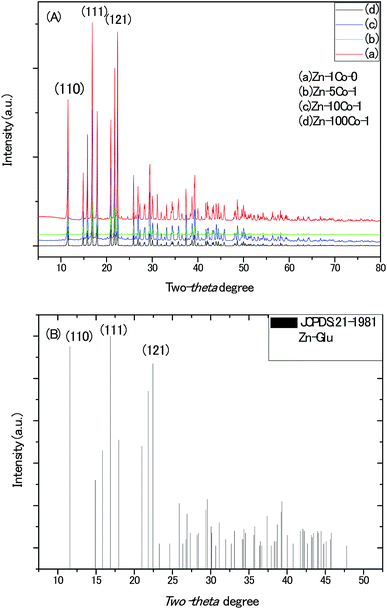 | ||
| Fig. 1 (A) The XRD patterns of the MOF micro-rods synthesized with different molar ratio of Zn/Co in solution. (B) The standard X-ray diffraction patterns of Zn-Glu MOF. | ||
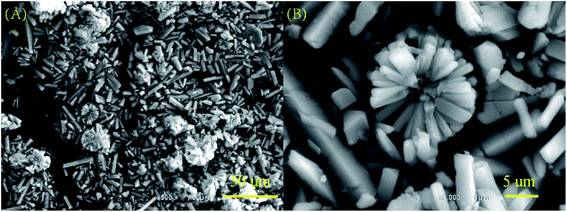 | ||
| Fig. 2 (A) and (B) The typical images of the scanning electron microscopy (SEM) for BMOF (Zn–5Co-1) micro-rods. | ||
Energy-dispersive X-ray spectroscopic (EDX) analysis of the Zn–5Co-1 BMOF sample (Fig. S1†) corroborated the real molar ratio of Zn to Co in these micro-rods close to 50![[thin space (1/6-em)]](https://www.rsc.org/images/entities/char_2009.gif) :
:![[thin space (1/6-em)]](https://www.rsc.org/images/entities/char_2009.gif) 1 for the starting recipe of Zn
1 for the starting recipe of Zn![[thin space (1/6-em)]](https://www.rsc.org/images/entities/char_2009.gif) :
:![[thin space (1/6-em)]](https://www.rsc.org/images/entities/char_2009.gif) Co = 5
Co = 5![[thin space (1/6-em)]](https://www.rsc.org/images/entities/char_2009.gif) :
:![[thin space (1/6-em)]](https://www.rsc.org/images/entities/char_2009.gif) 1 in solution, which indicates only tenth of total Co species are coordinated with Glu ligand and impregnate into the lattice of the BMOF solid under the present experimental conditions.
1 in solution, which indicates only tenth of total Co species are coordinated with Glu ligand and impregnate into the lattice of the BMOF solid under the present experimental conditions.
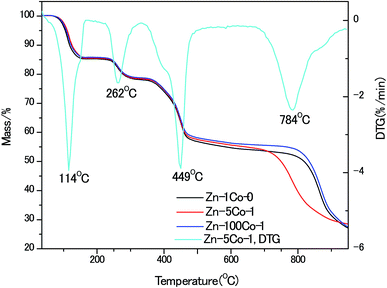
To gain insight of the thermal stability of these BMOF rods, thermo-gravimetric (TG) analyses were performed, as shown in Fig. 3. In comparison to the pure Zn-Glu MOF, the Zn–5Co-1 BMOF sample accelerated to decompose at the lower temperature of 700 °C vs. 800 °C, that was believed to be the synergistic catalytic effect of the metallic Co-containing clusters. It has been recognized for zinc-containing MOF that when the heating temperature is above the boiling point of Zn (907 °C), the metallic Zn species evaporates, leaving an open cellular structure.18 The XRD patterns of the pyrolysized products without acid etching also confirmed this statement, which are demonstrated in Fig. S2.† Obviously, the strong peaks at about 45°, 52°, 76° should be attributed to (111), (200) and (220) planes of face-centered cubic metallic cobalt (JCPDS 15-0806). Based on the above analysis, the optimum temperature of pyrolysis in this work was kept at 900 °C.
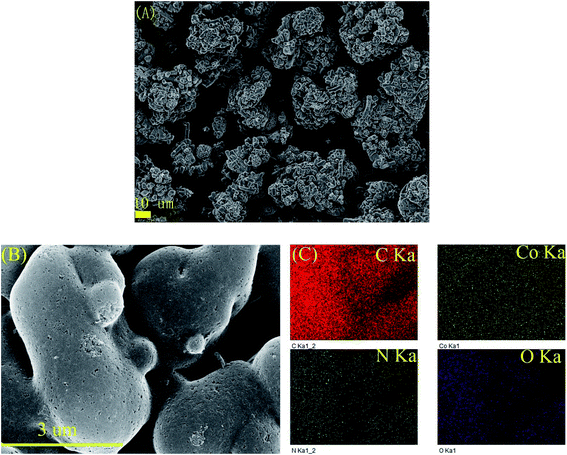
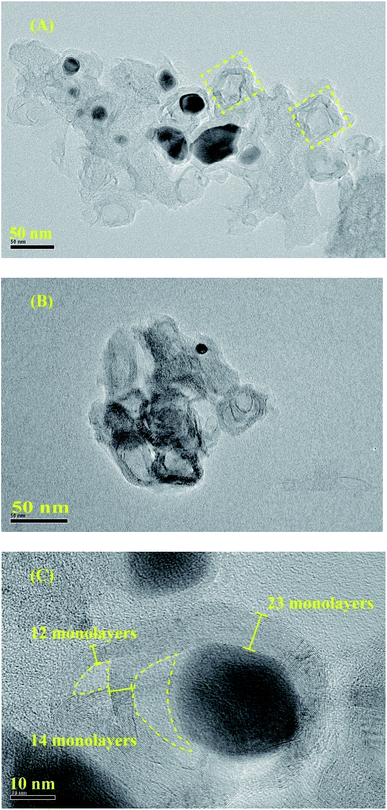
To clearly investigate the changes of morphologies and composition within the pyrolysized products after acid leaching, SEM and corresponding EDX mapping operation for the BMOF (Zn–5Co-1) derived carbon are carried out. As shown in Fig. 4A, the distinguishable features are the long rods of the precursor had been divided to the short ones that aggregated together which might be caused by magnetic pole effects related with Co species, and the facets of precursor crystals had been weakened or to some extent disappeared due to the possible liquid-phase sintering kinetics. The elemental mapping results (Fig. 4C) suggested that the four atoms (C, Co, O, N) distribute homogeneously around the products and the residual Co content was only 0.26 atomic percentage that meant most of the exposed Co particles are dissolved completely by the acid treatment. Fig. 5, displayed the transmission electron microscope (TEM) images of the typical raw carbon products derived from Zn–5Co-1 at 900 °C and the products after acid etching. In Fig. 5A, the black dots in the size of several ten nanometers should be ascribed to Co nanoparticles and the hollow carbon cages at the edge of samples that might be the results of mechanic separation of Co nanoparticles from the carbon substrates in the process of sonication operation. Fig. 5B demonstrated that only those Co nanoparticles completely encapsulated by carbon shells could be preserved after acid leaching. The high resolution TEM images of Fig. 5C and S3.† revealed that the size of Co core were about 10 nm, while the thickness of carbon shells varied from ∼1 nm in interiors to more than 7 nm in exteriors by counting the graphitic (002) lattice fringes. To our surprise, the conical holes between the two neighbouring carbon shells should be speculated in a dynamic manner that at the low temperature (<900 °C), there might be occurring a series of Zn–Co alloy or carbide composite nanoparticles which enabled to induce graphitization; with the increase of the sintering temperature, the volume of these alloys nanoparticles shrink for the evaporation of zinc clusters leads to smaller pure Co nanoparticle at last.19 Another possible explanation is based on the growth mechanism of bamboo-like carbon nanotubes with chemical vapour deposition method: due to the low melting point of Zn (419.5 °C), the Zn–Co alloy nanoparticles may exist as quasi-liquid state, the capillary force at the interface of alloy-carbon works as driving force for the jump of metal catalysts, together with the inner accumulated gas stress force.20 At last, the highly curved graphene layers also suggested that there existed abundant defective sites such as nitrogen doped Stone–Wales defect and others.21
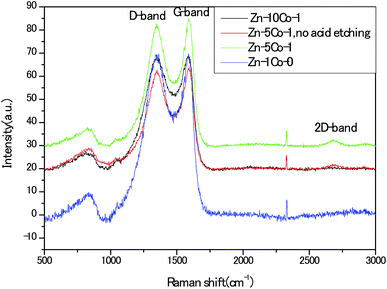
To provide insightful understanding on the correlation between graphitization degree within the porous carbon structures and electrical conductivity of the products, Raman spectra were recorded with the four thermally annealed samples. In Fig. 6, the peaks centered at around 1352 cm−1 and 1586 cm−1 represented the disorder carbon or defects (D-band) and graphitic carbon (G-band), respectively. As an indicator of the overall graphitic degree of carbon materials, the relative intensity ratio of D-band to G-band (ID/IG) decreased from 1.0 for the Zn-Glu MOF (Zn–1Co-0) derived carbon to 0.98 for the BMOF of Zn–5Co-1 derived carbon, suggesting that metallic Co species could effectively promote the graphitization, thus enhancing the electrical conductivity of the samples. In addition, the apparent second-order band at approximately 2700 cm−1 for the Zn–5Co-1 derived carbon signified the existence of multi-layers of graphene domains, which have been confirmed by the aforementioned HRTEM analysis.22 Unless otherwise specified, the acid treated porous carbon samples discussed below were all prepared with the BMOF of Zn–5Co-1 precursor.
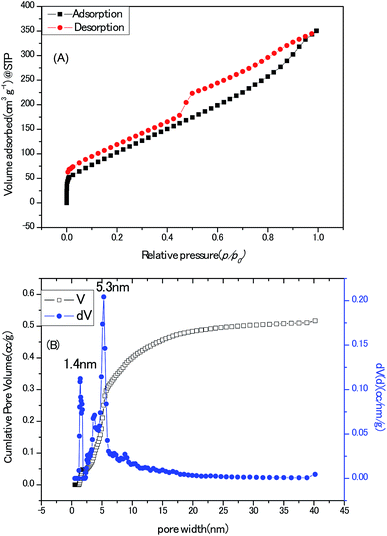
Towards the application for electrochemical electrodes working in aqueous electrolyte, the porous texture is absolutely a pivotal concern. State-of-the-art pore size characterization of the Zn–5Co-1 BMOF derived carbon samples were implemented by coupling cryogenic nitrogen (77.4 K) adsorption/desorption isotherms with the advanced methods based on density functional theory (DFT). As shown in Fig. 7A, the isotherm profile could be divided to two regions, one is the uptake of adsorbent at low relative pressure (0–0.05) which are usually related to micropores; the other is the hysteresis loops at the relative pressure (0.4–1) that generally indicates the presence of mesopores. In addition, the ratio of surface area for micropores to surface area for the external pores equals to 0.29, measured by t-plot method which means a major portion of pores in this sample are mesopores or macropores. The Brunauer–Emmett–Teller (BET) surface area and total pore volume of the BMOF derived carbon samples were calculated as 436 m2 g−1 and 0.54 cm3 g−1, respectively, much less than those (1149 m2 g−1) of the porous carbon derived from Zn-Glu MOF at the same pyrolysis temperature which should be interpreted by that the growth of graphitic carbon walls proceed at the cost of sacrificing the surface belongs to amorphous carbon micropores.23 As depicted in Fig. 7B, the mode of the pore size distribution of the sample calculated by hybrid nonlocal DFT calculation with the model of slit/cylinder suggested the most probable pore size is 5.3 nm, which belongs to mesopore scale and may favour the ion/charge transportation between electrode and electrolyte.24
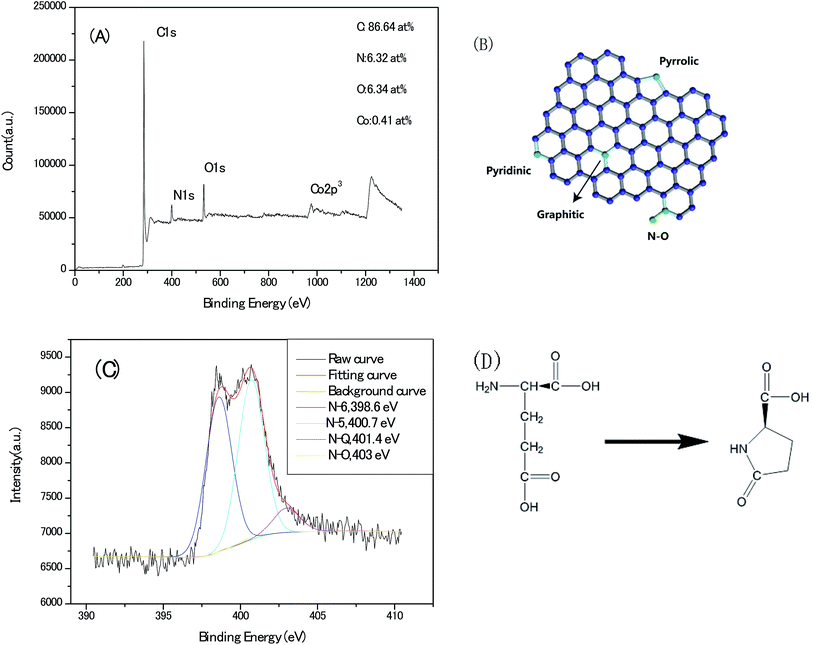
Deciphering the content and atomic sites of the doped heteroatom in carbon matrix will contribute to understand not only the pseudo-capacitive behaviours but the surface hydrophilicity with electrolyte towards the application of capacitor electrode. Fig. 8A shows the X-ray photoelectron spectroscopy (XPS) survey of the Zn–5Co-1 BMOF derived carbon samples, and the signals for nitrogen, oxygen, cobalt can be identified with a doping content of 6.32, 6.34 and 0.41 atom%, respectively. As schematically outlined in Fig. 8B, there are four type nitrogen atom sites in carbon matrix, that is graphitic-N, pyridinic-N, pyrrolic-N as well as oxidized-N. The corresponding high-resolution N1s core level spectra (Fig. 8C) can be deconvoluted by 4 peaks representing pyridinic N (N-6 at 398.6 eV), pyrrolic or pyridonic N (N-5 at 400.7 eV), graphitic N (N-Q at 401.4 eV), oxided N (N-X at 403 eV). Meanwhile, more than 90% of total N atoms in present carbon matrix locate at N-5 (∼45%) and N-6 (∼45%) sites, according to their relative integrated areas. However, pyrrolic N is generally believed unstable at the temperature above 600 °C and tends to convert into pyridinic N, graphtic N at high temperature.25 The dominant N-5 and N-6 atom sites in our sample should be associated with that the carbon chain of glutamate (a typical α-amino acid) is foldable and easy to cyclize to a pentagon ring compound of pyroglutamate upon thermal conversion, via intra-molecular dehydration, as depicted in Fig. 8D.26 In final, these nitrogen–carbon pentagon ring merge with the sp2 carbon lattice. Therefore, the roles of metallic atoms in the precursor crystals should be re-assessed as not only the porogen but the stabilizer for nitrogen pentagon ring intermediates at the high pyrolysis temperature.
According to the high resolution O 1s core level spectra (Fig. S4†), a major portion of O atoms present as C–OH and/or C–O–C functional groups (O–H type at 532 eV) as well as the total oxygen content is much less than traditional chemically activated carbon (6.34% vs. 10–20%). Deconvolution of the XPS spectra of Co 2p (Fig. S4†) suggest the presence two distinct valence states: the metallic state of Co (778.5 and 793.8 eV) and the oxidation state of Co (Co2+, Co3+), due to the interaction with the adsorbed O2 in Co surface.27
Lastly, the hydrophilicity of this porous carbon film on Ni foil was evaluated with the static state contact angle measurements (Fig. 9), the excellent surface wettability of the sample with water (43° vs. 125°) should be attributed to relative high content of polar functional groups among the surfaces.
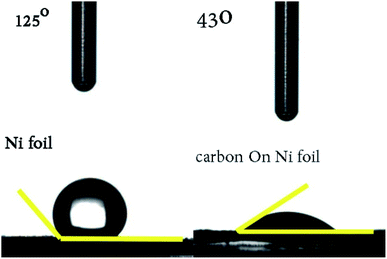 | ||
| Fig. 9 The static state contact angle measurement of porous carbon (derived from Zn–5Co-1 BMOF) film. | ||
High specific surface and appropriate porous architectures, combining with highly graphitic carbon walls networks and abundant heteroatoms within the carbon lattice, makes the present sample a potential electrode material for electrochemical supercapacitor. To gain preliminary insight into the capacitive performance of these nanoporous carbon materials, the cyclic voltammograms (CV) of the electrodes without any conduct addictives are recorded in Fig. 10A; the curves remained quasi-rectangular shapes even at the scan rate up to 200 mV s−1, suggesting the formation of electrical double layer and good capacitance retention of the electrodes. In addition, no humps related with the oxidative–reductive pair of Co oxides could be detected.28 The variation of the calculated specific capacitance with the scan rate are documented in Fig. 10B and the highest value of 438 F g−1 at the scan rate of 5 mV s−1 should be estimated discreetly for the possible hydrogen evolution reaction at present voltage window, intercalation of K+ ion into lattice of carbon matrix and pseudo-capacitance behaviours induced by the heteroatoms in alkaline solution.29,30
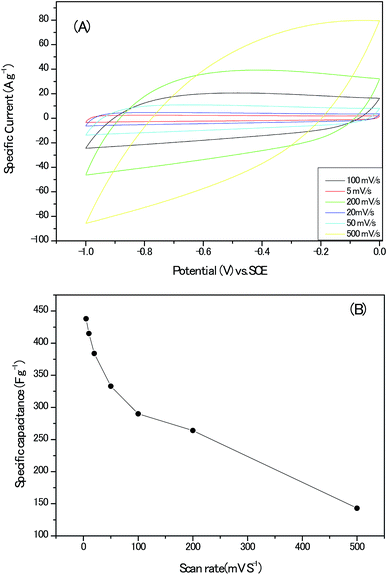 | ||
| Fig. 10 (A) The cyclic voltammograms (CV) plots of the electrodes without any conduct addictives. (B) The calculated specific capacitance at different scan rates. | ||
Next, the nearly symmetric triangular shape of the galvanostatic charge/discharge plots (Fig. 11A.) indicated the dominant charges storage mechanism of electrical double layer arising from ions electro-adsorption/desorption on the electrodes and the calculated specific capacitances from the GCD profiles with its corresponding current density are shown in Fig. 11B. The specific capacitance of 230 F g−1 at the current density of 1 A g−1 for our electrodes approached the optimum 250 F g−1 of pure or near pure carbon materials with moderate specific surface area (Table S5†). It should be emphasized that there are obvious iR-drop of 0.07 V at the high current density of 10 A g−1. Moreover, when this gravimetric capacitance at 1 A g−1 was nominated with specific surface area of the active material, a specific areal capacitance 50 μF cm−2 could be achieved which is about 5 times that of commercial activated carbon electrodes (10 μF cm−2) and is much higher than the theoretical EDLC capacitance of carbon electrodes (10–25 μF cm−2).31 This result proved the surfaces of our porous carbon are utilized with high efficiency by the aqueous alkaline electrolyte.
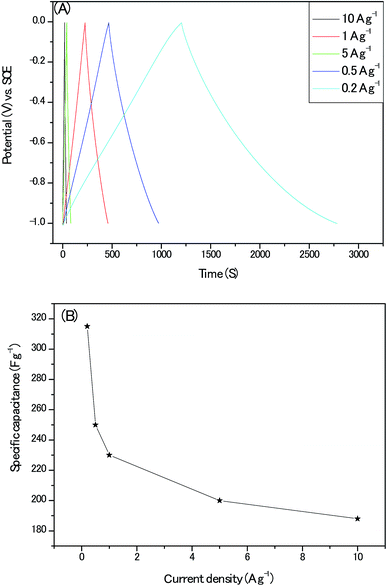 | ||
| Fig. 11 (A) The galvanostatic charge/discharge plots at different current densities; (B) the calculated specific capacitance at different current densities. | ||
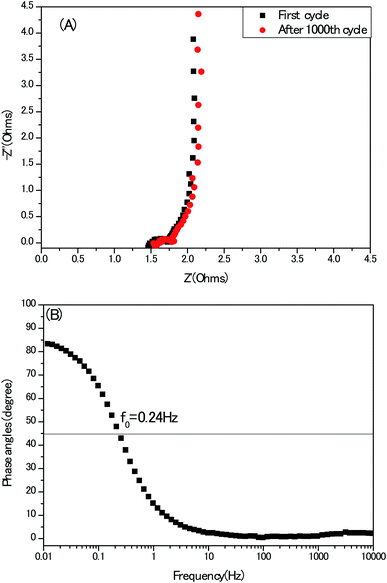
At last, electrochemical impedance spectroscopy (EIS) is a versatile tool to unravel the kinetics of the frequencies response and modes of charge carrier diffusion. A Nyquist impedance spectrum of the electrodes recorded in a three-electrode configuration at the open circuit voltage is presented in Fig. 12A, without employing any stimulation of equivalent circuits. The typical three compartments of porous carbon materials: semi-circle, 45° Warburg slop and vertical line at high-, medium- and low frequency region stand out perfectly. Meanwhile, the first intersection with the Z′axis of the Nyquist plot represents the equivalent series resistance (ESR) which is attributed to the resistance of the electrolyte and the internal resistance of the electrodes. This 1.3 Ω of the present electrode without any conduct addictive is competitive, compared with other activated carbon-based electrodes.32 In Bode plot, (Fig. 12B), the phase angle of curve is close to 90°, also indicating an ideal capacitor behaviour at low frequency region. Meanwhile, the characteristic frequency (f0) at the phase angle of 45° equals to 0.24 Hz, indicating the relaxation time is 4.2 second (σ0 = 1/f0) in good agreement with the conventional activated carbon electrodes.33 From practical application point of view, the cyclic stability of electrodes must be mentioned. As seen in Fig. S6,† after 1000th cycle, the retention of capacitance is nearly 100%, but the ESR of the same electrode became large, suggesting the deterioration of the electrode to some extent in long term, which coincides with the reports of other heteroatoms doped porous carbon electrodes.34,35
3 Conclusions
To sum up, by incorporating of cobalt atoms into the three-dimension Zn-Glu molecular frameworks, the crystalline BMOF micro-rods are able to be created spontaneously under the mild condition. The correspondingly derived nanoporous carbon showcases high specific surface area, tunable pore textures as well as highly graphitic nanosheets networks and the dominant N5 +N6 sites distribution, makes it a potential electrode material not limited to supercapacitor but including many emerging energy-related devices such as fuel cell, electrolyzer and battery. After tentatively define the roles of metals and ligands within the precursor during high temperature pyrolysis operation, we believe that such a strategy could supply new avenues for the rational engineering of N-doped carbonaceous nano-structured materials from the sustainable feedstock.4 Experimental
4.1. Fabrication of the nanoporous carbon
A series of bimetallic MOFs sample with various molar ratios of Zn to Co (from 1![[thin space (1/6-em)]](https://www.rsc.org/images/entities/char_2009.gif) :
:![[thin space (1/6-em)]](https://www.rsc.org/images/entities/char_2009.gif) 0 to 100
0 to 100![[thin space (1/6-em)]](https://www.rsc.org/images/entities/char_2009.gif) :
:![[thin space (1/6-em)]](https://www.rsc.org/images/entities/char_2009.gif) 1, 10
1, 10![[thin space (1/6-em)]](https://www.rsc.org/images/entities/char_2009.gif) :
:![[thin space (1/6-em)]](https://www.rsc.org/images/entities/char_2009.gif) 1, 5
1, 5![[thin space (1/6-em)]](https://www.rsc.org/images/entities/char_2009.gif) :
:![[thin space (1/6-em)]](https://www.rsc.org/images/entities/char_2009.gif) 1) in solution have been synthesized via co-precipitation reaction. At first, Zn (AC)2·2H2O and CoSO4·7H2O (AR grade, Sinopharm Chemical Regent, China) were dissolved and magnetic stirred in 50 mL deionized (DI) water in one beaker, then 8.423 g monosodium glutamate (purity > 99%, Lotus brand, Food grade products made by microbial fermentation, China) were dissolved with 50 mL DI water in another beaker. After poured the first beaker to the second, the pink or white sediments occurred immediately with the mechanic stirring. The growth of sediment was about 5 minutes, then, the products were rinsed with DI water and anhydrous ethanol thoroughly, dried for further processing. For the sake of brevity in the text, the symbol of Zn–XCo-Y was employed to denote the BMOF samples obtained from the solution with the different Zn/Co molar ratios. Take an example, the Zn–1Co-0 indicates the pure Zn-Glu MOF. The temperatures of reaction system were kept at 40 °C with water bath method.
1) in solution have been synthesized via co-precipitation reaction. At first, Zn (AC)2·2H2O and CoSO4·7H2O (AR grade, Sinopharm Chemical Regent, China) were dissolved and magnetic stirred in 50 mL deionized (DI) water in one beaker, then 8.423 g monosodium glutamate (purity > 99%, Lotus brand, Food grade products made by microbial fermentation, China) were dissolved with 50 mL DI water in another beaker. After poured the first beaker to the second, the pink or white sediments occurred immediately with the mechanic stirring. The growth of sediment was about 5 minutes, then, the products were rinsed with DI water and anhydrous ethanol thoroughly, dried for further processing. For the sake of brevity in the text, the symbol of Zn–XCo-Y was employed to denote the BMOF samples obtained from the solution with the different Zn/Co molar ratios. Take an example, the Zn–1Co-0 indicates the pure Zn-Glu MOF. The temperatures of reaction system were kept at 40 °C with water bath method.
The BMOF sample was placed in a porcelain boat, and flushing with N2 flow (99.99% purity) for 5 min, heated in a horizontal tube furnace (MTI-GSL1400X, China) up to 900 °C, at a rate of 5 °C min−1 under the N2 flow (1 L min−1) and maintained for 2 hours. The obtained black sample was immersed with 1 M HCl solution to remove the unstable Co nanoparticles, subsequently rinsed with adequate amount of DI water and then filtrated. The typical yield of carbonaceous material is ∼20%.
4.2. Structure characterization of the samples
The X-ray powder diffraction (XRD) patterns were collected using a D/max 2500 PC (Rigaku) diffractometer with monochromatic Cu Kα radiation of wavelength 0.1541 nm and at a scanning speed of 2° min−1. Thermo-gravimetric (TG) analyses were conducted on a NETZSCH (209F1 Libra) analyzer with a temperature ramp of 10 °C min−1 under the Ar flow. Raman spectra were recorded on a Thermo Fisher DXR Raman microscope at an excitation wavelength of 532 nm and the power of 7 mW. X-ray photoelectron spectra (XPS) were obtained on a VG ESCALab MK II X-ray photoelectron spectrometer with an exciting source of Mg Ka (1253.6 eV). In the XPS spectra, all binding energies were referenced to the C 1 s neutral carbon peak at 284.5 eV and the elemental compositions were determined from peak area ratios correction for each element.The morphologies of the samples and Energy-dispersive X-ray spectroscopic (EDX) analysis were observed by a Field emission scanning electron microscope, FE-SEM (Zeiss, supra55 with “Oxford” Si(Li) solid-state detector) with the acceleration voltage of 5 kV. TEM and high resolution transmission electron microscopy (HR-TEM) were taken using a JEOL JEM-2100 transmission electron microscope with the acceleration voltage of 200 kV.
The specific surface area and pore texture of the porous carbon samples were determined by cryogenic N2 adsorption–desorption isotherms (Quantachrome Autosorb-iQ) after being vacuum-dried at 150 °C overnight. The specific surface areas were calculated by the BET (Brunauer–Emmett–Teller) method. Micropore surface area was derived from t-plot method. Cumulative pore volume and pore size distribution were calculated by using a slit/cylindrical nonlocal density functional theory (NLDFT) model and Barrett–Joyner–Halenda (BJH) method, respectively.
Static state contact angle measurements were performed in a JC200D device (Powereach, China) in air at room temperature. The sessile drop method was implemented employing DI water droplets of 5 μL volume and the powder of sample was pressed on the Ni foil without any binder.
4.3. Electrochemical characterization of the electrodes
The electrode was prepared by mixing well the active materials and poly (tetrafluoroethylene) (PTFE) binder (5 wt%, Daikin) in an agate mortar with anhydrous ethanol as solvent. In the case of using 6 M KOH solution as the electrolyte, the above slurries were pasted onto a nickel foam (1 cm × 1 cm) at a pressure of 10 MPa. The resultant electrodes were placed in a vacuum drying oven at 105 °C for 8 h. In all cases, the mass of electrode was weighed out with the electronic balance (Shimadzu, ATY224, 0.1 mg) and the typical mass load was ∼2 mg cm−2 in each working electrode. Cyclic voltammetry (CV), electrochemical impedance spectroscopy (EIS) and galvanostatic charge–discharge (GCD) tests were performed with an electrochemical analyzer (CHI 660 B, USA) under ambient conditions, using a conventional one-component three-electrode glass cell, in which platinum foil (1 cm2) and a double junction saturated calomel electrode (SCE, “Leici”, China) were used as the counter and reference electrodes, respectively.Specific gravimetric capacitances from cyclic voltammetry (CV) tests can be formulated by integrating the corresponding curves and then are divided by the scan rate according to the formula:
 | (1) |
Specific gravimetric capacitances from galvanostatic charge–discharge tests (GCD) can be calculated on the basis of equation:
 | (2) |
Specific areal capacitances were defined as
| CA = Cg/SBET |
Electrochemical impedance spectroscopy (EIS) measurements were conducted over a frequency range from 0.01 to 100 kHz with amplitude of 5 mV at open-circuit potential.
Conflicts of interest
The authors declare no conflict of interests.Acknowledgements
The Top-notch Academic Programs Project of Jiangsu Higher Education Institutions (TAPP) and the Priority Academic Program Development of Jiangsu Higher Education Institutions (PAPD).Notes and references
- A. Vlad and A. Balducci, Nat. Mater., 2017, 16, 161 CrossRef CAS PubMed.
- L. Borchhardt, Q. L. Zhu, X. D. Zhuang, K. Stefan, X. L. Feng and Q. Xu, et al., Mater. Today, 2017, 20, 592 CrossRef.
- J. J. Qian, X. Wang, L. L. Chau, L. F. Liang, T. T. Li and S. M. Huang, Cryst. Growth Des., 2018, 18, 2358 CrossRef CAS.
- T. Q. Lin, C. I. Wei, F. F. Xu and F. Q. Huang, et al., Science, 2015, 350, 1508 CrossRef CAS PubMed.
- L. L. Chai, L. J. Zhang, L. Q. Xu and S. M. Huang, et al., Carbon, 2019, 146, 248 CrossRef CAS.
- B. Rajesh and Z. Piotr, Nature, 2006, 443, 63 CrossRef PubMed.
- K. Gong, F. TDu, Z. Xia, M. Durstock and L. M. Dai, Science, 2009, 323, 760 CrossRef CAS PubMed.
- R. R. Salunkhe, Y. V. Kaneti, J. H. Kim and Y. Yamauchi, Acc. Chem. Res., 2016, 49, 2796 CrossRef CAS PubMed.
- L. J. Zhang, Z. X. Su, F. L. Jiang and M. C. Hong, et al., Nanoscale, 2014, 6, 6590 RSC.
- R. R. Salunkhe, Y. Kamachi, L. Torad Nagy, Z. Q. Sun, S. X. Dou and Y. Yamauchi, et al., J. Mater. Chem. A, 2014, 2, 19848 RSC.
- Y. Yang, Z. Lin, S. Gao and Q. W. Chen, et al., ACS Catal., 2016, 7, 469 CrossRef.
- I. Imaz, M. Rubio-Martinez, J.-Y. An, I. Sole-Font, N. L. Rosi and D. Maspoch, Chem. Commun., 2011, 47, 7287 RSC.
- P. C. Chan, Toxic. Rep. Ser., 2004, 67, 1 Search PubMed.
- C. Zhang, Y. C. Wang, B. An, R. Huang, C. Wang, Z. Zhou and W. Lin, Adv. Mater., 2017, 29, 1604556 CrossRef PubMed.
- Y. Pan, K. A. Sun, D. S. Wang, C. Chen and Y. D. Li, et al., J. Am. Chem. Soc., 2018, 140, 2610 CrossRef CAS PubMed.
- S. Proch, V. J. M. Rivera, T. Döring and R. Kempe, Z. Kristallogr. – New Cryst. Struct., 2008, 223, 55 CAS.
- Q. Wang, X. W. Lu and Z. D. Chen, Mater. Res. Express, 2017, 4, 025505 CrossRef.
- Y. He, S. Hwang, D. A. Cullen, D. J. Myers, D. Su, K. L. More and G. Wu, et al., Energy Environ. Sci., 2019, 12, 250 RSC.
- Y. Zhou, Y. Bai, Q. B. Wu and K. N. Sun, et al., ACS Appl. Mater. Interfaces, 2018, 10, 6245 CrossRef PubMed.
- I. González, J. D. Jesus and E. Canizales, Micron, 2011, 42, 819 CrossRef PubMed.
- H. R. Tian, S. Y. Xie, R. B. Huang and L. S. Zheng, et al., J. Am. Chem. Soc., 2019, 141, 6651 CrossRef CAS PubMed.
- C. L. Liu, H. Liang, D. Wu, X. Lu and Q. Wang, Adv. Electron. Mater., 2018, 4, 1800092 CrossRef.
- H. T. Sun, J. Zhu, D. Baumann, Y. Huang and X. F. Duan, Nat. Rev. Mater., 2019, 4, 45 CrossRef.
- A. C. Kathalikkattil, R. Roshan, D. W. Kim, S. J. Cho and P. Dae-Won, et al., Chem. Commun., 2016, 52, 280 RSC.
- D. W. Wang, F. Li, L. C. Yin and H. M. Cheng, et al., Chem.–Eur. J., 2012, 18, 5345 CrossRef CAS PubMed.
- S. Orsini, C. Duce and L. Bonaduce, J. Anal. Appl. Pyrolysis, 2018, 130, 62 CrossRef CAS.
- Y. Jiang, Y. P. Deng, Y. Bai, W. Chu and Z. W. Chen, Adv. Energy Mater., 2018, 8, 1702900 CrossRef.
- Q. Wang, Y. Xia and C. L. Jiang, CrystEngComm, 2014, 16, 9721 RSC.
- J. S. Wei, H. Ding, Y. G. Wang and H. M. Xiong, ACS Appl. Mater. Interfaces, 2015, 7, 5811 CrossRef CAS PubMed.
- M. D. Stoller and R. S. Ruoff, Energy Environ. Sci., 2010, 294, 1301 Search PubMed.
- J. Chmiola, G. Yushin, Y. Gogotsi, C. Portet, P. Simon and P. L. Taberna, Science, 2006, 313, 1760 CrossRef CAS PubMed.
- Z. Li, Z. W. Xu, J. Ding and D. Mitlin, et al., Energy Environ. Sci., 2014, 7, 1708 RSC.
- N. A. Kyeremateng, T. Brousse and D. Pech, Nat. Nanotechnol., 2017, 12, 7 CrossRef CAS PubMed.
- Y. H. Lu, S. L. Zhang, J. M. Yin and Y. S. Chen, et al., Carbon, 2017, 124, 64 CrossRef CAS.
- J. H. Zhang, D. L. Zhang, G. H. Dai and S. L. Qiu, Chin. J. Chem., 2016, 34, 203 CrossRef CAS.
Footnote |
| † Electronic supplementary information (ESI) available. See DOI: 10.1039/c9ra02533b |
| This journal is © The Royal Society of Chemistry 2019 |

