 Open Access Article
New chair shaped supramolecular complexes-based aryl nicotinate derivative; mesomorphic properties and DFT molecular geometry
H. A. Ahmed *ab,
M. Hagar
 *ac and
O. A. Alhaddadd
aCollege of Sciences, Chemistry Department, Taibah University, Yanbu, Saudi Arabia. E-mail: ahoda@sci.cu.edu.eg; mohamedhaggar@gmail.com
bFaculty of Science, Department of Chemistry, Cairo University, Cairo, Egypt
cFaculty of Science, Chemistry Department, Alexandria University, Alexandria, Egypt
dCollege of Sciences, Chemistry Department, Madina Monawara, Taibah University, Saudi Arabia
First published on 24th May 2019
Abstract
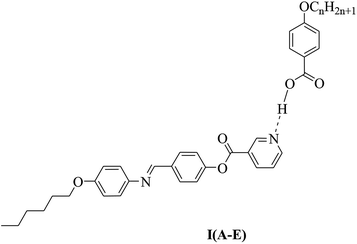
A new series of chair-shaped liquid crystalline complexes were formed through 1![[thin space (1/6-em)]](https://www.rsc.org/images/entities/char_2009.gif) :
:![[thin space (1/6-em)]](https://www.rsc.org/images/entities/char_2009.gif) 1 intermolecular hydrogen bonding between 4-(4-(hexyloxyphenylimino)methyl)phenyl nicotinate and 4-alkoxybenzoic acids, with different alkoxy chains. The mesomorphic behaviour of these supramolecular hydrogen-bonded complexes was investigated through differential scanning calorimetry and polarizing optical microscopy. The Fermi bands of the hydrogen bonding formation were confirmed through Fourier-transform infrared spectroscopy. Schlieren textures of the nematic phase (N) were observed for all prepared complexes. These thermotropic supramolecular complexes were confirmed also using density functional theory calculations. It was found that as the akoxy chain length increased the predicted total energy of the H-bonded complex also increased. The predicted data of the charge distribution explained the nematic mesophase which covered all 1
1 intermolecular hydrogen bonding between 4-(4-(hexyloxyphenylimino)methyl)phenyl nicotinate and 4-alkoxybenzoic acids, with different alkoxy chains. The mesomorphic behaviour of these supramolecular hydrogen-bonded complexes was investigated through differential scanning calorimetry and polarizing optical microscopy. The Fermi bands of the hydrogen bonding formation were confirmed through Fourier-transform infrared spectroscopy. Schlieren textures of the nematic phase (N) were observed for all prepared complexes. These thermotropic supramolecular complexes were confirmed also using density functional theory calculations. It was found that as the akoxy chain length increased the predicted total energy of the H-bonded complex also increased. The predicted data of the charge distribution explained the nematic mesophase which covered all 1![[thin space (1/6-em)]](https://www.rsc.org/images/entities/char_2009.gif) :
:![[thin space (1/6-em)]](https://www.rsc.org/images/entities/char_2009.gif) 1 mixtures and it could be attributed to more end-to-end aggregations of the alkoxy chains with longer chain lengths. Moreover, formation of the H-bonded complexes greatly affected polarizability with respect to the individual compounds. The polarizability increased three and one third times compared with that of the free acid and base, respectively.
1 mixtures and it could be attributed to more end-to-end aggregations of the alkoxy chains with longer chain lengths. Moreover, formation of the H-bonded complexes greatly affected polarizability with respect to the individual compounds. The polarizability increased three and one third times compared with that of the free acid and base, respectively.
1. Introduction
Molecular interactions resulting from hydrogen bonding liquid crystal systems1–6 recently have received more attention in applicable research. These types of mesomorphic materials involve non-covalent interactions and have potential applications for functional molecular structures. Molecular geometry is one of the important factors affecting the properties of liquid crystalline materials7–9 i.e., mesophase formation and stability. Supramolecular hydrogen bonding liquid crystals (SMHBLCs) are one of the most important inductions in chemical and biological processes for aggregation and association of molecules. SMHBLCs are mostly based on pyridyl and carboxylic derivatives, as proton acceptor and proton donor moieties, respectively.10–13 Schiff base compounds are widely used in many fields, such as catalytic reactions and photochemistry.14,15 Many Schiff bases with a low molar mass have been synthesized and investigated extensively for applications with liquid crystals.16–19 Generally, stability of a mesophase depends on the polarity and/or polarizability of the central part of the molecule. High demands of new SMHBLC complexes for applications has led to the preparation and study of numerous mesogens, particularly thermotropic liquid crystals.20–23 Several mesogenic homologous series containing ester/Schiff base central linkages have been widely reported.16,18,19,24–26 Most of the H-bonded mesogens studied are based on rod-like intermolecular H-bonding20–23,27,28 and there is an increasing interest for forming angular SMHBLCs through intermolecular hydrogen-bond formation.29,30Nowadays, designing materials according to computational prediction also has attracted high interest.24–26,31–37 To understand many optical properties requires simulated information about molecular geometries as well as energies of the molecular orbitals of liquid crystalline compounds. Recently, density functional theory (DFT) has become an effective method because of its excellent performance and consistent computational results.
Continuing our systematic work, the goal of the present study was to design new chair-form Schiff base/ester supramolecular materials with new mesomorphic and optical properties. A series of Schiff base/ester linkage derivatives I(A–E) were prepared through hydrogen-bonding formation between 4-(4-(hexyloxyphenylimino)methyl)phenyl nicotinate (I) as proton acceptors and 4-alkoxybenzoic acids (A–E) as proton donors (see the structure below) and their thermal and mesomorphic properties were investigated. In addition, we determined the effects of the length of alkoxy chains of the acid moiety on mesophase stability of the supramolecular complexes. On the other hand, we planned to use the DFT calculations to predict the thermal parameters of the free compounds as well as their supramolecular complexes. Moreover, the relationship between the experimental and the theoretical predictions confirmed our results, especially, the mesophase type and stability of the formed complexes.
2. Experimental
2.1. Materials
4-Alkoxybenzoic acids were obtained from Merck (Germany) while nicotinic acid, N,N′-dicyclohexylcarbodiimide (DCC), 4-hydroxybenzaldehyde, 4-hexyloxyaniline and 4-dimethylaminopyridine (DMAP) were purchased from Aldrich (Wisconsin, USA) and used as received. All solvents used were pure grade and purchased from Aldrich (Wisconsin, USA).A TA Instruments Co. Q20 Differential Scanning Calorimeter (DSC; USA) was used for calorimetric measurements. The DSC was calibrated using the melting temperature and enthalpy of indium and lead. The DSC investigation was carried out using small samples (2–3 mg) placed in aluminum pans. All measurements were achieved with a heating rate of 10 °C min−1 in an inert atmosphere of nitrogen (30 mL min−1) and all transitions were recorded with a second heating scan from room temperature to 280 °C.
Transition temperatures for the individual components and their 1![[thin space (1/6-em)]](https://www.rsc.org/images/entities/char_2009.gif) :
:![[thin space (1/6-em)]](https://www.rsc.org/images/entities/char_2009.gif) 1 associated complexes were determined by DSC, and types of the mesophase were identified with a standard polarised optical microscope (POM, Wild, Germany) attached to a Mettler FP82HT hot stage. The temperature was measured by a thermocouple attached to the temperature controller. Measurements were made twice and the results have an accuracy in the transition temperature within ±0.2 °C.
1 associated complexes were determined by DSC, and types of the mesophase were identified with a standard polarised optical microscope (POM, Wild, Germany) attached to a Mettler FP82HT hot stage. The temperature was measured by a thermocouple attached to the temperature controller. Measurements were made twice and the results have an accuracy in the transition temperature within ±0.2 °C.
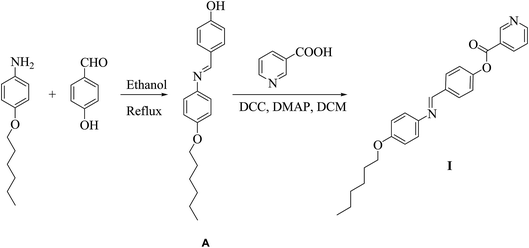
2.2. Preparation of pyridine-based derivative
![[thin space (1/6-em)]](https://www.rsc.org/images/entities/b_char_2009.gif) :
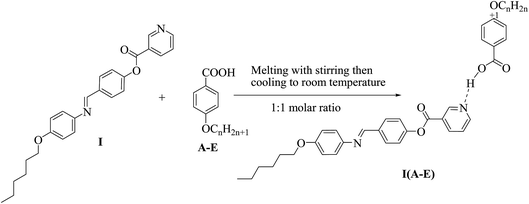
:![[thin space (1/6-em)]](https://www.rsc.org/images/entities/b_char_2009.gif) 1 supramolecular complexes. Supramolecular complexes (I(A–E)) in 1
1 supramolecular complexes. Supramolecular complexes (I(A–E)) in 1![[thin space (1/6-em)]](https://www.rsc.org/images/entities/char_2009.gif) :
:![[thin space (1/6-em)]](https://www.rsc.org/images/entities/char_2009.gif) 1 molar ratios of any two complementary components were prepared by melting appropriate amounts of each component, stirring to give an intimate blend and then, cooling with stirring to room temperature (Scheme 2).
1 molar ratios of any two complementary components were prepared by melting appropriate amounts of each component, stirring to give an intimate blend and then, cooling with stirring to room temperature (Scheme 2).
2.3. Characterization
Purity of I was preliminarily checked with thin-layer chromatography using TLC-sheets coated with silica gel (E. Merck) and the spots were detected by a UV-lamp. Their molecular formulae were confirmed via elemental analyses, Fourier-transform infrared spectroscopy (FTIR, Nicolet iS 10 Thermo scientific) and 1H-NMR spectroscopy (Varian EM 350L 300 MHz spectrometer, Oxford, UK).Formation of the supramolecular complexes (I(A–E)) were confirmed by DSC investigation as well as FTIR.
2.4. Computational methods and calculations
Theoretical calculations for the investigated compounds were carried out using Gaussian 09 software.38 DFT/B3LYP methods using the 6-31G (d,p) basis set was selected for the calculations. Geometries were optimized by minimizing the energies with respect to all geometrical parameters without imposing any molecular symmetry constraints. The structures of the optimized geometries were drawn with Gauss View.39 Moreover, the calculated IR frequencies were carried out using the same level of theory. The frequency calculations showed that all structures were stationary points in the geometry optimization method with no imaginary frequency.3. Results and discussion
3.1. Experimental and theoretical conformation of SMHBLCs formation
Infrared spectra measurements were performed for the individual components i.e., 4-alkoxybenzoic acids (A–E), 4-(4-(hexyloxyphenylimino)methyl)phenyl nicotinate (I) as well as to their supramolecular complexes (I(A–E)). The experimental data from the FTIR spectra of I and B and their complex IB are given in Fig. 1 as representative examples. The results revealed that the alkoxy chain length of the benzoic acids (A–E) had no significant effect on the wavenumber of the spectral band of C![[double bond, length as m-dash]](https://www.rsc.org/images/entities/char_e001.gif) O and were found at wavenumber 1680 cm−1. The dimeric form of the benzoic acid derivatives (A–E) under intermolecular hydrogen bonding between the carboxylic groups was replaced by another intermolecular hydrogen bonding between the pyridyl moiety of base I and the carboxylic acid. This new intermolecular hydrogen bonding was confirmed by experimental and theoretical data from IR spectra.
O and were found at wavenumber 1680 cm−1. The dimeric form of the benzoic acid derivatives (A–E) under intermolecular hydrogen bonding between the carboxylic groups was replaced by another intermolecular hydrogen bonding between the pyridyl moiety of base I and the carboxylic acid. This new intermolecular hydrogen bonding was confirmed by experimental and theoretical data from IR spectra.
The C![[double bond, length as m-dash]](https://www.rsc.org/images/entities/char_e001.gif) O stretching vibration is an important piece of evidence for identifying intermolecular H-bonding, where participation of the hydrogen atom from the O–H of the carboxylic group increases the strength of the C
O stretching vibration is an important piece of evidence for identifying intermolecular H-bonding, where participation of the hydrogen atom from the O–H of the carboxylic group increases the strength of the C![[double bond, length as m-dash]](https://www.rsc.org/images/entities/char_e001.gif) O group and consequently, its stretching is shifted to a higher wavenumber (ν = 1689 cm−1). This shift could be attributed to the fingerprint of a heterocomplex formation between the nicotinate and alkoxy acids. Moreover, the formation of the complex increases the strength of the C
O group and consequently, its stretching is shifted to a higher wavenumber (ν = 1689 cm−1). This shift could be attributed to the fingerprint of a heterocomplex formation between the nicotinate and alkoxy acids. Moreover, the formation of the complex increases the strength of the C![[double bond, length as m-dash]](https://www.rsc.org/images/entities/char_e001.gif) O of the ester linkage of the base and its wavenumber increased by 19 cm−1, ν = 1729 to 1748 cm−1. Additionally, the stretching vibration from the C
O of the ester linkage of the base and its wavenumber increased by 19 cm−1, ν = 1729 to 1748 cm−1. Additionally, the stretching vibration from the C![[double bond, length as m-dash]](https://www.rsc.org/images/entities/char_e001.gif) N of the pyridyl group was slightly decreased by only 4 cm−1 under H-bonding. On the other hand, it has been reported40–46 that three Fermi resonance vibration bands with A-, B-, and C-types of the hydrogen bonded OH groups are another important evidence for formation of the H-bonded complex. A vibrational peak which appeared and overlapped with that of the C–H bond vibrations could be attributed to the A-type Fermi band, while another at 2356 cm−1 corresponds to a B-type due to the O–H in-plane bending vibration as well as its fundamental stretch. However, a peak at 1911 cm−1 could be attributed to an interaction between the overtone of the torsional effect and the fundamental stretching vibration of the OH, C-type. The predicted values of the wavenumbers of the characteristic groups are tabulated in Table 1. The calculated values in Table 1 were scaled according to the reported method.47 The results of the DFT calculation of the predicted wavenumbers are consistent with the experimental data. The lower values of the theoretical wavenumbers could be attributed to absence of an intermolecular interaction between molecules in the gas phase that were used in the theoretical calculations.
N of the pyridyl group was slightly decreased by only 4 cm−1 under H-bonding. On the other hand, it has been reported40–46 that three Fermi resonance vibration bands with A-, B-, and C-types of the hydrogen bonded OH groups are another important evidence for formation of the H-bonded complex. A vibrational peak which appeared and overlapped with that of the C–H bond vibrations could be attributed to the A-type Fermi band, while another at 2356 cm−1 corresponds to a B-type due to the O–H in-plane bending vibration as well as its fundamental stretch. However, a peak at 1911 cm−1 could be attributed to an interaction between the overtone of the torsional effect and the fundamental stretching vibration of the OH, C-type. The predicted values of the wavenumbers of the characteristic groups are tabulated in Table 1. The calculated values in Table 1 were scaled according to the reported method.47 The results of the DFT calculation of the predicted wavenumbers are consistent with the experimental data. The lower values of the theoretical wavenumbers could be attributed to absence of an intermolecular interaction between molecules in the gas phase that were used in the theoretical calculations.
| Compound | O–Hacid | C![[double bond, length as m-dash]](https://www.rsc.org/images/entities/char_e001.gif) Oacid Oacid |
C–Oacid | C![[double bond, length as m-dash]](https://www.rsc.org/images/entities/char_e001.gif) Nbase Nbase |
C![[double bond, length as m-dash]](https://www.rsc.org/images/entities/char_e001.gif) Obase Obase |
C–Obase |
|---|---|---|---|---|---|---|
| I | 1620 (1591) | 1674 (1727) | 1286 (1269) | |||
| B | 3662 | 1666 (1680) | 1374 (1289) | |||
| IB | 2687 (2356) | 1669 (1689) | 1313 (1250) | 1590 (1605) | 1668 (1748) | 1278 (1250) |
3.2. Mesomorphic and optical properties of individual components and their complexes
Mesomorphic behaviors of the present phenyl nicotinate (I) and their 1![[thin space (1/6-em)]](https://www.rsc.org/images/entities/char_2009.gif) :
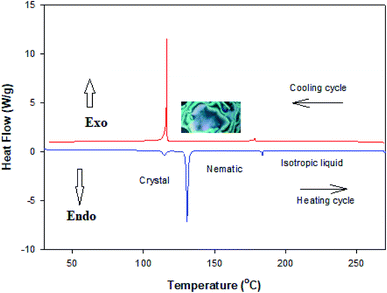
:![[thin space (1/6-em)]](https://www.rsc.org/images/entities/char_2009.gif) 1 supramolecular complexes (I(A–E)) were investigated by DSC and POM. Texture observations by POM were verified by DSC measurements and mesophase types were identified for individual and all prepared supramolecular complexes.
1 supramolecular complexes (I(A–E)) were investigated by DSC and POM. Texture observations by POM were verified by DSC measurements and mesophase types were identified for individual and all prepared supramolecular complexes.
| System | TCr–N | ΔHCr–N | TN–I | ΔHN–I | ΔS/RN–I |
|---|---|---|---|---|---|
| a Abbreviations: TCr–N = crystal to nematic phase transition; TN–I = nematic to isotropic liquid transition. ΔHCr–N = crystal to nematic phase transition; ΔHN–I = nematic to isotropic liquid transition. ΔS/RN–I = nematic to isotropic liquid transition. | |||||
| I | 130.7 | 35.52 | 184.6 | 1.91 | 1.24 |
| IA | 92.2 | 40.28 | 129.6 | 2.09 | 1.94 |
| IB | 91.7 | 52.48 | 128.1 | 3.41 | 3.21 |
| IC | 86.9 | 77.68 | 126.7 | 3.99 | 3.79 |
| ID | 92.5 | 90.23 | 125.3 | 4.04 | 3.88 |
| IE | 100.9 | 84.07 | 123.3 | 2.43 | 2.37 |
![[thin space (1/6-em)]](https://www.rsc.org/images/entities/b_char_2009.gif) :
:![[thin space (1/6-em)]](https://www.rsc.org/images/entities/b_char_2009.gif) 1) Molar supramolecular hydrogen-bonding complexes, I(A–E). While phenyl nicotinate I is purely nematogenic and the 4-n-alkoxybenzoic acids are mesomorphic with two mesophases, smectic C and nematic, the type of the phase depends on the terminal chain length.48 Therefore, it was interesting to investigate the mesomeric behavior of their angular supramolecular complexes (I(A–E)) to study the effect of the akoxy chain length of the acid moiety on the mesophase behavior of complexes prepared and predict the geometrical structures of the supramolecular complexes to deduce the most probable conformation shape. For the 1
1) Molar supramolecular hydrogen-bonding complexes, I(A–E). While phenyl nicotinate I is purely nematogenic and the 4-n-alkoxybenzoic acids are mesomorphic with two mesophases, smectic C and nematic, the type of the phase depends on the terminal chain length.48 Therefore, it was interesting to investigate the mesomeric behavior of their angular supramolecular complexes (I(A–E)) to study the effect of the akoxy chain length of the acid moiety on the mesophase behavior of complexes prepared and predict the geometrical structures of the supramolecular complexes to deduce the most probable conformation shape. For the 1![[thin space (1/6-em)]](https://www.rsc.org/images/entities/char_2009.gif) :
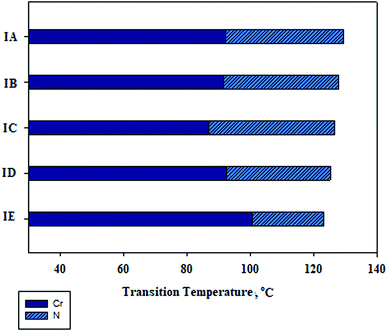
:![[thin space (1/6-em)]](https://www.rsc.org/images/entities/char_2009.gif) 1 molar supramolecular complexes I/A–E, transition temperatures and their corresponding enthalpy of transitions also were collected in Table 2. Phase transition temperatures are graphically represented in Fig. 3. As seen from Table 2 and Fig. 3, as the alkoxy chain length (n) increased the melting temperatures of the prepared compounds were irregularly changed and the mesophase stability decreased. Moreover, all complexes that exhibited nematogenic mesophases appeared enantiotropically. Supramolecular hydrogen-bonding complexes (IA, IB, IC, ID and IE), exhibited mesophase thermal stabilities of 37.4, 36.4, 39.8, 32.8, and 22.4 °C upon heating, respectively. Fig. 3 also shows that for a given pyridine-based complement, the IC mixture exhibits the lowest melting temperature in addition to a wide nematic phase range which was constructed via intermolecular hydrogen bonding. It is obvious that the N thermal transition decreases gradually with increasing alkoxy chain length (n) in agreement with previously reported data by Gary et al.49 and Imire et al.50 The display of N phases and their stability is ascribed to protracted molecular lengths which increase the polarity to polarizability ratio, permanent dipole moment, dipole–dipole interactions and intermolecular dispersion forces.24 As the lengths of alkoxybenzoic acids terminals increase the central core rigidity of the supramolecular H-bonding will decrease, consequently, the linearity of the complexes decreases to some extent due to the greater number of configurations of the chains and then a strong terminal interaction predominates to give a nematic phase. Representative textures of the mesophases under a polarizing optical microscopic are shown in Fig. 4.
1 molar supramolecular complexes I/A–E, transition temperatures and their corresponding enthalpy of transitions also were collected in Table 2. Phase transition temperatures are graphically represented in Fig. 3. As seen from Table 2 and Fig. 3, as the alkoxy chain length (n) increased the melting temperatures of the prepared compounds were irregularly changed and the mesophase stability decreased. Moreover, all complexes that exhibited nematogenic mesophases appeared enantiotropically. Supramolecular hydrogen-bonding complexes (IA, IB, IC, ID and IE), exhibited mesophase thermal stabilities of 37.4, 36.4, 39.8, 32.8, and 22.4 °C upon heating, respectively. Fig. 3 also shows that for a given pyridine-based complement, the IC mixture exhibits the lowest melting temperature in addition to a wide nematic phase range which was constructed via intermolecular hydrogen bonding. It is obvious that the N thermal transition decreases gradually with increasing alkoxy chain length (n) in agreement with previously reported data by Gary et al.49 and Imire et al.50 The display of N phases and their stability is ascribed to protracted molecular lengths which increase the polarity to polarizability ratio, permanent dipole moment, dipole–dipole interactions and intermolecular dispersion forces.24 As the lengths of alkoxybenzoic acids terminals increase the central core rigidity of the supramolecular H-bonding will decrease, consequently, the linearity of the complexes decreases to some extent due to the greater number of configurations of the chains and then a strong terminal interaction predominates to give a nematic phase. Representative textures of the mesophases under a polarizing optical microscopic are shown in Fig. 4.
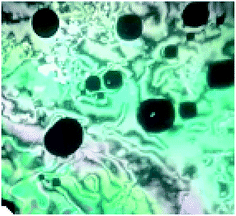 | ||
| Fig. 4 Nematic mesophase texture under a polarized optical microscope for supramolecular complex IB at 126 °C upon heating. | ||
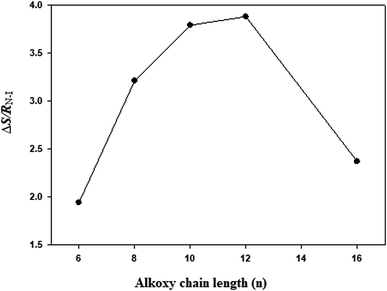
Entropies of the nematic–isotropic transitions (ΔS/RN–I) were calculated for all the supramolecular mixtures. The results are tabulated in Table 2, and represented graphically as a function of the acid alkoxy-chain length (n) in Fig. 5. From the results of Table 2, the entropy change (ΔS/RN–I, Fig. 5) increases with the increments of the alkoxy chain n up to n = 12 carbons (ΔS/RN–I = 3.88) then jumps to decrease at n = 16 (ΔS/RN–I = 2.37). That irregular relation is due to an increase of the end-to-end aggregation of molecules with an increase in acid alkoxy-chain length as a result of the formation of the less ordered N phase. That arrangement of molecules led to a decrease of the apparent dipole moment value of their observed nematic mesophase. Moreover, the entropy changes during phase transitions are relatively high which is attributed to a high conjugative interaction with the mesogenic portion of the molecules.
3.3. DFT calculations
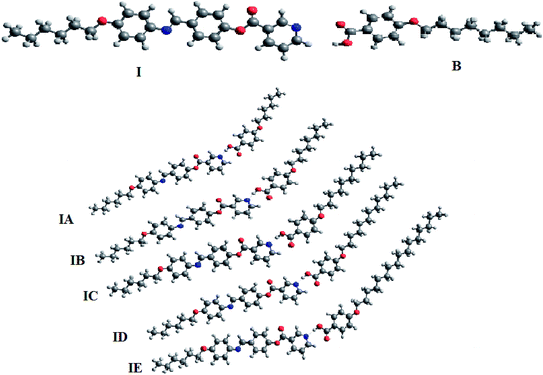
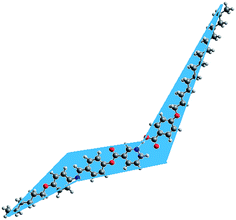
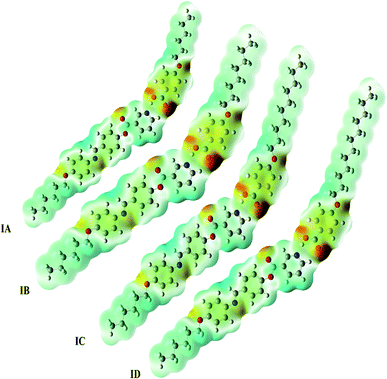
As shown from Fig. 6, although acid B and base I have linear shapes, the geometry of the prepared complexes is not linear. All of them take a non-linear shape which could be considered a “chair form” (Fig. 7). This geometry could illustrate the covering of the nematic phases for all prepared H-bended complexes for all chain lengths. It is well known48 that 4-alkoxy acids with a shorter chain length (n = 6) exhibit a nematic phase while the longest alkoxy chain length (n = 16) is smectogenic and exhibits only the smectic phase. This data could be explained in terms of an increment of the lateral interaction as the chain length increases. The linear shape of the acids permits the maximum side–side interaction. Similarly, due to the short chain length of the base, the strong end to end aggregation of the chains could be the overriding effect of the nematic mesophase of the base. However, the chair forms of the prepared complexes do not permit the strong lateral interaction, thus leaving end to end aggregation of the chains to be the pronounced interaction. This projection could be a good explanation for the nematic mesophases observed for all alkoxy chain lengths of the H-bonded complexes.
| Parameter | IA | IB | IC | ID | IE |
|---|---|---|---|---|---|
| a ZPVE: sum of electronic and zero-point energies; Etot: sum of electronic and thermal energies; H: sum of electronic and thermal enthalpies; G: sum of electronic and thermal free energies. | |||||
| Ecorr | 0.752451 | 0.809630 | 0.866701 | 0.923748 | 1.038004 |
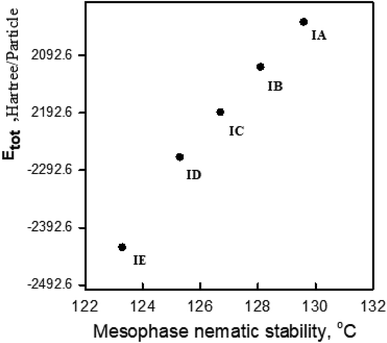
| ZPVE | −2034.600163 | −2113.167181 | −2191.734306 | −2270.301442 | −2427.435932 |
| Etot | −2034.554664 | −2113.119003 | −2191.683399 | −2270.247803 | −2427.376020 |
| H | −2034.553720 | −2113.118058 | −2191.682454 | −2270.246859 | −2427.375075 |
| G | −2034.691970 | −2113.262393 | −2191.833640 | −2270.404840 | −2427.549529 |
| ΔH | 392.82136 | 314.25702 | 235.69262 | 157.12822 | 0 |
| I | B | IA | IB | IC | ID | IE | ||
|---|---|---|---|---|---|---|---|---|
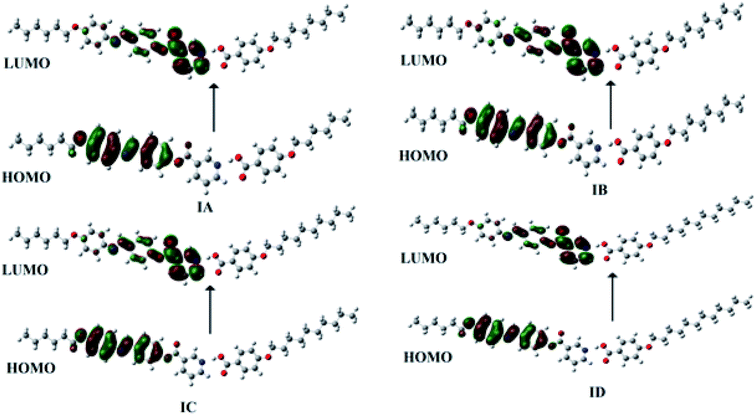
| ELUMO | −0.08566 | −0.102238 | −0.09260 | −0.09236 | −0.09241 | −0.09252 | −0.09325 | |
| EHOMO | −0.21264 | −0.229590 | −0.21643 | −0.21639 | −0.21641 | −0.21645 | −0.21483 | |
| ΔEHOMO–LUMO | 0.12698 | 0.127352 | 0.12383 | 0.12403 | 0.12400 | 0.12393 | 0.12158 | |
| μ | X | −3.1834 | 1.432154 | −4.7983 | 4.6656 | −4.6721 | −4.7045 | 4.3046 |
| Y | −3.3243 | 0.8944709 | 0.4310 | −0.5293 | −0.6937 | −0.8832 | −1.2000 | |
| Z | 0.1063 | 0.0782323 | −0.0001 | −0.0002 | 0.0004 | −0.0004 | 0.4717 | |
| Total | 4.6039 | 4.2964 | 4.8176 | 4.6955 | 4.7233 | 4.7867 | 4.4936 | |
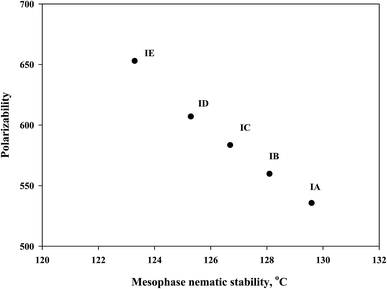
| Polarizability α | 353.77 | 182.53 | 535.49 | 559.57 | 583.29 | 606.86 | 652.76 | |
4. Conclusions
A new series of chair conformation supramolecular hydrogen bonded complexes were formed between the Schiff base of a phenyl nicotinate derivative and 4-alkoxybenzoic acids. All complexes exhibited a nematic phase with suitable mesophase ranges of stability. DSC and DFT calculation results revealed that as the length of the alkoxy chain increases the predicted total thermal energy and the polarizability also increases with a decrease in the nematic mesophase stability. It may be concluded that the development of these new soft materials, with different conformers with flexible terminals of a certain molecular geometry, may attract the attention of researchers for promising phase transition phenomena.Conflicts of interest
There are no conflicts to declare.Acknowledgements
Authors gratefully acknowledge the Deanship of Scientific Research, Taibah University for support of our research group (60333).References
- J.-M. Lehn, Makromol. Chem., Macromol. Symp., 1993, 69, 1–17 CrossRef CAS.
- T. Kato, M. Fukumasa and J. M. Frechet, Chem. Mater., 1995, 7, 368–372 CrossRef CAS.
- D. Demus, J. W. Goodby, G. W. Gray, H. W. Spiess and V. Vill, Low Molecular Weight Liquid Crystals II, Handbook of Liquid Crystals, John Wiley & Sons, vol. 2B, 2011 Search PubMed.
- T. Kato, N. Hirota, A. Fujishima and J. M. Fréchet, J. Polym. Sci., Part A: Polym. Chem., 1996, 34, 57–62 CrossRef CAS.
- C. M. Paleos and D. Tsiourvas, Angew. Chem., Int. Ed. Engl., 1995, 34, 1696–1711 CrossRef CAS.
- A. J. Thote and R. B. Gupta, Ind. Eng. Chem. Res., 2003, 42, 1129–1136 CrossRef CAS.
- S. Xiao, Y. Zou, J. Wu, Y. Zhou, T. Yi, F. Li and C. Huang, J. Mater. Chem., 2007, 17, 2483–2489 RSC.
- S. Kohmoto, Y. Someya and K. Kishikawa, Liq. Cryst., 2010, 37, 209–216 CrossRef CAS.
- M. Alaasar, C. Tschierske and M. Prehm, Liq. Cryst., 2011, 38, 925–934 CrossRef CAS.
- T. Kato, N. Mizoshita and K. Kanie, Macromol. Rapid Commun., 2001, 22, 797–814 CrossRef CAS.
- T. Kato, Science, 2002, 295, 2414–2418 CrossRef CAS PubMed.
- A. Martinez-Felipe, F. Brebner, D. Zaton, A. Concellon, S. Ahmadi, M. Piñol and L. Oriol, Molecules, 2018, 23, 2278 CrossRef PubMed.
- T. Kato, J. M. J. Frechet, P. G. Wilson, T. Saito, T. Uryu, A. Fujishima, C. Jin and F. Kaneuchi, Chem. Mater., 1993, 5, 1094–1100 CrossRef CAS.
- T. Kato and J. M. Frechet, J. Am. Chem. Soc., 1989, 111, 8533–8534 CrossRef CAS.
- M. M. Prasad, M. M. Mohan, P. Chalapathi, A. A. Kumar and D. Potukuchi, J. Mol. Liq., 2015, 207, 294–308 CrossRef.
- T. Vasanthi, P. Subhasri, R. Jayaprakasam and V. Vijayakumar, Phase Transitions, 2019, 92, 229–248 CrossRef CAS.
- P. Popov, E. K. Mann and A. Jákli, J. Mater. Chem. B, 2017, 5, 5061–5078 RSC.
- M. H. Kishor and M. M. Mohan, J. Mol. Liq., 2019, 273, 504–524 CrossRef CAS.
- Y. Arakawa, Y. Sasaki and H. Tsuji, J. Mol. Liq., 2019, 280, 153–159 CrossRef CAS.
- M. M. Naoum, A. A. Fahmi, M. A. Alaasar and R. A. Salem, Thermochim. Acta, 2011, 517, 63–73 CrossRef CAS.
- M. M. Naoum, A. A. Fahmi, S. Z. Mohammady and A. H. Abaza, Liq. Cryst., 2010, 37, 475–486 CrossRef CAS.
- H. Ahmed, M. Hagar, M. Alaasar and M. Naoum, Liq. Cryst., 2019, 46, 550–559 CrossRef CAS.
- H. A. Ahmed, M. Hagar and A. Aljuhani, RSC Adv., 2018, 8, 34937–34946 RSC.
- H. A. Ahmed, M. Hagar, T. H. El-Sayed and R. B. Alnoman, Liq. Cryst., 2019, 1–11, DOI:10.1080/02678292.2019.1566581.
- M. Hagar, H. A. Ahmed and G. R. Saad, J. Mol. Liq., 2019, 273, 266–273 CrossRef CAS.
- M. Hagar, H. A. Ahmed and G. R. Saad, Liq. Cryst., 2018, 45, 1324–1332 CrossRef CAS.
- H. A. Ahmed and M. M. Naoum, Thermochim. Acta, 2014, 575, 122–128 CrossRef CAS.
- H. A. Ahmed, M. M. Naoum and G. R. Saad, Liq. Cryst., 2016, 43, 1259–1267 CrossRef CAS.
- H. A. Ahmed and M. M. Naoum, Liq. Cryst., 2016, 43, 222–234 CrossRef CAS.
- M. Hagar, H. A. Ahmed and O. A. Alhaddad, Liq. Cryst., 2019, 1–12, DOI:10.1080/02678292.2019.1581290.
- M. Hagar, H. Ahmed and O. Alhaddadd, Crystals, 2018, 8, 359 CrossRef.
- R. Chen, Z. An, W. Wang, X. Chen and P. Chen, Liq. Cryst., 2017, 44, 1515–1524 CrossRef CAS.
- M. Hagar, H. A. Ahmed and O. A. Alhaddadd, Crystals, 2018, 8, 359 CrossRef.
- H. A. Ahmed, M. Hagar and G. Saad, Liq. Cryst., 2019, 1–11 CAS.
- D. A. Paterson, M. Gao, Y.-K. Kim, A. Jamali, K. L. Finley, B. Robles-Hernández, S. Diez-Berart, J. Salud, M. R. de la Fuente and B. A. Timimi, Soft Matter, 2016, 12, 6827–6840 RSC.
- D. D. Sarkar, R. Deb, N. Chakraborty, G. Mohiuddin, R. K. Nath and V. R. Nandiraju, Liq. Cryst., 2013, 40, 468–481 CrossRef CAS.
- K. Majumdar, S. Mondal and R. K. Sinha, New J. Chem., 2010, 34, 1255–1260 RSC.
- M. Frisch, G. Trucks, H. B. Schlegel, G. Scuseria, M. Robb, J. Cheeseman, G. Scalmani, V. Barone, B. Mennucci and G. Petersson, Gaussian 09, Revision A. 02, Gaussian, Inc., Wallingford, CT, 2009, p. 200 Search PubMed.
- R. Dennington, T. Keith and J. Millam, GaussView, Version 5, Semichem Inc., Shawnee Mission, 2009 Search PubMed.
- W. Cleland and M. M. Kreevoy, Science, 1994, 264, 1887–1890 CrossRef CAS PubMed.
- M. Lizu, M. Lutfor, N. Surugau, S. How and S. E. Arshad, Mol. Cryst. Liq. Cryst., 2010, 528, 64–73 CrossRef CAS.
- A. Martinez-Felipe, A. G. Cook, J. P. Abberley, R. Walker, J. M. Storey and C. T. Imrie, RSC Adv., 2016, 6, 108164–108179 RSC.
- A. Martínez-Felipe and C. T. Imrie, J. Mol. Struct., 2015, 1100, 429–437 CrossRef.
- A. Ghanem and C. Noel, Mol. Cryst. Liq. Cryst., 1987, 150, 447–472 Search PubMed.
- D. A. Paterson, A. Martínez-Felipe, S. M. Jansze, A. TM Marcelis, J. MD Storey and C. T. Imrie, Liq. Cryst., 2015, 42, 928–939 CAS.
- R. Walker, D. Pociecha, J. Abberley, A. Martinez-Felipe, D. Paterson, E. Forsyth, G. Lawrence, P. Henderson, J. Storey and E. Gorecka, Chem. Commun., 2018, 54, 3383–3386 RSC.
- M. P. Andersson and P. Uvdal, J. Phys. Chem. A, 2005, 109, 2937–2941 CrossRef CAS PubMed.
- M. M. Naoum, A. A. Fahmi, A. A. Refaie and M. A. Alaasar, Liq. Cryst., 2012, 39, 47–61 CrossRef CAS.
- G. W. Gray, Molecular structure and the properties of liquid crystals, Academic press, 1962 Search PubMed.
- C. Imrie and L. Taylor, Liq. Cryst., 1989, 6, 1–10 CrossRef CAS.
- I.-C. Khoo and S.-T. Wu, Optics and nonlinear optics of liquid crystals, World Scientific, 1993 Search PubMed.
- D. S. Chemla, Nonlinear optical properties of organic molecules and crystals, Elsevier, 2012 Search PubMed.
- G. R. Meredith, J. VanDusen and D. J. Williams, Macromolecules, 1982, 15, 1385–1389 CrossRef CAS.
- C.-L. Wei, T.-C. Chen, P. Raghunath, M.-C. Lin and H.-C. Lin, RSC Adv., 2015, 5, 54629–54637 RSC.
- S. M. Jansze, A. Martínez-Felipe, J. M. D. Storey, A. T. M. Marcelis and C. T. Imrie, Angew. Chem., Int. Ed., 2015, 54, 643–646 CAS.
| This journal is © The Royal Society of Chemistry 2019 |

