DOI:
10.1039/C9RA02775K
(Paper)
RSC Adv., 2019,
9, 15785-15790
A practical adsorption model for the formation of submerged oils under the effect of suspended sediments
Received
12th April 2019
, Accepted 14th May 2019
First published on 21st May 2019
Abstract
Oil sediment interactions play an important role in the formation of submerged oils in coastal marine environments. Thus, the formation processes of submerged oils under the effect of suspended sediments were investigated in this study. Batch experiments were conducted to assess the role of adsorption processes on the suspended sediments in controlling levels of formation of submerged oils using three kind of Bohai crude oils [obtained from the Liaohe oilfield (LX), Bohai south regional oilfield (YYH) and Bohai central regional oilfield (YYS)]. The results showed that the saturated adsorption capacities by sandy sediments were 568, 429 and 352 mg g−1 for LX, YYH and YYS, respectively. Kinetic studies showed that the adsorption rate was about 0.002 mg g−1 min−1 in the first 200 minutes, and the maximum proportion of the submerged oils formed was 43%, 40% and 34% for LX, YYH and YYS, respectively. Partitioning of oils occurs between solid and solution phases during the oil sediment interactions, and always involving a distribution coefficient (Kd). Importantly, an adsorption model was proposed in this study for predicting the formation of submerged oils with most of the experimental data fitting the model defined by a zone with Kd values of 0.5 and 1.5 mL mg−1. Those results can help assess the fate and distribution of oil leakages in marine environments.
1. Introduction
Spills of petroleum involving human activities (e.g. oil production and transport) are causing more rapid input of crude oil into the marine system.1 The number of marine oil spill accidents has been increasing, for example in China, more than 3000 oil spill pollution accidents occurred during the last 40 years, which can cause serious ecological and environmental damage to the marine environments. Furthermore, it can also cause imbalance of regional marine ecological system. Not all the spilled oils remained in the surface water, a portion of those oils may further interact with suspended sediments, became negatively buoyant and sank to the bottom, and forming the submerged oils.2 Even no oil leakages, the submerged oils formed from the past oil spills can persist for an extended period of time in the marine environments, and it may float on shoreline again, thus bring severe long-term impacts on the local ecosystem and economy.3 The potential for direct negative effects to human health and safety and to aquatic ecosystems is especially high when an oil spill occurs near inland waterways. However, the amount of submerged oils formation is being debated based on actual oil spills, which is also difficult to track and locate.4
Most of submerged oils are formed in nearshore environments where breaking waves and other turbulent shoreline forces facilitate the interaction of suspended sediments with the dispersed oils.5 Research activities and advancements for understanding the formation of submerged oils in aqueous systems have intensified in the recent years. The adsorption processes of dispersed oil droplets by suspended sediments could lead the spilled oil settle onto the bottom, and this oil sediment interactions have been posited to play an important role in dispersing oils in marine environments.6 For example, experimental studies showed that about 50% of the dispersed oils into water column could be removed by suspended sediments.7 Muschenheim and Lee (2002) postulated partitioning of oils onto sediments as a major removal pathway, and discussed the role of adsorption processes that influence floating oil removal by particulate matter.8 Sun et al. (2010) reported that the removal of oil increased from 23% to 31%, and further to 37% when sediment concentration was increased to 100, 200 and 400 mg L−1, respectively.9 The sediment type, oil type, water salinity, the use of chemical dispersants, etc. are important factors controlling the oil sediment interactions.6,10–12 In marine environments, suspended sediment concentrations change with time due to sediment deposition and re-suspension to and from the seabed. The need to accurately model the fate and transport of spilled oils by suspended sediments is apparent when evaluating the risks of a potential spill or planning the response to an actual spill.13,14 However, studies simulate oil sediment interactions and transport are limited, as are the parameters required to initiate transport models capable of prediction.15
The over-arching objective of this study was to simulate oil sediment interactions and formation of submerged oils, to develop an adsorption model to calculate the formation of submerged oils under the effect of suspended sediments. In detail, sediments from Huanghe were collected to study the isotherms and kinetics parameters of oils adsorption at sediment–water interface. A model was proposed to quantitative analysis the formation of submerged oils based on the partitioning of oils between solid and solution phases with a distribution coefficient. This investigation would be important for better understanding of the submerged oils formation and can improve risk assessments for environments where there is possibility of oil leakages.
2. Experimental
2.1. Seawater, sediments, and oils
Natural seawater (salinity of 31.6 and pH of 7.8) was collected from the black rock reef area, Dalian, China (31.87°N, 121.55°E). The seawater was filtered with a 0.45 μm polycarbonate filter to remove large particles.
Sandy sediments used in the experiments were collected in the intertidal zone of the Yellow River mouth, Dongying, China (37.73°N, 119.16°E). After collection, the sediments were dried and passed through a sieve to separate particles by size (<200 μm).
Three kind of Bohai crude oils were employed in this study, which were obtained from the Liaohe oilfield (LX), Bohai south regional oilfield (YYH) and Bohai central regional oilfield (YYS), respectively. These oils were chosen due to their significant differences in viscosity and asphaltene content. Physicochemical properties of the three test oils are listed in Table 1, and the resolved n-alkanes of the test oils are plotted in Fig. 1. The oil hydrocarbon distributions were measured using an Agilent 6890 Gas Chromatograph equipped with a Flame-Ionization Detector (GC-FID). Parameters of GC-FID analysis were described in Wang et al. (2019),16 and the distribution of n-alkanes were resolved using a certified reference material (C8–C40 alkane mixture, Sigma-Aldrich). The resolved n-alkanes of the test oils are distributed in the C8 to C32 carbon range with the maxima being around C20 to C30.
Table 1 Physicochemical properties of three test oils
| Test oils |
Density (20 °C, g mL−1) |
Viscosity (50 °C, mm2 s−1) |
Asphaltenes (%) |
| LX |
0.8354 |
4.2 |
0.2 |
| YYH |
0.8804 |
11.1 |
1.1 |
| YYS |
0.9343 |
138.3 |
6.7 |
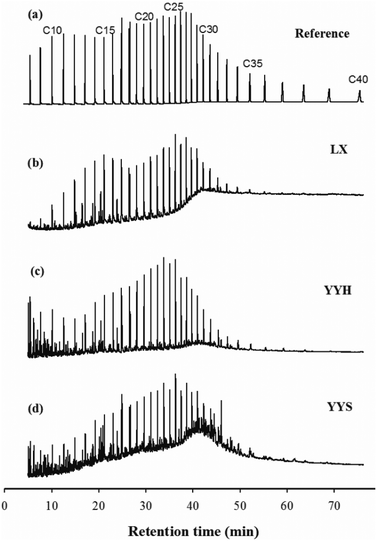 |
| | Fig. 1 Chromatograms (distribution of n-alkanes for the test oils). | |
2.2. Experimental design
Experiments simulated the oil sediment interactions were achieved using a temperature controlled reciprocating shaker at room temperature (∼25 °C, Table 2). To each 250 mL baffle flask were added 150 mL seawater, sediment was added to the system to simulate different turbidity suspensions, and then a certain amount of oil was dispensed into the suspensions using pre-calibrated pipettes. The flasks were placed on the reciprocating shaker and shaken for a given time to generate submerged oils. After the preset shaking time, the oil–sediment–seawater suspensions were allowed to settle overnight in a refrigerator to allow resurfacing of free oil droplets and stabilization of the submerged oils. After that, the submerged oils (dispersed oils trapped in the sunken oil sediment mixtures) were separated from the suspensions for oil extraction. For separating, the non-dispersed floating oils were removed firstly without disturbing the oil sediment mixtures using a pipette, the oil sticking on the container walls were also removed with polypropylene absorbent pads. The sunken oil sediment mixtures was then carefully transferred to a separatory funnel, extracted with n-hexane using a liquid/liquid extraction procedure. The oil content was determined using UV spectrophotometry based on the specifications for marine monitoring at a wavelength of 225 nm (GB17378.4-2007). An internal reference sample was measured prior to each sample analysis, and this standard was a sub-sample prepared by dissolving 50 mg of the test crude oil in 500 mL n-hexane. It should to be note that the sample extracts which were too concentrated to be read on the instrument were diluted as needed. Three replicates and control experiments were performed, and twice standard deviation was used as the error bar to improve the quality of the experimental data.
Table 2 Experimental conditions
| Factorial levels |
Experiment 1 |
Experiment 2 |
Experiment 3 |
| Oil type |
LX, YYH, YYS |
LX, YYH, YYS |
LX, YYH, YYS |
| Oil concentration (mg L−1) |
50, 100, 300, 500, 1000, 2000 |
500 |
500 |
| Shaking time (min) |
30 |
5, 10, 20, 30, 60, 120, 180 |
30 |
| Sediment concentration (mg L−1) |
500 |
500 |
50, 100, 300, 500, 800, 1000 |
The magnitude of submerging in the study was measured using the following equation, which represented the ratio between the content of the oil adsorbed by sediments and the content of the oil initially introduced into the reaction chamber.
| |
 | (1) |
where
Cp is the mass of the submerged oils (mg L
−1),
C0 is the mass of oil initially added in total concentration (mg L
−1).
3. Results and discussion
3.1. Morphology of the submerged oils
The dispersed oil droplets can be readily adsorbed by sediments in turbulent environments. Observations have shown that the oil droplets and sandy sediments aggregate after interaction, and the aggregates settled onto the bottom as the submerged oils. The morphology of the submerged oils' structure in the experiments was examined using epi-fluorescence microscopy. The surfaces of the dispersed oil droplets were covered with particles and formed an oil-in-SPM morphology (Fig. 2). The submerged oils were presented in single or multiple form aggregates, the amorphous aggregates were typically not spherical, and the single oil droplet surrounded by particles were generally <1 mm in size. When the submerged oils were formed, the oils in the mixtures became less sticky and more stable, which allows them to be transported or dispersed through a wide area. Worse, it is a detrimental process because these aggregates hinder the degradation of oil and can lead to the periodic reoiling of the shoreline for years following a spill.5
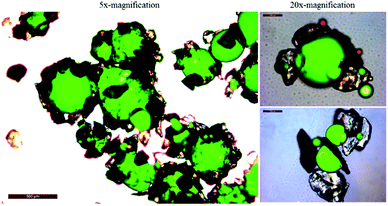 |
| | Fig. 2 Submerged oils formed observed by UV epi-fluorescence. Fluorescing green indicates the oil droplets. | |
3.2. Adsorption isotherms
The isothermal adsorption method is usually used to describe the relationship between the equilibrium adsorption capacity of an absorbent (in this case sandy sediments) and the equilibrium concentration of the adsorbates (oils). Two widely used models: Langmuir and Freundlich were applied for the fitting of the experimental data.17,18
The Langmuir isotherm is expressed by the following equation, which is based on the assumption of monolayer adsorption on a homogeneous surface.
| |
 | (2) |
where
Qe is the amount of oil adsorbed by sediments (mg g
−1),
Cs is the equilibrium concentration of oil in solution (mg L
−1),
Qm is the maximum adsorption capacity (mg g
−1) and
A is the constant related to the adsorption processes.
The Freundlich isotherm is a multilayer type isotherm, typical for moderate interaction between adsorbent and adsorbate,
where
Kf and
n are empirical coefficients related to the adsorption and have no definite physical significance.
The isothermal adsorption curves were analyzed by Langmuir and Freundlich equations (Fig. 3), and the model parameters were calculated and summarized in Table 3. Satisfactory fitting of the experimental data with the Langmuir isotherm was obtained for all the three test oils (r2 > 0.99), the correlation coefficient is preferably less than 0.96 when fitted by Freundlich isotherm, indicating the good application of Langmuir model. Besides, the maximum adsorption capacity by sandy sediments calculated from the Langmuir isotherm were 568, 429 and 352 mg g−1 for LX, YYH and YYS, respectively, which approaches the experimental data. These results showed that oil adsorption was mainly adsorbed in monolayer coverage manner.19 Generally, the isotherm-fitting between the experimental data and models was merely a mathematical model and could not provide any strong evidence of the actual adsorption mechanism.20 Nonetheless, compared with other literature reports, the adsorption capacity obtained from this study is at the same level, for example 228 mg g−1 for Oman crude oil by sandy sediments.21 Additionally, equilibrium adsorption concentration decreased with viscosity increasing, because the mechanical break-up of oil slick is dependent on the viscosity, the viscosity of the oil functions as a resistance force, thereby limiting transport speed.22
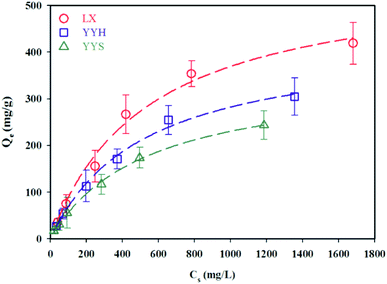 |
| | Fig. 3 Adsorption isotherms of the three test oils. Note: the dash lines are the fitted line using the Langmuir isotherm. | |
Table 3 Adsorption isotherm for different oil species
| Oils |
Langmuir isotherm |
| Qm |
A |
r2 |
| LX |
568 |
538 |
0.994 |
| YYH |
429 |
519 |
0.992 |
| YYS |
352 |
530 |
0.997 |
| Oils |
Freundlich isotherm |
| Kf |
n |
r2 |
| LX |
10.9 |
0.50 |
0.924 |
| YYH |
7.2 |
0.52 |
0.956 |
| YYS |
4.8 |
0.56 |
0.961 |
3.3. Time-scale for the formation of submerged oils
Adsorption kinetics could help in prediction of adsorption rate and provides useful information about the mechanism of adsorption. The experiment simulated the mixing effect in the ocean, the variation of submerged oils with mixing time was used to evaluate the kinetics of submerged oils formation (Fig. 4). The adsorption kinetics of oils by sediments were similar, while contents of oils adsorbed by sediments were increasing with time, and generally approached to dynamic equilibrium within 200 min. The best curve fit to the observed data showed that the variations of E with mixing time could be described by formula (4),| |
 | (4) |
where Emax (%) is the maximum proportion of submerging of test oils and k (mg g−1 min−1) is the adsorption rate constants.
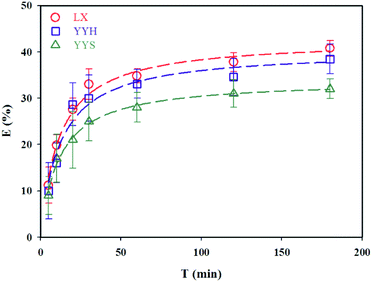 |
| | Fig. 4 The kinetics of submerged oil formation for the three test oils. Note: the dashed lines are fitted by eqn (4). | |
Typically, the submerged oils are formed in two consecutive steps: oils are broken into oil droplets firstly, and then the oil droplets interact with sediments to form submerged oils. The main affecting parameters for this processes are the mixing energy, mixing time and oil viscosity,6 etc. Because the mixed oscillating energy of this study is higher, the process of dispersing oil film into oil droplets is basically negligible. The effect of oil properties on the formation process of submerged oil becomes more significant, and it is found that the lower viscosity of the test oils, the easier it is to sink. It is easier to disperse into oil droplets in water for oils with low viscosity, which increases the chance of oil droplets colliding with suspended particles and contributes to submerged oils formation.23 The corresponding parameters are shown in Table 4. The maximum proportion of submerging is 43%, 40% and 34% for LX, YYH and YYS, respectively. These results are similar to those reported for other systems: 50–80% for sediment concentration of 230 mg L−1 with different size and approximately 37% for sediment concentration of 400 mg L−1.9,25 The adsorption rate obtained from this study is about 0.002 mg g−1 min−1. The results showed that the theoretical proportion of submerged oils formation predicted by this modified hyperbola kinetic equation (eqn (4)) could be matched with the experimental data well. Our results is significantly lower than what Khelifa et al. (2005) and Sun et al. (2010) reported in a similar study, which data showed that the equilibrium time was more than 3 h.9,24 It is supported that the sediment type and size may affect the timescale for submerged oils formation, also increasing the sediment concentration can accelerate this process.21,25,26
Table 4 Parameters of the three test oils fitted to time series data
| Oils |
Emax |
k |
r2 |
| LX |
43 |
0.002 |
0.987 |
| YYH |
40 |
0.002 |
0.975 |
| YYS |
34 |
0.002 |
0.989 |
3.4. Quantitative forecasting using an adsorption model
Sediment concentrations act as an important factor in the formation of submerged oils in marine environments. Oil droplet dispersion and oil sediment interactions can occur soon after a spill case, and adsorption of oil is probably enhanced by high turbidity, because more sediments can provide more adsorption sites.23 To assess the oil sediment interactions in the water column, we introduced a conditional parameter based on the partitioning of oil droplets between solid and solution phases, in terms of an empirical distribution coefficient, Kd (mL mg−1), defined as,| |
 | (5) |
where Cp is the solid phase that agglomerate with sediments (here is the concentration of submerged oils, mg L−1), Cs is the solution phase of non-adsorption oil (mg L−1) in the water column, and [S] is the concentration of sediments (mg L−1). This distribution coefficient has been used in several studies to address the balance of oil sediment interactions in aqueous systems.27,28 The Kd values are highly sensitive to particle type, and have a wide range in different water environments. Indeed, Kd is a very useful tool in the study of oil partitioning and transport in coastal waters.29
If we ignore the effects of weathering and other processes, the spilled oils are only adsorbed by sediments in the water column, then the initial added oils (C0) will satisfy following formula,
The assumptions are that oil sediment reactions will reach equilibrium owing to the limited surface sites for adsorption.30 Rearranging eqn (1), (5) and (6), the proportion of submerged oils formation can be calculated at varying sediment concentrations,
| |
 | (7) |
Then, curves can be generated using various Kd values through eqn (7) in the range of sediment concentrations tested, and much closer fits encompassing most of the experimental data points were obtained using Kd values of 0.5 and 1.5 mL mg−1 (dashed lines in Fig. 5). It can be seen that most of the experimental data for the three test oils fall in the zone defined by the Kd values of 0.5 and 1.5 mL mg−1, with only a few points as outliers. This indicated that the developed adsorption model verified our assumption, and we can conclude adsorption reactions during the oil sediment interactions are likely to be a significant mechanism in controlling the formation of submerged oils. Meantime, some extreme values did not fit the model results, which shows that adsorption alone might be unable to explain the behavior of spilled oils in the marine environments. The adsorption model, to some extent, verified our assumption about the oil sediment interactions, but further investigations was required. First, environmental conditions (salinity, wave energy, etc.) can change the removal behavior of dispersed oil droplets, such as the use of chemical dispersant and change of salinity may cause redistribution, either promote or weaken the formation of submerged oils, which is complicated and could not be predicted.24,31 Second, Kd is an empirical and conditional parameter, and it's best to actually measure it. Our data used here were from literature and model empirical inference, which may overestimate the active part in the partitioning of dispersed oil droplets between solid and dissolved states. Nevertheless, as the trend suggests, the model does provide a method for quantitative predicting the formation of submerged oils in the water column. The findings may aid our understanding of the sediment-facilitated transport of oil, which is beneficial for the development of numerical model for submerged oils.
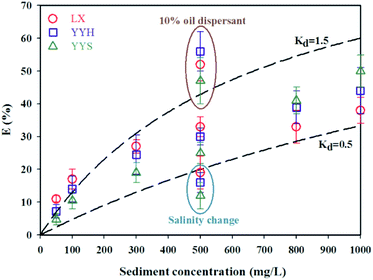 |
| | Fig. 5 Modeling of predicting the submerged oils formation as a function of sediment concentrations. The dash lines represent the model results computed using eqn (7) based on Kd = 0.5 and 1.5 mL mg−1. Note: The use of chemical dispersant and change of salinity lead to deviate from model results. | |
4. Conclusions
This study investigated the role of suspended sediments in the formation of submerged oils in marine environments. Compared with Freundlich equation, Langmuir model fitted better in describing the adsorption isotherms. Adsorption behaviors including capacity and efficiency would be enhanced under high concentrations of sediments. The results on a time scale indicated that contents of oils adsorbed by sediments were increasing with time, and generally approached to dynamic equilibrium within 200 min. The adsorption model proposed for predicting the formation of submerged oils is indeed in reasonably good agreement for the three test oils. This lends support to the model proposed and implies that adsorption reactions may be important in the formation of submerged oils. These results are useful for better understanding and simulating the transportation and fate of spilled oils in the marine environments.
Conflicts of interest
There are no conflicts to declare.
Acknowledgements
This study was funded by the National Basic Research Program of China (2016YFC1402301), Fundamental Research Funds for the Central Universities (3132018179) and a Research Project Supported by Key Laboratory of Marine Spill Oil Identification and Damage Assessment Technology (201808). Authors would like to thank colleagues at Key Laboratory of Marine Spill Oil Identification and Damage Assessment Technology for providing oil samples.
References
- M. Fingas, Oil spill science and technology, 2017, ch. 1, pp. 1–70 Search PubMed.
- F. Yin, G. F. John, J. S. Hayworth and T. P. Clement, Sci. Total Environ., 2015, 508, 46–56 CrossRef CAS PubMed.
- A. Al Shami, G. Harik, I. Alameddine, D. Bruschi, D. Astiaso Garcia and M. El-Fadel, Sci. Total Environ., 2017, 574, 234–245 CrossRef CAS PubMed.
- F. Mirnaghi, Y. Hua, B. P. Hollebone and C. E. Brown, International Oil Spill Conference, 2017, 2017(1), 2017–2217 Search PubMed.
- S. A. Gustitus and T. P. Clement, Rev. Geophys., 2017, 55(4), 1130–1157 CrossRef.
- Y. Y. Gong, X. Zhao, Z. Q. Cai, S. E. O'Reilly, X. D. Hao and Z. D. Zhao, Mar. Pollut. Bull., 2014, 79(1–2), 16–33 CrossRef CAS PubMed.
- P. J. Gearing, J. N. Gearing, R. J. Pruell, T. L. Wade and J. G. Quinn, Environ. Sci. Technol., 1980, 14(9), 1129–1136 CrossRef CAS.
- D. K. Muschenheim and K. Lee, Spill Sci. Technol. Bull., 2002, 8(1), 9–18 CrossRef.
- J. Sun, A. Khelifa, X. L. Zheng, Z. D. Wang, L. L. So, S. R. Wong, C. Yang and B. Fieldhouse, Mar. Pollut. Bull., 2010, 60(10), 1701–1707 CrossRef CAS.
- A. Khelifa, P. Stoffyn-Egli, P. S. Hill and K. Lee, Spill Sci. Technol. Bull., 2002, 8(1), 19–30 CrossRef.
- W. Z. Wang, Y. Zheng, Z. K. Li and K. Lee, Chem. Eng. J., 2011, 170(1), 241–249 CrossRef CAS.
- J. Sun, D. F. Zhao, C. C. Zhao, F. Liu and X. L. Zheng, Mar. Pollut. Bull., 2013, 76(1), 250–257 CrossRef CAS PubMed.
- U. C. Bandara, P. D. Yapa and H. Xie, J. Hydrocarbons, Mines Environ. Res., 2011, 5(3), 145–156 CrossRef.
- A. L. Dissanayake, A. B. Burd, K. L. Daly, S. Francis and U. Passow, J. Geophys. Res.: Oceans, 2018, 123(8), 5388–5405 CAS.
- H. Niu and K. Lee, Int. J. Environ. Pollut., 2013, 52(1–2), 32–51 CrossRef CAS.
- Z. W. Wang, Y. Q. Zhang, Z. Y. Yan, B. Sun and H. Liu, Cont. Shelf Res., 2019, 173, 87–92 CrossRef.
- H. J. He, Z. H. Xiang, X. J. Chen, H. Chen, H. Huang, M. Wen and C. P. Yang, Int. J. Environ. Sci. Technol., 2018, 15, 1491–1500 CrossRef CAS.
- Y. Cheng, C. P. Yang, H. J. He, G. M. Zeng, K. Zhao and Z. Yan, J. Environ. Eng., 2016, 142(9), C4015001 CrossRef.
- H. S. Li, X. Zhuang and M. T. Bao, RSC Adv., 2017, 7(72), 45843–45851 RSC.
- Y. Q. Huang, C. P. Yang, Z. C. Sun, G. M. Zeng and H. J. He, RSC Adv., 2015, 5, 11475–11484 RSC.
- Y. L. Gao, X. Zhao, Z. L. Ju, Z. X. Qi and D. Q. Xiong, Environ. Sci.: Processes Impacts, 2018, 20(10), 1404–1413 RSC.
- J. Hong, Y. K. Kim, K. H. Kang, J. W. Kim and S. J. Lee, Sens. Actuators, B, 2014, 196, 292–297 CrossRef CAS.
- L. Zhao, J. Torlapati, M. C. Boufadel, T. King, B. Robinson and K. Lee, Chem. Eng. J., 2014, 253, 93–106 CrossRef CAS.
- A. Khelifa, P. Stoffyn-Egli and P. S. Hill, et al., Effects of salinity and clay type on oil–mineral aggregation, Mar. Environ. Res., 2005, 59(3), 235–254 CrossRef CAS PubMed.
- L. O. Ajijolaiya, P. S. Hill, A. Khelifa and K. Lee, Mar. Pollut. Bull., 2006, 52(8), 920–927 CrossRef CAS PubMed.
- M. Husseien, A. A. Amer, A. El-Maghraby and N. Hamedallah, Int. J. Environ. Waste Manage., 2015, 16(4), 281–292 CrossRef CAS.
- J. R. Payne, J. R. Clayton Jr and B. E. Kirstein, Spill Sci. Technol. Bull., 2003, 8(2), 201–221 CrossRef CAS.
- Y. Y. Gong, X. Zhao, S. E. O'Reilly, T. W. Qian and D. Y. Zhao, Environ. Pollut., 2014, 185, 240–249 CrossRef CAS PubMed.
- D. Boglaienko and B. Tansel, J. Environ. Manage., 2016, 175, 40–45 CrossRef CAS PubMed.
- Z. Q. Cai, J. Fu, W. Liu, K. M. Fu, S. E. O'Reilly and D. Y. Zhao, Mar. Pollut. Bull., 2017, 114(1), 408–418 CrossRef CAS PubMed.
- D. Yan, L. Meng, H. S. Li, T. W. Song, P. Y. Sun, M. T. Bao and Y. M. Li, RSC Adv., 2019, 9(14), 7922–7931 RSC.
|
| This journal is © The Royal Society of Chemistry 2019 |
Click here to see how this site uses Cookies. View our privacy policy here.  Open Access Article
 a,
Wenchao Yang
 b,
Yanqiu Zhang
 a,
Zhiyu Yan
 a,
Hui Liu
 a and
Bing Sun
 *a
*a


