 Open Access Article
Interfacial interaction modes construction of various functional SSBR–silica towards high filler dispersion and excellent composites performances†
Wei Gao,
Jianmin Lu*,
Wenna Song,
Jianfang Hu and
Bingyong Han *
*
State Key Laboratory of Chemical Resource Engineering, Beijing University of Chemical Technology, Beijing 100029, P. R. China. E-mail: lujm@mail.buct.edu.cn; hanby@mail.buct.edu.cn
First published on 17th June 2019
Abstract
In this study, various interfacial interaction modes between silica and in-chain functionalized solution styrene butadiene rubbers (F-SSBRs) with –OH (3-mercaptopropanol, MPL), –COOH (11-mercaptoundecanoic acid, MUA), and –Si–(OCH2CH3)3 (3-mercaptopropyltriethoxysilane, MPTES) were constructed at the molecular level. As the modes of interfacial interaction followed the order of single hydrogen bond interactions to dual hydrogen/covalent bond interactions to single covalent bond interactions, the interfacial interactions presented silica/SSBR-g-MPL < silica/SSBR-g-MUA < silica/SSBR-g-MPTES. Moreover, the interfacial interactions were enhanced as the grafting percentages of the functional group increased. The results showed that silica dispersion was enhanced upon improving the interfacial interaction. As the filler–rubber networks improved and filler–filler networks decreased, the dynamic mechanical properties of the silica/F-SSBR composites improved and were even superior to those of the silica/SSBR/bis(γ-triethoxysilylpropyl)-tetrasulfide (Si69) composite. The rolling resistances of silica/SSBR-g-MPL, silica/SSBR-g-MUA, and silica/SSBR-g-MPTES composites decreased by 21.2%, 27.3%, and 50.8%, respectively. The wet skid resistances of silica/SSBR-g-MPL, silica/SSBR-g-MUA, and silica/SSBR-g-MPTES composites increased by 112.7%, 161.2%, and 184.3%, respectively. However, the excessively strong rubber–rubber networks led to poor mechanical properties. Filler–rubber, filler–filler, and rubber–rubber networks reached equilibrium in the silica/SSBR-g-MUA composite, which had excellent overall performances of high strength, low rolling resistance, and high wet skid resistance.
Introduction
Silica reinforced solution styrene-butadiene rubber (SSBR) composites exhibit excellent performance regarding low rolling resistance.1,2 Therefore, silica/SSBR composites have been widely used in “green tires”3 from the standpoint of low fuel consumption. However, owing to the large amount of silanols on the surface, silica presents high surface energy, which results in a contradiction between the weak filler–rubber interaction and strong filler–filler interaction. This is not conducive to the improvement of silica dispersion and comprehensive performances of the composites.4,5 Hence, improvement in the reinforcing effect of silica and high performances of the composites can only be realized if the above contradiction is solved.Many efforts have been made to improve the interfacial interaction between silica and SSBR and the dispersion of silica in the SSBR matrix. These methods include the modification of silica,6,7 the addition of silane coupling agents,4,8,9 and functionalization of the SSBR matrix.10–13 Among the above methods, functionalization of the SSBR matrix, which includes end functionalization10,11 and in-chain functionalization,12,13 is the method of solving silica dispersion in composites from the perspective of rubber synthesis. Compared with end functionalization, in-chain functionalization is receiving increasing attention because this method can introduce more functional groups into SSBR molecules. The in-chain functional groups can effectively improve the compatibility between silica and SSBR via polar–polar interaction or chemical linking. More importantly, the in situ modification of silica by in-chain functionalized SSBR not only restrains the filler–filler networks but also enhances the filler–rubber networks during the mixing process, effectively inhibiting the reformation of filler–filler networks during storage and at the onset of vulcanization.14–17
Interfacial interaction between silica and the functionalized rubber matrix can be regulated by interaction modes and their strength. The mode of interfacial interaction depends on the types of functional group, while its strength depends on the contents of the functional group. A quite strong interfacial interaction is not conducive to the slippage of rubber chains when subjected to an external force.18 However, a very weak interfacial interaction is detrimental to the silica dispersion, which is crucial for the improvement of the dynamic mechanical properties of the composites.19 To solve the above problems, it is necessary to clarify the key scientific issue of the mechanism and strength of the interfacial interaction, which has important guiding significance for the design of rubber molecules aiming to achieve high performances of the composites. According to our review of the literature, few theoretical and experimental studies have systematically researched the effects of rubber functionalized by different types and contents of functional group on interfacial interactions with silica.
To fill this research gap, various interfacial interaction modes were constructed at the molecular level in this study, including single hydrogen bond interactions, dual hydrogen/covalent bond interactions, and single covalent bond interactions. The mechanisms of the interfacial interaction and their strength were investigated. Furthermore, the effects of interfacial interaction on filler dispersion and composites performances were explored. Therefore, three kinds of in-chain functionalized SSBR (F-SSBRs) with –OH, –COOH, and –Si–(OCH2CH3)3 were prepared via the thiol–ene click addition reaction. Various interfacial interaction modes and their strength were analyzed by thermogravimetric analysis (TGA), bound rubber content, and torque difference of silica/F-SSBR composites. The silica dispersion was investigated through transmission electron microscopy (TEM) and the rubber process analyzer (RPA). Meanwhile, the performances of the silica/F-SSBR composites were also compared. This work clarifies the impacts of the interfacial interaction modes and their strength on the filler dispersion and composite performances.
Experimental section
Materials
Styrene (St) (analytical reagent), cyclohexane (industrial grade), and ethanol (analysis grade) were purchased from Beijing Chemical Reagents Company (Beijing, China). St and cyclohexane were dried over calcium hydride for 12 h and distilled in dry nitrogen. Butadiene (Bd) (polymerization grade) was kindly provided by Beijing Yanshan Petrochemical Corporation (Beijing, China). N,N-Dimethyltetrahydrofurfurylamine (DMTHFA) was synthesized in our laboratory. 3-Mercaptopropanol (MPL) (reagent grade), 11-mercaptoundecanoic acid (MUA) (reagent grade), 3-mercaptopropyltriethoxysilane (MPTES) (reagent grade), n-butyllithium (n-BuLi, 2.5 M in n-hexane), and lauroyl peroxide (LPO) were purchased from Aldrich Chemical Co. (USA) and used as received. The precipitated silica (Ultrasil VN3) was purchased from Degussa Chemical. The CTAB specific surface area of Ultrasil VN3 is 175 m2 g−1. Other materials were commercially available and used as received. The SSBR samples were synthesized via a conventional anionic polymerization method (see the ESI†).Thiol–ene click addition of mercaptans to SSBR
The typical thiol–ene click addition experiment was implemented under a dry nitrogen atmosphere, as described below. The SSBR solution (synthesized in our laboratory, as described in the ESI†) was transferred into another 2 L stainless steel reactor, after which an appropriate amount of mercaptan was injected into the SSBR solution. The mixture was heated up to 80 °C and then stirred for 10 min with a stirring speed of 400 rpm. Then a pre-prepared solution of LPO in cyclohexane was added into the 2 L stainless steel reactor. The LPO/mercaptan molar ratio was 1![[thin space (1/6-em)]](https://www.rsc.org/images/entities/char_2009.gif) :
:![[thin space (1/6-em)]](https://www.rsc.org/images/entities/char_2009.gif) 120. The thiol–ene click addition was carried out for 30 min. At the end of the reaction, the in-chain functionalized SSBR (F-SSBR) solution was transferred to a 2 L beaker, and then ethanol was added into the solution dropwise to precipitate the polymer. After filtering, all samples were redissolved and reprecipitated in cyclohexane three times to remove the ungrafted mercaptan. Finally, the F-SSBRs were dried under vacuum at 60 °C for 24 h. The F-SSBRs, named SSBR-g-MPL, SSBR-g-MUA, and SSBR-g-MPTES, were SSBRs functionalized with MPL, MUA, and MPTES, respectively.
120. The thiol–ene click addition was carried out for 30 min. At the end of the reaction, the in-chain functionalized SSBR (F-SSBR) solution was transferred to a 2 L beaker, and then ethanol was added into the solution dropwise to precipitate the polymer. After filtering, all samples were redissolved and reprecipitated in cyclohexane three times to remove the ungrafted mercaptan. Finally, the F-SSBRs were dried under vacuum at 60 °C for 24 h. The F-SSBRs, named SSBR-g-MPL, SSBR-g-MUA, and SSBR-g-MPTES, were SSBRs functionalized with MPL, MUA, and MPTES, respectively.
Preparation of the silica/F-SSBR composites
Silica was blended with F-SSBR and other required additives using a 6-inch open two-roll mill according to the conventional blending technique. The related formulations are presented in Table S1.† The silica/F-SSBR compounds were vulcanized at 150 °C and 15 MPa to obtain vulcanizates. The optimum cure time of silica/F-SSBR compounds was obtained by a disc vulkameter. Various silica/F-SSBR vulcanizates were prepared from different F-SSBRs, namely silica/SSBR-g-MPL, silica/SSBR-g-MUA, and silica/SSBR-g-MPTES. Silica/SSBR vulcanizates without and with the silane coupling agent Si69 were also prepared as presented in Table S1,† namely, silica/SSBR and silica/SSBR/Si69. To calculate the grafting percentages of F-SSBRs based on silica, some of the silica/F-SSBR compounds without any rubber additives were extracted in a Soxhlet extractor by using toluene for 96 h to remove the ungrafted F-SSBRs, and they were subsequently dried in an oven at 75 °C for 24 h. To verify that the purification process was done correctly, the physically mixed silica/SSBR sample without any rubber additives was also prepared using a 6-inch open two-roll mill. The purification process was carried out as described above.Measurements
1H nuclear magnetic resonance (1H NMR) was conducted with an ARX400 spectrometer (400 MHz) using CDCl3 as the solvent. Gel permeation chromatography (GPC) was performed with an Alliance2690 system (Waters, USA). All polymers were run in tetrahydrofuran at 30 °C with a rate of 1.0 mL min−1. Linear polystyrene standards were used for calibration. Differential scanning calorimetry (DSC) was carried out on a Mettler-Toledo DSC instrument at a heating rate of 10 °C min−1 from −80 to 160 °C. All the samples were measured under nitrogen atmosphere. The weight loss values of silica/F-SSBR compounds were measured using a Q5000-TA instrument from 40 to 750 °C under nitrogen atmosphere. The heating rate was 10 °C min−1. The bound rubber content was measured according to the reported method.20 Filler networks were analyzed using an RPA 2000 at 60 °C (Alpha, USA). The compounds were analyzed over the strain range of 0.28–400% at 1 Hz. The vulcanizates were measured over the strain range of 0.28–41.99% at 10 Hz. The silica flocculation extent during vulcanization was calculated by measuring the change of storage modulus of the composite before and after vulcanization using RPA 2000 instrument (Alpha, USA). The filler dispersion was analyzed with a Tecnai G2 20 TEM with an accelerating voltage of 200 kV. The ultrathin vulcanizates were cut by a microtome at −100 °C. The cure characteristics of all compounds were measured on a MR-C3 rotorless rheometer at 150 °C and 1.67 Hz. The crosslink densities of silica/F-SSBR vulcanizates were measured by swelling experiments with toluene as the solvent according to the reported method21 (see ESI†). The mechanical properties of the composites were carried out by a CMT4104 Electrical Tensile Tester according to ASTM D638 with the tensile rate of 500 mm min−1. The viscoelastic properties of the silica/SSBR vulcanizates were measured on a VA3000 DMTA at 10 Hz using a tension mode with a heating rate of 3 °C min−1 from −80 to 100 °C. The strain amplitude was chosen as 0.1%.Results and discussion
Synthesis of the F-SSBRs
The in-chain functionalized SSBRs (F-SSBRs) were synthesized via the thiol–ene click addition reaction. The 1H NMR spectra are shown in Fig. 1. The appearance of peaks at 3.70–3.85, 2.30–2.40, and 3.80–3.92 ppm, correspond to methylene protons in –CH2OH, –CH2COOH, and –Si–(OCH2CH3)3, respectively, indicating that MPL, MUA, and MPTES were grafted to SSBR. The characterizations of SSBR and F-SSBRs are presented in Table S2.† | ||
| Fig. 1 Typical 1H NMR spectra of (A) SSBR and SSBR-g-MPL, (B) SSBR and SSBR-g-MUA, and (C) SSBR and SSBR-g-MPTES. | ||
The thiol–ene click addition reaction mainly occurs between the 1,2-polybutadiene units and sulfhydryl.12,22,23 Approximately 4.9% and 4.8% 1,2-polybutadiene units reacted with MPL and MUA; approximately 0.8%, 2.7%, and 4.8% 1,2-polybutadiene units reacted with MPTES in our experiment. There were approximately 70 MPL and 70 MUA molecules in each SSBR-g-MPL and SSBR-g-MUA, namely, SSBR-g-MPL70 and SSBR-g-MUA70. There were approximately 13, 42, and 70 MPTES molecules in three types of SSBR-g-MPTES, namely SSBR-g-MPTES13, SSBR-g-MPTES42, and SSBR-g-MPTES70. The grafting percentage (ratio of the weight of grafted mercaptan to that of SSBR) of mercaptan based on SSBR was calculated from the 1H NMR spectra using eqn (S9).† The values of SSBR-g-MPL70, SSBR-g-MUA70, SSBR-g-MPTES13, SSBR-g-MPTES42, and SSBR-g-MPTES70 were 3.6%, 8.7%, 1.7%, 5.8%, and 9.5%, respectively.
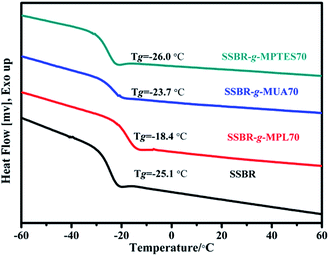
The glass transition temperature values of SSBR and F-SSBRs were measured using DSC thermograms, and the results are shown in Fig. 2. The Tg values of F-SSBRs with different functional groups exhibited different variation trends. The Tg of SSBR-g-MPL70 increased significantly owing to the grafted polar hydroxyl groups. The Tg of SSBR-g-MUA70 was slightly higher than that of SSBR; its increased range was lower than that of SSBR-g-MPL70. This was because the introduction of flexible alkyl side chains partially offset the intermolecular interactions within SSBR-g-MUA. Moreover, because of the low polar of siloxane groups, the Tg of SSBR-g-MPTES70 did not change significantly compared with that of SSBR.
Silica/F-SSBR interfacial interaction
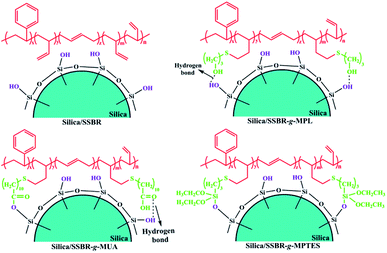
The mode of interfacial interaction between filler and rubber can affect the filler dispersion, which largely determines the performances of filler/rubber composites.24 To investigate the interfacial interactions between silica and F-SSBRs, five types of silica/F-SSBR composites were prepared, and the formulations are included in Table S1.†In the absence of any catalysts, hydroxyl, carboxyl, and alkoxysilane groups can contribute to various modes of interfacial interaction with the silanols of silica in the composites. The hydroxyl groups contribute to single hydrogen bonds with the silanols of silica in the silica/SSBR-g-MPL composites without any catalysts.25–27 The mean energy per hydrogen bond is 20 kJ mol−1.28 A part of the carboxyl groups can form hydrogen bonds with the silanols of silica in silica/SSBR-g-MUA composites. The mean energy per hydrogen bond is 46 kJ mol−1.29 Additionally, the formation of covalent bonds induced by the esterification reaction between the carboxyl groups and silanols of silica during the compounding process on an open-mill at room temperature was confirmed by Jia's research.30 As a result, dual interaction modes of hydrogen/covalent bonds exist in silica/SSBR-g-MUA composites.30–32 It is well known that the alkoxysilane groups of bis(3-triethoxysilylpropyl)tetrasulfide (TESPT) can react in situ with silanols of silica under shear force during the compounding process.6 Therefore, the alkoxysilane groups contribute to single covalent bonds with the silanols of silica in the silica/SSBR-g-MPTES composites.10,33,34 Fig. 3 presents various modes of interfacial interaction of silica/F-SSBR composites.
The grafting percentage (ratio of the weight of grafted F-SSBR to that of silica) of F-SSBR based on silica was calculated by the analysis of thermogravimetric results. As shown in Fig. 4(A), the TGA curve of the physically mixed silica/SSBR sample after extraction was similar to that of silica, indicating that the ungrafted SSBR could be removed by an extraction process. The weight loss of the silica/SSBR-g-MPL compound was similar to that of silica, which indicated that the SSBR-g-MPL was removed through a 96 h extraction process. However, the weight losses of the silica/SSBR-g-MUA70 and silica/SSBR-g-MPTES70 compounds were higher than that of silica, indicating the successful grafting of SSBR-g-MUA and SSBR-g-MPTES onto silica through covalent bonds. The grafting percentages of SSBR-g-MUA and SSBR-g-MPTES based on silica were 108.1% and 120.6%, respectively.
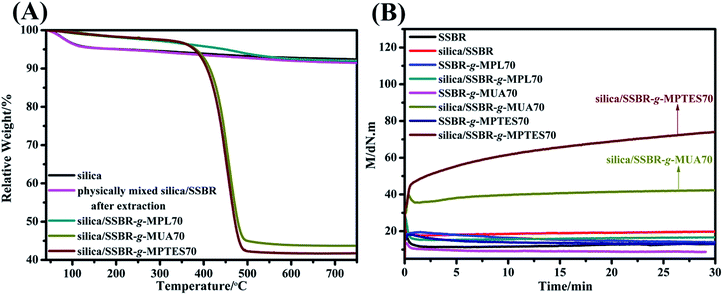 | ||
| Fig. 4 (A) TGA curves of silica and silica/F-SSBR compounds and (B) time dependence of torque of SSBR, F-SSBRs, and their compounds. (Compounds without any rubber additives were prepared based on Table S1.†) | ||
In filler-filled rubber composites, the rubber that is chemically or physically bound to the silica surface is called bound rubber.16 The filler–rubber interfacial interaction can affect the bound rubber content.35 Therefore, the measurement of bound rubber content is usually used to study the interfacial interaction between the filler and rubber.36,37 As the interfacial interaction modes between silica and F-SSBRs followed the order single hydrogen bonds to dual hydrogen/covalent bonds to single covalent bonds, the compounds were ordered as follows with respect to the bound rubber contents: silica/SSBR-g-MPL70 < silica/SSBR-g-MUA70 < silica/SSBR-g-MPTES70, as listed in Table 1. The results indicated that the filler–rubber networks, which were formed through rubber chain bridges anchored onto adjacent fillers,38–40 increased gradually with the improving interfacial interactions. Moreover, the bound rubber contents of the silica/SSBR-g-MPTES compounds increased with increasing MPTES contents. The results of the bound rubber contents of silica/F-SSBR compounds indicated that the interfacial interaction could be regulated by varying the types and contents of the functional group.
| Samples | Silica/SSBR | Silica/SSBR/Si69 | Silica/SSBR-g-MPL70 | Silica/SSBR-g-MUA70 | Silica/SSBR-g-MPTES13 | Silica/SSBR-g-MPTES42 | Silica/SSBR-g-MPTES70 |
|---|---|---|---|---|---|---|---|
| Bound rubber content (%) | 20.56 | 39.32 | 55.28 | 67.82 | 46.23 | 57.61 | 80.20 |
To further analyze and compare the silica/F-SSBR composites interfacial interactions, the rotorless rheometer was used to measure the torque values of SSBR, F-SSBRs, and their compounds without any rubber additives at 150 °C. The results are presented in Fig. 4(B) and Table S3.† The torque difference between MH and ML is usually used to evaluate the cross-link density. The torque differences of SSBR, F-SSBRs, silica/SSBR, and silica/SSBR-g-MPL70 compounds were close to 0. This was because the torque difference caused by weak interfacial interaction between silica and SSBR-g-MPL70 was not sufficiently reflected in the rotorless rheometer. However, the torque differences of the silica/SSBR-g-MUA70 and silica/SSBR-g-MPTES70 compounds were 12.81 and 51.06 dN m, respectively, which indicated that the interfacial interactions were improved. Moreover, the torque difference of the silica/SSBR-g-MPTES70 compound was much higher than that of the silica/SSBR-g-MUA70 compound owing to the stronger interfacial interaction resulting from the condensation reaction between the silanols and siloxane groups.
The results of the TGA, bound rubber content, and torque difference of the silica/F-SSBR composites indicated that various modes and strengths of interfacial interaction could be constructed at the molecular level. The interfacial interaction could be regulated by designing the types and contents of functional group.
Dispersion of silica in the F-SSBR matrix
The dispersion of filler in the rubber matrix is a key factor to improve the performances of composites.41 To evaluate the effects of various interfacial interaction modes and their strength on silica dispersion, silica/SSBR, silica/SSBR/Si69, and silica/F-SSBR composites were prepared based on the formulations in Table S1.†Fig. 5 displays the dispersions of silica in silica/F-SSBR vulcanizates. The dark parts represent silica and the light parts represent the rubber matrix.6,10,21,42,43 Owing to the weak interfacial interaction between silica and SSBR, the dispersion of silica in the silica/SSBR composite was very poor with many voids and filler-aggregations, as shown in Fig. 5(A). The dispersions of silica in the silica/F-SSBR composites were quite uniform with fewer aggregates and voids, as shown in Fig. 5(C)–(E). In terms of silica dispersions in vulcanizates, it was found that silica/SSBR-g-MPTES70 > silica/SSBR-g-MUA70 > silica/SSBR-g-MPL70, which was attributed to the gradually improving interfacial interactions. The silica dispersions in the silica/SSBR-g-MPTES composites improved with increasing MPTES contents (Fig. S1†). Moreover, the dispersions of silica in the silica/F-SSBR composites were even more uniform than that in the silica/SSBR/Si69 composite.
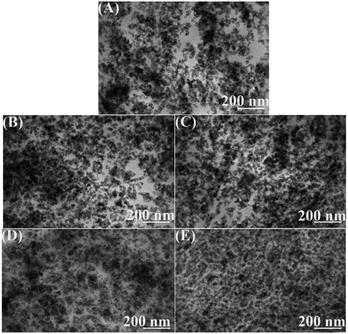 | ||
| Fig. 5 TEM micrographs of (A) silica/SSBR, (B) silica/SSBR/Si69, (C) silica/SSBR-g-MPL70, (D) silica/SSBR-g-MUA70, and (E) silica/SSBR-g-MPTES70 vulcanizates. | ||
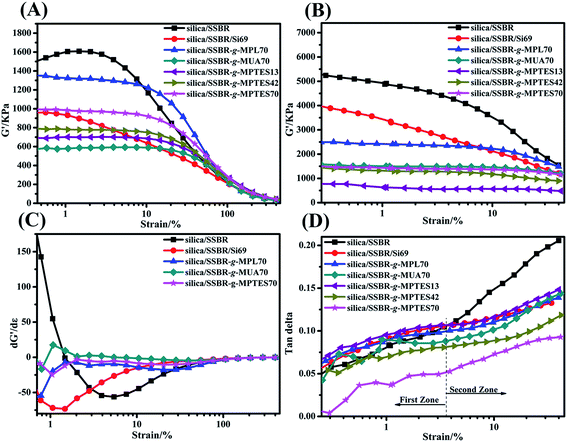
RPA measurements were conducted to study the influences of interfacial interaction modes and their strength on the filler networks. According to published literature, filler–filler and filler–rubber networks exist in filler/rubber composites.38–40 The curves of storage modulus (G′) versus strain amplitude of all the composites are shown in Fig. 6(A) and (B). Payne found that G′ decreased with increasing strain, which is known as the Payne effect.44,45 A high Payne effect implies poor filler dispersion and strong filler–filler networks. As displayed in Fig. 6(A) and (B), the Payne effects of the silica/F-SSBR composites were lower than that of the silica/SSBR composite, which resulted from the decreased filler–filler networks and increased interactions between silica and F-SSBRs. Moreover, as shown in Fig. 6(A) and (B), the critical values of the silica/F-SSBR composites at which the filler–filler networks began to be destroyed were higher than those of silica/SSBR and silica/SSBR/Si69 composites, which implied the dependence of G′ on strain reduction. The dependence of G′ on strain can also be evaluated by the derivative dG′/dε.12 As displayed in Fig. 6(C), the dependences of G′ on strain in the silica/SSBR and silica/SSBR/Si69 compounds were much higher than those in the silica/F-SSBR compounds. As shown in Fig. 6(B), the Payne effects of the silica/F-SSBR vulcanizates were lower than that of the silica/SSBR/Si69 vulcanizate, indicating better dispersions of silica in the silica/F-SSBR vulcanizates than that in the silica/SSBR/Si69 vulcanizate, which was consistent with the TEM results.
Another phenomenon in Fig. 6(A) that should be discussed was that the incipient G′ of the silica/SSBR-g-MPTES70 composite was higher than that of the silica/SSBR-g-MUA70 composite. As observed above in the TEM micrographs, the dispersion of silica in the silica/SSBR-g-MPTES70 composite was better than that in the silica/SSBR-g-MUA70 composite. However, why did the Payne effect of the silica/SSBR-g-MPTES70 composite increase? This was because not only the filler–filler networks but also the filler–rubber networks can lead to the improvement of G′ in the filler-filled rubber composites.21,38–40,43,46 For the silica/SSBR-g-MPTES70 composite, the strong filler–rubber networks resulting from the covalent bond interactions improved the amount and the extent of F-SSBR chains that were restricted to movement. Moreover, the variation of the incipient G′ values in the silica/SSBR-g-MPTES composites with different MPTES contents could also be explained by the above reasons.
Fig. 6(D) displays the changes in the tan![[thin space (1/6-em)]](https://www.rsc.org/images/entities/char_2009.gif) δ values of the vulcanizates with the strain amplitude. The tan
δ values of the vulcanizates with the strain amplitude. The tan![[thin space (1/6-em)]](https://www.rsc.org/images/entities/char_2009.gif) δ–ε% curves in Fig. 6(D) could be divided into two zones. In the first zone (ε% < 3.6%), the viscous property of the effective deformable polymer is the main source of internal friction loss because filler–filler networks are not easily destroyed at low strains.9,43,45 In the second zone (ε% > 3.6%), the filler–filler networks are gradually destroyed with increasing strain. The filler–filler friction and filler–rubber friction account for a large proportion of the internal friction loss. Owing to the very large aggregates and weak interfacial interaction, the tan
δ–ε% curves in Fig. 6(D) could be divided into two zones. In the first zone (ε% < 3.6%), the viscous property of the effective deformable polymer is the main source of internal friction loss because filler–filler networks are not easily destroyed at low strains.9,43,45 In the second zone (ε% > 3.6%), the filler–filler networks are gradually destroyed with increasing strain. The filler–filler friction and filler–rubber friction account for a large proportion of the internal friction loss. Owing to the very large aggregates and weak interfacial interaction, the tan![[thin space (1/6-em)]](https://www.rsc.org/images/entities/char_2009.gif) δ values of the silica/SSBR composite increased rapidly with the increasing strain and were the highest among all of the composites at the same strain. For the silica/F-SSBR composites, under the combined effects of less silica aggregates and improved interfacial interactions, the tan
δ values of the silica/SSBR composite increased rapidly with the increasing strain and were the highest among all of the composites at the same strain. For the silica/F-SSBR composites, under the combined effects of less silica aggregates and improved interfacial interactions, the tan![[thin space (1/6-em)]](https://www.rsc.org/images/entities/char_2009.gif) δ values increased steadily with the increasing strain. Moreover, the tan
δ values increased steadily with the increasing strain. Moreover, the tan![[thin space (1/6-em)]](https://www.rsc.org/images/entities/char_2009.gif) δ values decreased gradually in the order of silica/SSBR-g-MPL70, silica/SSBR-g-MUA70, and silica/SSBR-g-MPTES70 owing to the gradually improving interfacial interaction; the tan
δ values decreased gradually in the order of silica/SSBR-g-MPL70, silica/SSBR-g-MUA70, and silica/SSBR-g-MPTES70 owing to the gradually improving interfacial interaction; the tan![[thin space (1/6-em)]](https://www.rsc.org/images/entities/char_2009.gif) δ values in the silica/SSBR-g-MPTES composites decreased gradually with increasing MPTES contents. The quite strong interfacial interaction in the silica/SSBR-g-MPTES70 composite led to the lowest tan
δ values in the silica/SSBR-g-MPTES composites decreased gradually with increasing MPTES contents. The quite strong interfacial interaction in the silica/SSBR-g-MPTES70 composite led to the lowest tan![[thin space (1/6-em)]](https://www.rsc.org/images/entities/char_2009.gif) δ values among all of the vulcanizates within the entire strain range.
δ values among all of the vulcanizates within the entire strain range.
The lower tan![[thin space (1/6-em)]](https://www.rsc.org/images/entities/char_2009.gif) δ value at 7% strain is favorable for rolling resistance in the tire industry.43,47 As observed in Fig. 6(D) and Table S4,† the composites were ordered as follows with respect to the rolling resistances: silica/SSBR > silica/SSBR/Si69 > silica/SSBR-g-MPL70 > silica/SSBR-g-MUA70 > silica/SSBR-g-MPTES70. Moreover, the rolling resistances decreased gradually with increasing MPTES contents. Compared with the silica/SSBR composite, the rolling resistances of the silica/SSBR-g-MPL70, silica/SSBR-g-MUA70, and silica/SSB-g-MPTES70 composites decreased by 21.2%, 27.3%, and 50.8%, respectively.
δ value at 7% strain is favorable for rolling resistance in the tire industry.43,47 As observed in Fig. 6(D) and Table S4,† the composites were ordered as follows with respect to the rolling resistances: silica/SSBR > silica/SSBR/Si69 > silica/SSBR-g-MPL70 > silica/SSBR-g-MUA70 > silica/SSBR-g-MPTES70. Moreover, the rolling resistances decreased gradually with increasing MPTES contents. Compared with the silica/SSBR composite, the rolling resistances of the silica/SSBR-g-MPL70, silica/SSBR-g-MUA70, and silica/SSB-g-MPTES70 composites decreased by 21.2%, 27.3%, and 50.8%, respectively.
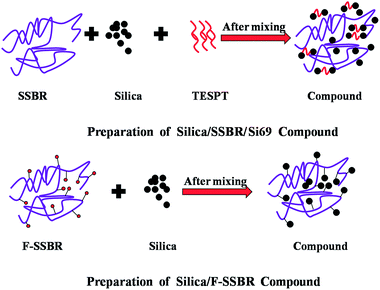
It is well known that filler–filler networks were formed by flocculation during storage, molding, and the first few minutes of vulcanization.14,15 In order to quantify the silica flocculation extent during vulcanization at 150 °C and 15 MPa, the differences in ΔG′ between compounds and vulcanizates, δΔG′, were calculated.16,33 The ΔG′ was the difference between the G′ at 0.28% strain and 41.99% strain. As listed in Table 2, the δΔG′ values, which indicate the extent of silica flocculation,16,33 were lower in silica/F-SSBR composites than that in the silica/SSBR/Si69 composite, signifying that the in situ modification of silica by the F-SSBR matrix could more effectively inhibit the formation of filler–filler networks during vulcanization at 150 °C and 15 MPa. This was because the modification of silica by Si69 just restrained the filler–filler networks rather than improved the filler–rubber networks during the mixing process. However, the in situ modification of silica by the F-SSBR matrix could improve the filler–rubber networks and restrained the filler–filler networks simultaneously. The difference between silica/SSBR/Si69 and silica/SSBR-g-MPL70 in Fig. 6(A) and (B) further supported this view. The mechanism is shown in Fig. 7.
| Samples | ΔG′ (compounds)a (kPa) | ΔG′ (vulcanizates)b (kPa) | δΔG′c (kPa) |
|---|---|---|---|
| a The difference in G′ between compounds at 0.28% strain and 41.99% strain.b The difference in G′ between vulcanizates at 0.28% strain and 41.99% strain.c The difference in ΔG′ (vulcanizates) and ΔG′ (compounds). | |||
| Silica/SSBR | 873.53 | 4215.09 | 3341.56 |
| Silica/SSBR/Si69 | 542.60 | 3049.16 | 2506.56 |
| Silica/SSBR-g-MPL70 | 657.10 | 1078.07 | 420.97 |
| Silica/SSBR-g-MUA70 | 112.03 | 450.76 | 338.73 |
| Silica/SSBR-g-MPTES13 | 216.72 | 615.57 | 398.85 |
| Silica/SSBR-g-MPTES42 | 306.80 | 592.76 | 285.96 |
| Silica/SSBR-g-MPTES70 | 399.96 | 451.10 | 51.14 |
Performances of the silica/F-SSBR composites
The crosslink densities of all vulcanizates were determined by means of equilibrium swelling measurement, and the results are listed in Table 3. The crosslink densities of the silica/F-SSBR vulcanizates increased gradually with improving interfacial interaction and were higher than that of the silica/SSBR/Si69 vulcanizate.| Samples | Silica/SSBR | Silica/SSBR/Si69 | Silica/SSBR-g-MPL70 | Silica/SSBR-g-MUA70 | Silica/SSBR-g-MPTES13 | Silica/SSBR-g-MPTES42 | Silica/SSBR-g-MPTES70 |
|---|---|---|---|---|---|---|---|
| Crosslink density (10−4 mol cm−3) | 2.24 | 3.02 | 4.89 | 6.37 | 3.12 | 4.62 | 9.59 |
Fig. 8(A) and Table S5† present the mechanical properties of all vulcanizates. The modulus at 100% strain of the silica/F-SSBR vulcanizates increased with improving interfacial interaction. The values of elongation at the break of silica/F-SSBR vulcanizates decreased because of the restriction of the slippage of F-SSBRs resulting from the excessively strong interfacial interaction when suffering external forces. In addition, the improved crosslink densities of the silica/F-SSBR vulcanizates were also responsible for the decrease in elongation at break. The mechanical properties of the silica/SSBR-g-MUA70 vulcanizates were superior to those of silica/SSBR-g-MPL70 and silica/SSBR-g-MPTES70 vulcanizates. Moreover, the tensile strength of the silica/SSBR-g-MUA70 vulcanizates increased by 73.3% and 23.8% compared with those of the silica/SSBR and silica/SSBR/Si69 vulcanizates.
The dynamic mechanical properties of all vulcanizates are shown in Fig. 8(B) and (C) and summarized in Table S6.† The G′ values of the vulcanizates at the high-elastic region can be used to evaluate the filler–filler networks.6,10,45,48,49 The lower value of G′ implies weaker filler–filler networks and better silica dispersion. As shown in Fig. 8(B), the values of G′ showed that silica/SSBR > silica/SSBR/Si69 > silica/SSBR-g-MPL70 > silica/SSBR-g-MUA70 > silica/SSBR-g-MPTES70 at the high-elastic state, i.e., the gradually improving interfacial interaction was beneficial to the silica dispersion in the silica/F-SSBR vulcanizates. This was in accordance with the TEM observation.
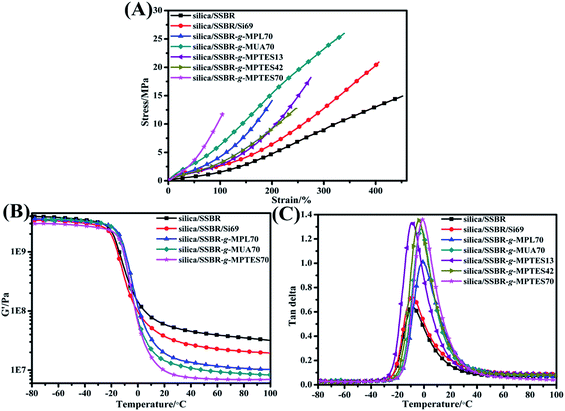 | ||
| Fig. 8 (A) Stress–strain curves, (B) G′–temperature curves, and (C) loss factor–temperature curves of the silica/SSBR, silica/SSBR/Si69, and silica/F-SSBR vulcanizates. | ||
The destruction of the filler–filler networks can be ignored owing to the rather low strain in DMTA experiments;12 therefore, the macromolecular chain segment relaxation is the main source of internal friction loss in the glass-transition zone. The decreased filler–filler networks reduced the number of rubber chains trapped in them, enhancing the effective volume of the rubber chains and leading to a high value of tan![[thin space (1/6-em)]](https://www.rsc.org/images/entities/char_2009.gif) δ at Tg (tan
δ at Tg (tan![[thin space (1/6-em)]](https://www.rsc.org/images/entities/char_2009.gif) δmax).7,9,50–52 However, the tan
δmax).7,9,50–52 However, the tan![[thin space (1/6-em)]](https://www.rsc.org/images/entities/char_2009.gif) δmax value will decrease when enhanced interfacial interactions exist in the vulcanizates.21,43 For silica/F-SSBR vulcanizates, the decreased filler–filler networks played a leading role; therefore, the tan
δmax value will decrease when enhanced interfacial interactions exist in the vulcanizates.21,43 For silica/F-SSBR vulcanizates, the decreased filler–filler networks played a leading role; therefore, the tan![[thin space (1/6-em)]](https://www.rsc.org/images/entities/char_2009.gif) δmax values of all vulcanizates increased in the order of silica/SSBR, silica/SSBR/Si69, silica/SSBR-g-MPL70, silica/SSBR-g-MUA70, and silica/SSBR-g-MPTES70 (Fig. 8(C) and Table S6†). Furthermore, the tan
δmax values of all vulcanizates increased in the order of silica/SSBR, silica/SSBR/Si69, silica/SSBR-g-MPL70, silica/SSBR-g-MUA70, and silica/SSBR-g-MPTES70 (Fig. 8(C) and Table S6†). Furthermore, the tan![[thin space (1/6-em)]](https://www.rsc.org/images/entities/char_2009.gif) δmax values of the silica/SSBR-g-MPTES vulcanizates increased with increasing MPTES contents (Fig. 8(C) and Table S6†). As listed in Table S6,† the Tg values of the silica/F-SSBR vulcanizates increased significantly compared with that of the silica/SSBR vulcanizate owing to the restriction on movement of the rubber chains by the “glass polymer layer”.53,54
δmax values of the silica/SSBR-g-MPTES vulcanizates increased with increasing MPTES contents (Fig. 8(C) and Table S6†). As listed in Table S6,† the Tg values of the silica/F-SSBR vulcanizates increased significantly compared with that of the silica/SSBR vulcanizate owing to the restriction on movement of the rubber chains by the “glass polymer layer”.53,54
In the tire industry, it is well known that a high tan![[thin space (1/6-em)]](https://www.rsc.org/images/entities/char_2009.gif) δ value at 0 °C (tan
δ value at 0 °C (tan![[thin space (1/6-em)]](https://www.rsc.org/images/entities/char_2009.gif) δ (0 °C)) implies excellent wet skid resistance.55 As presented in Fig. 8(C) and Table S6,† the vulcanizates were ordered as follows with respect to the wet skid resistances: silica/SSBR < silica/SSBR/Si69 < silica/SSBR-g-MPL70 < silica/SSBR-g-MUA70 < silica/SSBR-g-MPTES70, indicating that the gradually improving interfacial interaction was beneficial to improving the wet skid resistance. The wet skid resistances of the silica/SSBR-g-MPTES vulcanizates improved with increasing MPTES contents. Compared with silica/SSBR vulcanizate, the wet skid resistances of silica/SSBR-g-MPL70, silica/SSBR-g-MUA70, and silica/SSB-g-MPTES70 vulcanizates improved by 112.7%, 161.2%, and 184.3%, respectively (Table S6†).
δ (0 °C)) implies excellent wet skid resistance.55 As presented in Fig. 8(C) and Table S6,† the vulcanizates were ordered as follows with respect to the wet skid resistances: silica/SSBR < silica/SSBR/Si69 < silica/SSBR-g-MPL70 < silica/SSBR-g-MUA70 < silica/SSBR-g-MPTES70, indicating that the gradually improving interfacial interaction was beneficial to improving the wet skid resistance. The wet skid resistances of the silica/SSBR-g-MPTES vulcanizates improved with increasing MPTES contents. Compared with silica/SSBR vulcanizate, the wet skid resistances of silica/SSBR-g-MPL70, silica/SSBR-g-MUA70, and silica/SSB-g-MPTES70 vulcanizates improved by 112.7%, 161.2%, and 184.3%, respectively (Table S6†).
Conclusions
The in-chain functionalized SSBRs (F-SSBRs) with –OH, –COOH, and –Si–(OCH2CH3)3 could contribute to various interfacial interaction modes at the molecular level with the silanols of silica in the composites, including single hydrogen bond interactions, dual hydrogen/covalent bond interactions, and single covalent bond interactions. As the modes of the interfacial interaction followed the order single hydrogen bonds to dual hydrogen/covalent bonds to single covalent bonds, the composites were ordered as follows with respect to the interfacial interactions: silica/SSBR-g-MPL < silica/SSBR-g-MUA < silica/SSBR-g-MPTES. Moreover, the interfacial interactions were improved with increasing grafting percentages of functional group. As the interfacial interactions were enhanced, the filler–filler networks decreased and the filler–rubber networks increased gradually. As a result, the silica dispersions, low rolling resistances, and wet skid resistances of the silica/F-SSBR composites greatly enhanced with the improving interfacial interactions, and they were even better than those of the silica/SSBR/Si69 composite. The rolling resistances of the silica/SSBR-g-MPL, silica/SSBR-g-MUA, and silica/SSBR-g-MPTES composites decreased by 21.2%, 27.3%, and 50.8%, respectively. The wet skid resistances of the silica/SSBR-g-MPL, silica/SSBR-g-MUA, and silica/SSBR-g-MPTES composites increased by 112.7%, 161.2%, and 184.3%, respectively. However, although the filler–rubber networks and the filler dispersion improved, the intermolecular interaction of the rubber also significantly increased. The excessively strong rubber–rubber networks led to poor mechanical properties. Therefore, to achieve excellent performances of the composites, it was necessary to achieve a balance between the filler–filler, rubber–rubber, and filler–rubber networks. This meant that the grafting percentages of the functional group had an upper application limit for improving the overall performances of the composites. The above balance was achieved in the silica/SSBR-g-MUA70 composite, which had excellent overall performances of high strength, low rolling resistance, and high wet skid resistance. It is expected that this research will provide a positive and meaningful reference for the development of high-performance “green tires”.Conflicts of interest
There are no conflicts to declare.Acknowledgements
This work was supported by the National Natural Science Foundation of China (Grant no. 51473010 and 51373009) and the National Basic Research Program of China (Grant no. 2015CB654701).References
- Z. Sun, Q. Huang, Y. Wang, L. Zhang and Y. Wu, Ind. Eng. Chem. Res., 2017, 56, 1471–1477 CrossRef CAS.
- A. Hilonga, J.-K. Kim, P. B. Sarawade, D. V. Quang, G. N. Shao, G. Elineema and H. T. Kim, J. Ind. Eng. Chem., 2012, 18, 1841–1844 CrossRef CAS.
- L. Qu, G. Yu, L. Wang, C. Li, Q. Zhao and J. Li, J. Appl. Polym. Sci., 2012, 126, 116–126 CrossRef CAS.
- Z. Tang, J. Huang, X. Wu, B. Guo, L. Zhang and F. Liu, Ind. Eng. Chem. Res., 2015, 54, 10747–10756 CrossRef CAS.
- T. Xu, Z. Jia, Y. Luo, D. Jia and Z. Peng, Appl. Surf. Sci., 2015, 328, 306–313 CrossRef CAS.
- Y. Li, B. Han, L. Liu, F. Zhang, L. Zhang, S. Wen, Y. Lu, H. Yang and J. Shen, Compos. Sci. Technol., 2013, 88, 69–75 CrossRef CAS.
- Y. Li, B. Han, S. Wen, Y. Lu, H. Yang, L. Zhang and L. Liu, Composites, Part A, 2014, 62, 52–59 CrossRef CAS.
- J.-Y. Lee, N. Park, S. Lim, B. Ahn, W. Kim, H. Moon, H. Paik and W. Kim, Compos. Interfaces, 2017, 24, 711–727 CrossRef CAS.
- Y. Wu, Q. Zhao, S. Zhao and L. Zhang, J. Appl. Polym. Sci., 2008, 108, 112–118 CrossRef CAS.
- X. Liu, S. Zhao, X. Zhang, X. Li and Y. Bai, Polymer, 2014, 55, 1964–1976 CrossRef CAS.
- T. E. Hogan, A. Randall, W. L. Hergenrother and C. J. Lin, Rubber World, 2010, 242, 38–42 CAS.
- L. Qu, L. Wang, X. Xie, G. Yu and S. Bu, RSC Adv., 2014, 4, 64354–64363 RSC.
- Y. Luo, L. Qu, H. Su, T. W. Chan and S. Wu, RSC Adv., 2016, 6, 14643–14650 RSC.
- G. G. A. Böhm and M. N. Nguyen, J. Appl. Polym. Sci., 1995, 55, 1041–1050 CrossRef.
- G. A. Böhm, W. Tomaszewski, W. Cole and T. Hogan, Polymer, 2010, 51, 2057–2068 CrossRef.
- K. Kim, B. Seo, J.-Y. Lee, B.-J. Choi, G.-H. Kwag, H.-J. Paik and W. Kim, Compos. Interfaces, 2015, 22, 137–149 CrossRef CAS.
- K. Kim, J.-Y. Lee, S.-H. Lim, G.-H. Kwag, H. Paik and W. Kim, Compos. Interfaces, 2016, 23, 607–621 CrossRef CAS.
- Y. Gao, J. Liu, J. Shen, D. Cao and L. Zhang, Phys. Chem. Chem. Phys., 2014, 16, 18483–18492 RSC.
- S. Ostad–Movahed, K. A. Yasin, A. Ansarifar, M. Song and S. Hameed, J. Appl. Polym. Sci., 2008, 109, 869–881 CrossRef.
- L. Qu, G. Yu, X. Xie, L. Wang, J. Li and Q. Zhao, Polym. Compos., 2013, 34, 1575–1582 CrossRef CAS.
- H. Qiao, R. Wang, H. Yao, X. Wu, W. Lei, X. Zhou, X. Hu and L. Zhang, Polymer, 2015, 79, 1–11 CrossRef CAS.
- L. Lotti, S. Coiai, F. Ciardelli, M. Galimberti and E. Passaglia, Macromol. Chem. Phys., 2009, 210, 1471–1483 CrossRef CAS.
- F. Schapman, J. P. Couvercelle and C. Bunel, Polymer, 1998, 39, 4955–4962 CrossRef CAS.
- J. Zheng, D. Han, X. Ye, X. Wu, Y. Wu, Y. Wang and L. Zhang, Polymer, 2018, 135, 200–210 CrossRef CAS.
- M. Fuji, T. Takei, T. Watanabe and M. Chikazawa, Colloids Surf., A, 1999, 154, 13–24 CrossRef CAS.
- M. Fuji, S. Ueno, T. Takei, T. Watanabe and M. Chikazawa, Colloid Polym. Sci., 2000, 278, 30–36 CrossRef CAS.
- D. An, Z. Wang, X. Zhao, Y. Liu, Y. Guo and S. Ren, Colloids Surf., A, 2010, 369, 218–222 CrossRef CAS.
- R. Qu, H. Liu, Q. Zhang, A. Flamm, X. Yang and Z. Wang, Thermochim. Acta, 2012, 527, 99–111 CrossRef CAS.
- Y. L. Zhao, S. Köppen and T. Frauenheim, J. Phys. Chem. C, 2011, 115, 9615–9621 CrossRef CAS.
- T. Xu, Z. Jia, L. Wu, Y. Chen, Y. Luo, D. Jia and Z. Peng, Appl. Surf. Sci., 2017, 423, 43–52 CrossRef CAS.
- M. C. W. Somaratne, N. M. V. K. Liyanage and S. Walpalage, J. Appl. Polym. Sci., 2014, 131, 40380 CrossRef.
- Z. Li and Y. Zhu, Appl. Surf. Sci., 2003, 211, 315–320 CrossRef CAS.
- C. G. Robertson, C. J. Lin, R. B. Bogoslovov, M. Rackaitis, P. Sadhukhan, J. D. Quinn and C. M. Roland, Rubber Chem. Technol., 2011, 84, 507–519 CrossRef CAS.
- M. Castellano, A. Turturro, E. Marsano, L. Conzatti and S. Vicini, Polym. Compos., 2014, 35, 1603–1613 CrossRef CAS.
- M. Mohsen, M. H.-A.-E. Salam, A. Ashry, A. Ismail and H. Ismail, Polym. Degrad. Stab., 2005, 87, 381–388 CrossRef CAS.
- S. Wolff, M. Wang and E. Tan, Rubber Chem. Technol., 1993, 66, 163–177 CrossRef CAS.
- S. Choi, J. Appl. Polym. Sci., 2002, 83, 2609–2616 CrossRef CAS.
- J. Shen, J. Liu, Y. Gao, X. Li and L. Zhang, Soft Matter, 2014, 10, 5099–5133 RSC.
- E. Jaber, H. Luo, W. Li and D. Gersappe, Soft Matter, 2011, 7, 3852–3860 RSC.
- M. Wang, Rubber Chem. Technol., 1998, 71, 520–589 CrossRef CAS.
- P. Raut, N. Swanson, A. Kulkarni, C. Pugh and S. C. Jana, Polymer, 2018, 148, 247–258 CrossRef CAS.
- Y. Gui, J. Zheng, X. Ye, D. Han, M. Xi and L. Zhang, Composites, Part B, 2016, 85, 130–139 CrossRef CAS.
- H. Qiao, M. Chao, D. Hui, J. Liu, J. Zheng, W. Lei, X. Zhou, R. Wang and L. Zhang, Composites, Part B, 2017, 114, 356–364 CrossRef CAS.
- A. R. Payne, J. Appl. Polym. Sci., 1962, 6, 57–63 CrossRef CAS.
- A. R. Payne and R. E. Whittaker, J. Appl. Polym. Sci., 1972, 16, 1191–1212 CrossRef CAS.
- J. Fröhlich, W. Niedermeier and H.-D. Luginsland, Composites, Part A, 2005, 36, 449–460 CrossRef.
- W. Lei, X. Zhou, T. P. Russell, K. Hua, X. Yang, H. Qiao, W. Wang, F. Li, R. Wang and L. Zhang, J. Mater. Chem. A, 2016, 4, 13058–13062 RSC.
- L. R. Evans and W. C. Fultz, Rubber World, 1998, 219, 38–44 CAS.
- O. Aso, J. I. Eguiazábal and J. Nazábal, Compos. Sci. Technol., 2007, 67, 2854–2863 CrossRef CAS.
- L. J. Murphy, M. Wang and K. Mahmud, Kautsch. Gummi Kunstst., 1998, 51, 348–360 Search PubMed.
- C. G. Robertson, C. J. Lin, M. Rackaitis and C. M. Roland, Macromolecules, 2008, 41, 2727–2731 CrossRef CAS.
- P. Ma, J. Kim and B. Tang, Carbon, 2006, 44, 3232–3238 CrossRef CAS.
- H. Qiao, R. Wang, H. Yao, X. Zhou, W. Lei, X. Hu and L. Zhang, Polym. Chem., 2015, 6, 6140–6151 RSC.
- Y. Gao, J. Liu, L. Zhang and D. Cao, Macromol. Theory Simul., 2014, 23, 36–48 CrossRef CAS.
- H. Takino, R. Nakayama, Y. Yamada, S. Kohjiya and T. Matsuo, Rubber Chem. Technol., 1997, 70, 584–594 CrossRef CAS.
Footnote |
| † Electronic supplementary information (ESI) available. See DOI: 10.1039/c9ra02783a |
| This journal is © The Royal Society of Chemistry 2019 |

