 Open Access Article
Density functional theory (DFT) investigation on the structure and photocatalysis properties of double-perovskite Gd1−xCaxBaCo2O5+δ (0 ≤ x ≤ 0.4)†
Rong Zhang ac,
Bo Xiang*b,
Lei Xuac,
Liru Xiaac and
Chunhua Lu*d
aInstitute of Agricultural Facilities and Equipment, Jiangsu Academy of Agricultural Sciences, Nanjing 210014, P. R. China
bCollege of Science, Nanjing Forestry University, Nanjing 210037, P. R. China. E-mail: xiangbo@njfu.edu.cn
cKey Laboratory of Protected Agriculture Engineering in the Middle and Lower Reaches of Yangtze River, Ministry of Agriculture, Nanjing 210014, P. R. China
dCollege of Materials Science and Engineering, Nanjing Tech University, Nanjing 210009, P. R. China. E-mail: chhlu@njtech.edu.cn
First published on 27th June 2019
Abstract
GdBaCo2O5+δ (GCBC) has been widely used in various applications because of its unique structural characteristics. However, calcium-doped GCBC materials have not been comprehensively studied in terms of their structure and catalytic properties. Based on the first-principles density functional theory, the structure and electronic density of states were revealed by experiments and simulations. Ca-doping has a great influence on the materials' crystal structure, optical absorption, and catalytic performance. Furthermore, Gd0.8Ca0.2BaCo2O5+δ show the best efficiency in the photocatalytic degradation of congo red (C32H22N6Na2O6S2). The presented Ca-doping method affects the overall band structure, electron cloud distribution, and electronic density of states to strengthen the charge-transfer between O-2p and Co-3d orbitals, and Co may be an active site. Our results provide a deep and systematic study on Gd1−xCaxBaCo2O5+δ based on theoretical calculations and experiments, including analysis of crystal structure, electron distribution, and catalytic performance.
1. Introduction
With the rapid development of the social economy, people gradually enhance their awareness of environmental protection. Advances in photocatalytic technology are beneficial for the degradation of organic matter in gas and waste liquids. In recent years, photocatalysis research mainly concentrated on semiconductors1,2 (TiO2, ZnO), composite oxides3–5 (AgVO4, K2TI2O5 and BiVO4), and perovskite-type composite oxides as photocatalysts.6,7 In perovskite-type compounds, both positions A and B can be replaced by other metal ions with similar radiuses, which keep the crystal structure basically unchanged. In theory, perovskite is an ideal material to study the catalyst surface and catalytic properties. Furthermore, perovskite has the advantages of adjustable elemental composition, abundant physical and chemical properties, and structural stability, such as LaMnO3,8 BaNiO3,9 LaCrO3.10In recent years, GdBaCo2O5+δ (GCBC) has been highly valued due to its rich physical properties such as metal–insulator transformation, magnetoresistance effect, spin-state transformation, charge sequence, and magnetic transformation.11–13 It exhibits a two-layer perovskite structure consisting of [CoO2]–[BaO]–[CoO2]–[GdOδ] units ordered in the direction of the c axis. It not only possesses good oxygen diffusion properties, but also contains cobalt ions with different valences. In addition, each valence state of cobalt may also have a variety of spin states depending on the oxygen content for different δ. Coulaud et al.14 have investigated the structural, magnetic and chemical properties of GdBaCo2O5.5 (GBCO) by density-functional calculations in the DFT+U formalism. Within the GGA-PBE+U approximation for modelling the properties of GBCO, a strong electronic correlation affecting the 3d electrons of cobalt (Co3+ + e− → Co2+) was found, and the GdO0.5 plane was determined as the most favorable site for oxygen removal. Taskin et al.15 prepared layered perovskite GBCO, and its transport, magnetic, and structural properties have been studied with the floating-zone method. It has been proved that this compound presents an interesting system due to its rich phase diagrams emanating from the competition of numerous spin–charge–orbital ordered phases. The stable magnetic structure and Co spin states of Fe-doped GBCO were investigated by DFT calculations, revealing that the most stable underground state is the G-type antiferromagnetic ordering and that Co exhibits a high-spin (HS) state.16 Wu et al. showed that the 3d states of Co (HS) are deeply localized in the valence band.17 Furthermore, we have previously conducted a series of studies on GCBC and its doping, which demonstrated that Ca-doping can increase the solar absorption, facilitate the disproportionation of Co3+ into Co2+ and Co4+, and improve the electrical conductivity.18 In conclusion, we found that cobalt and oxygen play important roles in the complex structure and rich performance of GCBC. However, no reports on the structure and catalytic properties of GCBC and its Ca-doping in combination with DFT theory have been published to date. Therefore, we investigated the impact of Ca-doping on the photocatalytic degradation of congo red (C32H22N6Na2O6S2). The chemical structural molecular formula of congo red was shown in Fig. S1.†
We first employed first-principles computations to model the Ca-doped GCBC system and investigate the crystal and electronic structures of GBCO, focusing on the band structure and densities of states. Furthermore, we prepared Gd1−xCaxBaCo2O5+δ (0 ≤ x ≤ 0.4) through sol–gel substitution of Ca cations as electron dopant. Compared with GCBC, we found that the photocatalytic activity of Gd0.8Ca0.2BaCo2O5+δ on the degradation of congo red is higher under xenon lamp irradiation.
2. Experimental section
2.1 DFT calculations
First-principles calculations were based on DFT with a generalized gradient approximation (GGA) in the form of the Perdew–Burke–Ernzerhof (PBE) function for the exchange–correlation potential. All calculations were performed using the Cambridge Serial Total Energy Package (CASTEP), which reliably describes the double perovskite structure.14 Due to the strong electrostatic repulsion between the 3d electrons of Co, Local Density Functional (LDF) +U (Hubbard) approach was applied for geometry optimization. The U values for both the d-orbitals of Co and the f-orbitals of Gd were set at 5.0 eV. In addition, high spin and G-AFM were selectively applied as the initial setting for all following calculations.2.2 Material synthesis
Individual solutions of 0.1 M of Gd(NO3)3·6H2O (Aladdin Chemicals), Ca(NO3)2·4H2O (Xi-Ya Chemicals), Ba(NO3)2 (JHD Chemicals) and Co(NO3)2·4H2O (Aladdin Chemicals) were prepared by dissolving the nitrates in distilled water. The amount was according to the stoichiometry of perovskite Gd1−xCaxBaCo2O5+δ (0 ≤ x ≤ 0.4). EDTA (Ling-Feng Chemicals) and C6H8O7·H2O (Sinopharm Chemicals) were used as chelation agents and NH4OH (Ling-Feng Chemicals) was applied to adjust the pH (9) of solution mixture. The mixture was kept stirring at 75 °C for 12 h and then heat-treated at 200 °C for 8 h to form the solid precursor. Then the mixture was calcined at 900 °C in air for 4 h to yield the final products.2.3 Material characterizations
Powder X-ray diffraction (XRD) measurements of the samples were conducted on an X-ray diffractometer (SmartLab-9 KW, Rigaku) using Cu Kα radiation. The scans were performed in the range of 20–80° with an angle step of 0.02° per second. UV-visible spectral measurement was conducted by a spectrometer with an integrating sphere (Shimadzu UV3600, Japan). The spectral region used to conduct the UV-visible absorption was from 250 to 800 nm. Barium sulfate was used as a white reference. The temperature test was recorded with a solar simulator (Solar 3A, NEWPORT, America) equipped with a temperature sensor. The surface chemical environments were analyzed by X-ray photoelectron spectroscopy (XPS) equipped with a Versa Probe system (Thermo Fisher Scientific) and monochromatic Al Kα X-rays, using contaminant carbon C-1s = 284.8 eV to calibrate all the binding energy data. During the photocatalytic experiment process, photocatalytic congo red degradation was carried out in a vessel connected with a circulating cooling system keeping the temperature below 25 °C. The xenon lamp with full spectrum irradiation was employed as the light source to drive the reaction. 50 mg of as-prepared photocatalyst was dispersed in 100 mL of congo red water solution (25 mg L−1). At certain time intervals, 4 mL of the suspension was collected and then the photocatalyst was removed by centrifugation. The photocatalytic degradation efficiency of congo red was analyzed on the UV-vis-NIR spectrophotometer (Shimadzu UV3600, Japan) by recording the absorption spectrum of the aqueous solution.3. Results and discussion
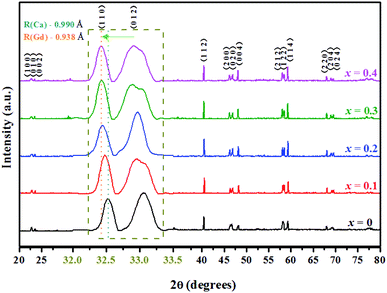
The XRD patterns of the double perovskite-type oxide ceramic Gd1−xCaxBaCo2O5+δ (0 ≤ x ≤ 0.4) are presented in Fig. 1, and the corresponding unit cell parameters calculated with the Jade software are listed in Table S1.† Comparison between undoped and doped samples shows that no new phase was generated during the doping process (Fig. 1). To explore the exact doping position of Ca2+, the main XRD diffraction peaks of the samples were compared, revealing that the main diffraction peaks shifted gradually toward a lower diffraction angle with an increasing Ca2+ doping content. Furthermore, the fitting results (Table S1†) showed that both cell volume and lattice parameters of the doped samples slightly increased compared with the undoped ones, which may have an impact on the photothermal and catalytic properties. The position of 2-theta gradually shifted with the increase of Ca doping. According to Bragg diffraction law, it can be concluded that interplanar spacing gradually increases, and hence lattice parameter changes.19In addition, the crystal structure was elucidated by DFT calculations. We built the structure models of GdBaCo2O5+δ, and all model structures are double perovskite structures where BaO–CoO2–GdO0.5–CoO2 layers are arranged along the z-axis (Fig. 2). Materials studio software was used to build super-cells containing 38 atoms (4 Gd atoms, 4 Ba atoms, 8 Co atoms and 22 O atoms). To ensure that the accuracy and efficiency of simulation results, mesh convergence was tested by increasing the cutoff energy and k points (Fig. S5†). Enough k points (2 × 2 × 2) were chosen to ensure that there was no significant change in the calculated energies when a larger number of k points was used. The cutoff for the plane-wave basis was set at 650 eV. For investigating the effect of the Ca doping in GCBC on the energy band gap configuration the structures were modeled. The Ca-doped super-cell was obtained by replacing Gd3+ by Ca2+, and its structure was optimized. In order to calculate the energy of the material system, we assimilated the wave functions in the Brillouin zone, and these points were adapted by summing up some selected k-points (Fig. 2c). DFT calculation results show a slightly larger Ca–O bond distance for the doped model than for the undoped one as well as a changed Co–O–Co bond angle (Fig. 2d), which indicates that substitutional doping of Ca2+ leads to crystal lattice expansion. Meanwhile, from the XRD analysis of the samples, it can be seen that with the increase of Ca2+ doping, the main diffraction peaks gradually shifted to the lower diffraction angle. Combined with fitting results (Table S1†), it shows that the cell volume of doped samples increases slightly compared with that of non-doped samples. It can be concluded that the volume change trend of simulation and experiment shows the same situation, which indicates that Ca has been doped successfully and that simulation has a certain reference value for experiment.
The absorption spectrum of Gd1−xCaxBaCo2O5+δ (0 ≤ x ≤ 0.4) in the wavelength range between 300 to 800 nm was measured by UV-vis-NIR spectrophotometry (Fig. 3a). The ordinate of Fig. 3a displays the absorbance calculated from the measured UV-vis reflectance by the Kubelka–Munk equation.20 The cutoff wavelength of the Ca-doped samples is red shifted compared with the undoped ones. Furthermore, within the wavelength range of 300 to 800 nm, the Ca-doped samples show a stronger light absorption capacity, which varies with the doping content.
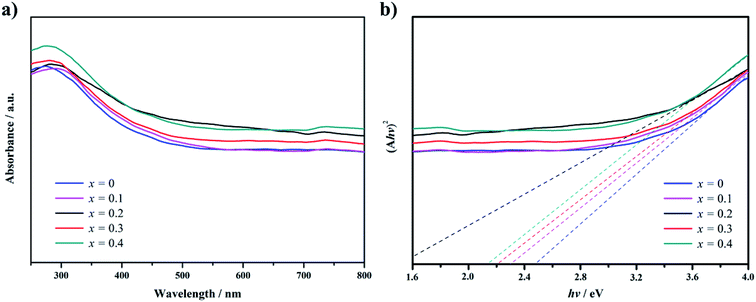 | ||
| Fig. 3 UV-visible absorption spectra (a) and plots of (Ahv)2 versus the energy of exciting light of (hv) (b) for Gd0.8Ca0.2BaCo2O5+δ. | ||
Fig. 3b was obtained by transformation of Fig. 3a applying eqn (1) and used to estimate the band gap of the samples, revealing a narrower band gap for the Ca-doped samples than for the undoped one. Thus, GCBC samples can be excited by low-energy photons, which expands the absorption spectrum of the GCBC samples.
| (Ahv)n = hv − Eg | (1) |
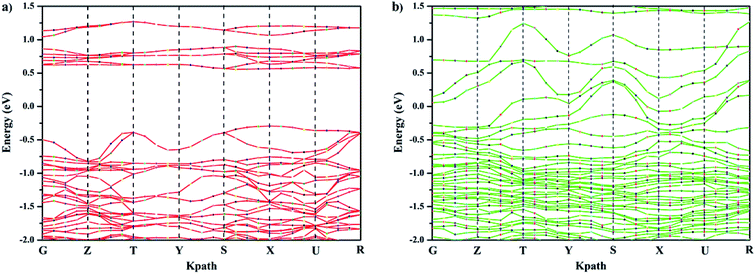
The band gap is associated with the crystal structure and the binding properties of the atoms, and its width depends mainly on the energy-band structure of the semiconductors. Ca-doped models show narrower band gaps resulting from the interaction between cobalt and oxygen (Fig. 4, 5, and S2†), corresponding to Fig. 3. This indicates that GCBC has been successfully doped with Ca2+, which changes the UV-visible absorption capacity and band structure. According to the literature,22,23 although no direct relationship exists between band gap width and photocatalytic activity, the band gap width determines the photoresponse range of the catalyst. Furthermore, the positions of valence and conduction bands play a decisive role in the photocatalytic properties.
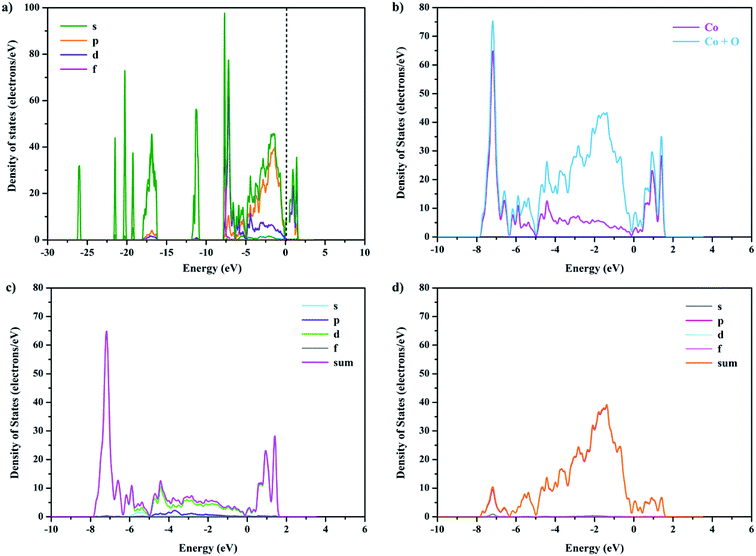
To further clarify the effect of Ca doping on the electronic band structure of GCBC, total and partial electronic densities of states for s, p, d, and f were calculated (Fig. 5 and S2†). The Kohn–Sham band gap mainly results from the charge-transfer between the orbitals O-2p → Co-3d. Comparison between Fig. 5 and S2† shows that the electronic density of states has changed, which is attributed to the strong electronic correlation effects of the Co-3d orbitals. It can be concluded that the substitution of Gd3+ by Ca2+ strengthens the chemical bond between cobalt and oxygen and affects the hybrid bond.
To study the relationship among photothermal, catalytic, and conductive properties of the materials, the photothermal properties were investigated with a solar simulator (Fig. 6), showing that the sample temperature rises with increasing irradiation power when the irradiation time is constant. Moreover, the sample temperature rises first and eventually levels off with increasing irradiation time at the same irradiation power. It is worth noting that the materials doped with 0 and 0.1 at% Ca2+ exhibited better photothermal properties. Upon light energy absorption, the electrons of the semiconductor will be elevated from the ground state to the excited state. At the same time, the excited electrons release the absorbed energy in the form of light (radiative recombination) upon transition from the excited state back to the ground state, which is called luminescence. The absorbed energy can also be radiated in the form of heat (nonradiative recombination).24 As reported in literature,25 the particle defect will generate heat under photoexcitation, playing the same role as in local surface plasma resonance. The nature of photothermal conversion is the energy transition from electrons to the lattice, generating phonons. Phonons are heat carriers, and photothermal conversion is the energy conversion between photon and phonon. Therefore, assuming absence of distortion in the crystal structure as well as of electron–phonon coupling, the photothermal effect is inversely proportional to catalytic and conductive effects when the energy input is constant.
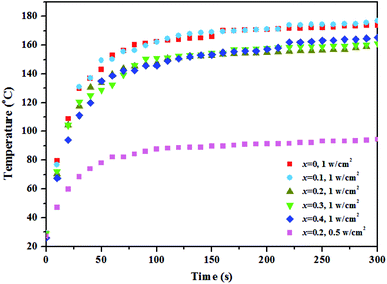 | ||
| Fig. 6 The changing temperature of Gd1−xCaxBaCo2O5+δ (0 ≤ x ≤ 0.4) varies with the irradiation time under the different optical power density. | ||
Based on the above analysis, the band gap of the GCBC samples is less than 3.0 eV, indicating that these samples are easily excited by UV or visible light to generate electrons or charges. This makes GCBC suitable for water splitting and degradation of organic pollutants. Fig. 7 shows the degradation rate curves of congo red upon photocatalysis on Gd1−xCaxBaCo2O5+δ (0 ≤ x ≤ 0.4) as well as the irradiation of a 300 W xenon lamp.
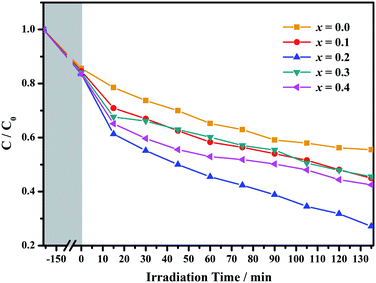 | ||
| Fig. 7 The degradation rate curve of congo red under the photocatalysis of Gd1−xCaxBaCo2O5+δ (0 ≤ x ≤ 0.4). | ||
Powders with different Ca doping amounts have different catalytic effects on congo red (Fig. 7). Obviously, the degradation rate of the doped samples is faster than that of the undoped one, and the threshold is at a doping amount of 0.2 at%. The better catalytic effect of the doped samples is mainly attributed to the smaller band gap and other reasons such as light absorption capacity, transport and separation of electrons/charges, and the interaction between the electrons/charges and the surface material. According to the literature,26 doping with alkaline earth metal ions alters the valence state of Co in cobalt oxides. As shown in Fig. 8, the cell structure of Gd1−xCaxBaCo2O5+δ (0 ≤ x ≤ 0.5) and its electron cloud distribution equivalent surface are calculated. According to Bohr's theory, electrons all have definite orbits. In quantum mechanics, the probability that electrons will appear somewhere can be obtained by calculation. Therefore, in order to visualize the distribution of electrons in space and the law, we calculate the density surface of the electronic cloud by DFT. As can be seen from Fig. 8, the doping of Ca2+ leads to a change in the density of the electron cloud of the system, and the density of the electron cloud near the Gd atom is denser than that near the Ca atom. In order to keep the system electrically neutral, Co4+ will be introduced into the band gap, which induces the generation of Co3+–O–Co4+ to increase the charge carrier concentration. In addition, doping with Ca2+ will produce oxygen vacancies, anion gaps, and holes. In the light of Hume-Rothery theory,27 Ca2+ doping of GCBC results in the formation of a solid solution. Therefore, one can draw the conclusion that charge carriers are localized between the Co-3d and O-2p orbitals. Formation of oxygen vacancies can be expressed by the following eqn (2) and (3):
 | (2) |
 | (3) |
 | ||
| Fig. 8 Crystal structure (a) and equivalent plane for electron cloud distribution maps of Gd1−xCaxBaCo2O5+δ (0 ≤ x ≤ 0.5): (b) x = 0, (c) 0.25. | ||
The above equations reveal that Ca2+ doping increases the carrier concentration. As the doping amount increases, a certain amount of oxygen vacancies, impurities, and defects are generated in the system. The oxygen vacancy concentration has a significant effect on the electronic structure, as it changes the bandgap width and induces the formation of new defect energy levels or shallow donor levels. At the material surface, oxygen vacancies serve as photoelectron capture centers and increase the number of electrons involved in the surface reaction, causing a decrease in the recombination of photoelectrons and holes to improve the catalytic performance. Meanwhile, this defect also alters the band structure, which in turn affects the electron transfer and, ultimately, the system stability. Consequently, the oxygen vacancy concentration should be maintained within a certain range for a good system stability. Furthermore, the introduction of oxygen vacancies results in the formation of defect energy levels in the band gap, which narrows the distance between valence and conduction bands, thereby increasing the conductivity.
To further study the chemical composition of the sample surface as well as the valence state of Co and O, X-ray energy dispersive spectroscopy was employed. Fig. 9, S3, and S4† show the XPS spectra of GCBC samples in different electron binding energy ranges. All spectra were calibrated using the binding energy of carbon (284.8 eV). Fig. S3† shows that obvious peaks of C, Co, and O appear due to photoelectron excitation.
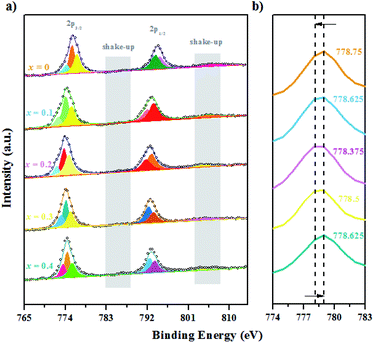 | ||
| Fig. 9 XPS spectra for the GCBC-based specimens: (a) Co-2p core-level (the binding energy is from 765 to 815 eV); (b) Co-2p core-level (the binding energy is from 774 to 783 eV). | ||
It is well known that the Co-2p electron is present in an unstable excited state after photoionization. Co2+ (3d7) possesses strong shake-up satellite peaks at high binding energies (5–6.8 eV), which presents the characteristic structural fingerprint of Co2+.28 The XPS spectrum of Co-2p was processed by Gauss fitting, and the fitting results are displayed in Fig. 9. It shows that Co mainly exhibits the three valence states 2+, 3+, and 4+. Two split peaks are revealed that result from spin–orbit splitting with 2p3/2 as LBE and 2p1/2 as HBE. Moreover, shake-up satellite peaks appear for both Co-2p1/2 and 2p3/2.29 Therefore, the presence of Co2+ can be determined. Fig. 9b shows the magnified Co main peak, revealing that the electron binding energy of the samples decreases first and then increases with the increasing Ca-doping amount. Markedly, the lowest electron binding energy is obtained at a Ca-doping amount of 0.2 at%. While the binding energies of main group elements increase linearly with increasing valence within the same period, transition metal elements show the opposite tendency.30 Therefore, according to the changes in the electron binding energy of the main Co peak, we can deduce that the mixed valence state of Co increases first and then decreases. Certainly, the highest mixed valence state appears at a Ca-doping amount of 0.2 at%. When Gd3+ is replaced by Ca2+, the partial valence of Co will increase. Meanwhile, the substitution of Ca ions generates many oxygen vacancies in the system according to eqn (2) and (3). A high oxygen vacancy concentration will block the electron transport. Then, the mixed valence state of the high valence state Co decreases again due to its instability.
O-1s XPS spectra of Gd0.8Ca0.2BaCo2O5+δ were also processed by Gauss fitting. Atom content and relative atom concentration were analyzed by quantitative elemental analysis of the samples based on the photoelectron peak area. Fig. S4† shows the Gauss fitting results for oxygen in a Ca-doped sample (x = 0.2), proving the existence of both lattice oxygen and adsorption oxygen in the samples. Comparing HBE with LBE peaks reveals that the LBEs are close to 527.25 eV while the HBEs are around 529.75 eV.31 The LBE peak is caused by surface lattice oxygen, and the HBE peak characteristic for weakly bound oxygen is caused by adsorbed oxygen.
4. Conclusions
In conclusion, we successfully increased the efficiency of the photocatalytic degradation of congo red with Ca-doped photocatalysts. Based on experiments supported by DFT calculations, we prove the successful Ca-doping of the GCBC system. Ca-doping changes the UV-visible absorption, the band structure, electron cloud distribution, and electronic density of states of GCBC, and it affects the overall catalytic efficiency by adjusting the distribution of Co valence states and oxygen vacancies due to the strengthening of the charge transfer between O-2p and Co-3d orbitals upon substitution of Gd by Ca. This work proved the significance of optimizing the band structures and improving the density of states, which may encourage research on bandgap engineering for efficient photocatalysis and solar energy conversion systems.Conflicts of interest
There are no conflicts to declare.Acknowledgements
This work was supported by Jiangsu Agriculture Science and Technology Innovation Fund (JASTIF) CX (18) 3049 and Scientific Research Start-up Funds of Nanjing Forestry University (No. 163101127).References
- A. Fujishima, TiO2 Photocatalysis and Related Surface Phenomena, Surf. Sci. Rep., 2008, 63, 515–582 CrossRef CAS.
- D. C. Look, Recent advances in ZnO materials and devices, Mater. Sci. Eng., B, 2001, 80, 383–387 CrossRef.
- W. Zhao, G. Yang, S. Wang, H. He, C. Sun and S. Yang, A novel ternary plasmonic photocatalyst: ultrathin g-C3N4 nanosheet hybrided by Ag/AgVO3 nanoribbons with enhanced visible-light photocatalytic performance, Appl. Catal., B, 2015, 165, 335–343 CrossRef CAS.
- Z. Yang, D. Choi, S. Kerisit, K. M. Rosso, D. Wang, J. Zhang, G. Graff and J. Liu, Nanostructures and lithium electrochemical reactivity of lithium titanites and titanium oxides: A review, J. Power Sources, 2009, 192, 588–598 CrossRef CAS.
- A. Kudo, K. Omori and H. Kato, A Novel Aqueous Process for Preparation of Crystal Form-Controlled and Highly Crystalline BiVO4 Powder from Layered Vanadates at Room Temperature and Its Photocatalytic and Photophysical Properties, J. Am. Chem. Soc., 1999, 121, 11459–11467 CrossRef CAS.
- H. Arai, T. Yamada, K. Eguchi and T. Seiyama, Catalytic combustion of methane over various perovskite-type oxides, Appl. Catal., 1986, 26, 265–276 CrossRef CAS.
- H. Tanaka and M. Misono, Advances in designing perovskite catalysts, Curr. Opin. Solid State Mater. Sci., 2001, 5, 381–387 CrossRef CAS.
- G. Saracco, F. Geobaldo and G. Baldi, Methane combustion on Mg-doped LaMnO3 perovskite catalysts, Appl. Catal., B, 1999, 20, 277–288 CrossRef CAS.
- J. G. Lee, J. Hwang, H. J. Hwang, O. S. Jeon, J. Jang, O. Kwon, Y. Lee, B. Han and Y. G. Shul, A new family of perovskite catalysts for oxygen-evolution reaction in alkaline media: BaNiO3 and BaNi0.83O2.5, J. Am. Chem. Soc., 2016, 138, 3541–3547 CrossRef CAS PubMed.
- G. Saracco, G. Scibilia, A. Iannibello and G. Baldi, Methane combustion on Mg-doped LaCrO3 perovskite catalysts, Appl. Catal., B, 1996, 8, 229–244 CrossRef CAS.
- M. Respaud, C. Frontera, J. L. García-Muñoz, M. Á. G. Aranda, B. Raquet and J. M. Broto, Magnetic and magnetotransport properties of GdBaCo2O5+δ: A high magnetic-field study, Phys. Rev. B: Condens. Matter Mater. Phys., 2001, 64, 214401 CrossRef.
- B. Lin, S. Zhang, L. Zhang, L. Bi, H. Ding, X. Liu, J. Gao and G. Meng, Prontonic ceramic membrane fuel cells with layered GdBaCo2O5+x cathode prepared by gel-casting and suspension spray, J. Power Sources, 2008, 177, 330–333 CrossRef CAS.
- B. Wei, L. Zhe, W. Jiang, X. Zhu and W. Su, Functionally graded cathodes based on double perovskite type GdBaCo2O5+δ oxide, Electrochim. Acta, 2014, 134, 136–142 CrossRef CAS.
- E. Coulaud, G. Dezanneau and G. Geneste, Hydration, oxidation, and reduction of GdBaCo2O5.5 from first-principles, J. Mater. Chem. A, 2015, 3, 23917–23929 RSC.
- A. A. Taskin, A. N. Lavrov and Y. Ando, Transport and magnetic properties of GdBaCo2O5 +x single crystals: A cobalt oxide with square-lattice CoO2 planes over a wide range of electron and hole doping, Phys. Rev. B: Condens. Matter Mater. Phys., 2005, 71, 134411–134428 CrossRef.
- Q. Zhang, X. Wu and E. Kan, Co spin state and magnetic structure in GdBaCo2O5+x and Fe doped compounds: A first principles study, Curr. Appl. Phys., 2016, 16, 1094–1099 CrossRef.
- H. Wu, High spin, hole delocalization and electron transfer in LBaCo2O5.5 (L = Sm, Eu, Gd, Tb, Dy, Y), J. Phys.: Condens. Matter, 2003, 15, 503 CrossRef CAS.
- Y. Lu, R. Zhang, L. Wei, C. Lu, Z. Fang, Y. Ni, Z. Xu and S. Tao, Tuning the electrical and optical properties of Gd1-xCaxBaCo2O5+δ (x=0-0.5) using solar energy, Mater. Chem. Phys., 2016, 176, 44–51 CrossRef CAS.
- L. Castaldi, D. Kurapov, A. Reiter, V. Shklover and J. Patscheider, Tuning the crystallographic and electronic properties of chromium oxynitride films, J. Appl. Phys., 2011, 109, 053720 CrossRef.
- D. Chen, L. Zou, S. Li and F. Zheng, Nanospherical like reduced graphene oxide decorated TiO2 nanoparticles: an advanced catalyst for the hydrogen evolution reaction, Sci. Rep., 2016, 6, 20335 CrossRef CAS PubMed.
- L. Han, P. Hu, Z. Xu and S. Dong, Electrodeposition and photoelectrochemical properties of p-type BiOI alpha Cl1-alpha nanoplatelet thin films, Electrochim. Acta, 2014, 115, 263–268 CrossRef CAS.
- J. P. Mailoa, A. J. Akey, C. B. Simmons, D. Hutchinson, J. Mathews, J. T. Sullivan, D. Recht, M. T. Winkler, J. S. Williams and J. M. Warrender, Room-temperature sub-band gap optoelectronic response of hyperdoped silicon, Nat. Commun., 2014, 5, 3011 CrossRef.
- Z. Frontistis, C. Drosou, K. Tyrovola, D. Mantzavinos, D. Fattakassinos, D. Venieri and N. P. Xekoukoulotakis, Experimental and Modeling Studies of the Degradation of Estrogen Hormones in Aqueous TiO2 Suspensions under Simulated Solar Radiation, Ind. Eng. Chem. Res., 2017, 51, 16552–16563 CrossRef.
- T. Makino, C. H. Chia, N. T. Tuan and Y. Segawa, Radiative and nonradiative recombination processes in lattice-matched (Cd,Zn)O/(Mg,Zn)O multiquantum wells, Appl. Phys. Lett., 2000, 77, 1632–1634 CrossRef CAS.
- F. H. Stephens, V. Pons and R. T. Baker, Ammonia-borane: the hydrogen source par excellence?, Dalton Trans., 2007, 2613–2626 RSC.
- J. Ren, L. Yang, J. Qiu, D. Chen, X. Jiang and C. Zhu, Effect of various alkaline-earth metal oxides on the broadband infrared luminescence from bismuth-doped silicate glasses, Solid State Commun., 2006, 140, 38–41 CrossRef CAS.
- U. Mizutani and H. Sato, The Physics of the Hume-Rothery Electron Concentration Rule, Crystals, 2017, 7, 1–112 CrossRef.
- M. Konsolakis and Z. Ioakeimidis, Surface/structure functionalization of Copper-based catalysts by metal-support and/or metal-metal interactions, Appl. Surf. Sci., 2014, 320, 244–255 CrossRef CAS.
- A. Subardi, C.-C. Chen, M.-H. Cheng, W.-K. Chang and Y.-P. Fu, Electrical, thermal and electrochemical properties of SmBa1−xSrxCo2O5+δ cathode materials for intermediate-temperature solid oxide fuel cells, Electrochim. Acta, 2016, 204, 118–127 CrossRef CAS.
- R. Zhang, Modern Material Analysis Methods, 2007 Search PubMed.
- L. Li, X. Feng, Y. Nie, S. Chen, F. Shi, K. Xiong, W. Ding, X. Q. Qi, J. Hu and Z. Wei, Insight into the effect of oxygen vacancy concentration on the catalytic performance of MnO2, ACS Catal., 2015, 5, 4825–4832 CrossRef CAS.
Footnote |
| † Electronic supplementary information (ESI) available. See DOI: 10.1039/c9ra02820j |
| This journal is © The Royal Society of Chemistry 2019 |

