 Open Access Article
The influence mechanism of nanoparticles on the dielectric properties of epoxy resin
Rui Wang ,
Congzhen Xie*,
Shoukang Luo,
Bin Gou,
Huasong Xu and
Leilei Zeng
School of Electric Power, South China University of Technology, Guangzhou 510641, China. E-mail: congzhen168@163.com
First published on 24th June 2019
Abstract
In order to study the influence mechanism of nanoparticles on the dielectric properties of epoxy resin materials for composite insulators under different nanoparticle filling amounts, the free volume, dielectric relaxation, breakdown strength and trap distribution of the samples were tested by positron annihilation lifetime spectroscopy, breakdown strength, broadband dielectric spectroscopy (BDS) and thermally stimulated current (TSC). The results show that the limiting effect of nanoparticles rapidly reduced the number of traps in the amorphous zone of materials at a low filling amount. As a result, the free path of carriers was increased and the concentration of free volume was decreased, which can limit the injection and transportation of carriers, resulting in the increase of material breakdown strength. At a high filling amount, a large number of interfacial deep traps were introduced into the nanoparticles, and the carrier free volume concentration and size were reduced. The traps inside the material were mainly interfacial deep traps. Under the action of an external electric field, a hetero polar charge was formed on the other end to cause electric field distortion, thus the breakdown field strength of the material was weakened.
1. Introduction
Epoxy resin is widely used in ultra-high voltage power equipment and the aerospace field due to its excellent short-time breakdown and long-term damage performance.1 With the development of UHV engineering, pure epoxy resin can no longer meet the needs of the power industry. Seeking new materials or modifying existing materials has become a research hotspot at home and abroad.2–10 A large number of studies have shown that the addition of nanoparticles can enhance the electrical properties of the polymer.3–10 Takada found that the addition of nano MgO to LDPE can inhibit the accumulation of space charge by adding more deep traps;8 Xilin Wang found that epoxy resin exhibits nonlinear resistance characteristics above 4000 V cm−1 which can effectively improve the electric field distortion phenomenon.10 Du Boxue found that the addition of nano SiO2 to RTV has a significant inhibitory effect on the growth of electric branches.9 However, the mechanism for the interaction between nanoparticle and polymers is not clear. At present, the consensus point of most researchers is that nanoparticles produce a large number of interfaces in the polymer, and these interfaces affect the dielectric properties of the materials by storing and transporting charge.11–13 In the past decade, researchers had tried to establish various models to explain the dielectric constant, dielectric loss, space charge, conductance, breakdown, electric tree and corona resistance of nanocomposite dielectrics.14–16 Typical models include the single-layer structure model proposed by Lewis,14 the multi-core model proposed by Tanaka et al.15 and a model towards understanding the physics proposed by Linda Schadler.16 These models have laid a solid foundation for understanding the dielectric properties of polymer nanocomposite dielectrics.Nano ZnO is a multifunctional inorganic nanoparticles with a particle size ranging from 1 nm to 100 nm. Due to the grain refinement, nano ZnO has some prominent physical and chemical properties.17 At present, nano ZnO has been used as catalysts, gas sensors, semiconductors, varistors, piezoelectric devices, antibacterial and bactericide, field-emission displays and UV-shielding materials.18–23 However, there are still few studies on the electric properties of epoxy resins by adding nano ZnO. In this paper, the mechanism of interaction between nanoparticles and polymers was described by studying the improvement of electrical properties of epoxy resin by adding nano ZnO.
In this paper, nano ZnO was used as the modified filler, and the surface is treated with silane coupling agent (KH-560) to improve its dispersibility in epoxy. The modification mechanism of nanoparticles on epoxy resin was analyzed by measuring the breakdown voltage, dielectric constant, dielectric loss, thermally stimulated current, space charge and free volume of nanocomposites. The study can provide a theoretical basis for the development of nanocomposites interface models.
2. Experimental
2.1 Materials
Bisphenol A diglycidyl ether was used as a base resin whose trade name was Araldite E-51 (Shenzhen Jitian Chemical Co., Ltd.). Its equivalent weight was 184–194 g eq.−1 and the viscosity was 11![[thin space (1/6-em)]](https://www.rsc.org/images/entities/char_2009.gif) 000–15
000–15![[thin space (1/6-em)]](https://www.rsc.org/images/entities/char_2009.gif) 000 mPa s at 25 °C. Aliphatic modified amine curing agent T-31 was provided by Shenzhen Jitian Chemical Co., Ltd. The nano ZnO, with an average particle diameter of 50 nm, was supplied by Dingxin Wear-Resistant Metal Materials Co., Ltd, China, and dried at 100 °C in vacuum for 1 h before using. Acetone and silane coupling agent KH-560 were purchased from Guangzhou Congyuan Instrument Co., Ltd, China.
000 mPa s at 25 °C. Aliphatic modified amine curing agent T-31 was provided by Shenzhen Jitian Chemical Co., Ltd. The nano ZnO, with an average particle diameter of 50 nm, was supplied by Dingxin Wear-Resistant Metal Materials Co., Ltd, China, and dried at 100 °C in vacuum for 1 h before using. Acetone and silane coupling agent KH-560 were purchased from Guangzhou Congyuan Instrument Co., Ltd, China.
2.2 Sample preparation
The nanocomposites were prepared as follows. Before mixed with the epoxy resin, the nanoparticles were dissolved in acetone with adding 1% weight of silane coupling agent, then dispersed by ultrasonic disperser for 30 minutes. For the uniform dispersion of the fillers in the epoxy resin matrix, two different types of processing techniques, namely mechanical mixing and sonication, were applied. The acetone was removed before adding the curing agent. Then the mixture was evacuated and poured into a preheated mold to accelerate the gelation. The weight proportions of nano ZnO were 0.1, 1, 2.5 and 5%, named #1, #2, #3 and #4, respectively. Specimens of pure epoxy resin named #0 were also prepared for the purpose of comparison. Before the experiment, the specimens were firstly wiped with pure ethanol and then dried in a desiccator at room temperature for over 24 hours.2.3 Characterization
3. Results and discussion
3.1 Morphology analysis of nanocomposites
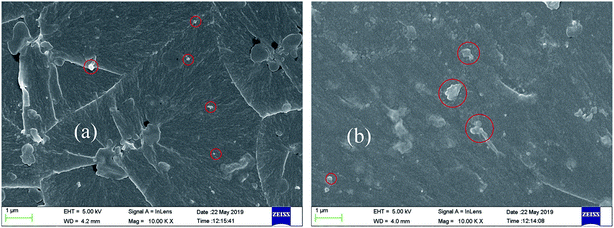
Fig. 1 shows a scanning electron microscopy (SEM) image of freeze-fractured nanocomposite samples with 1% and 5% weight of nano ZnO. The image clearly indicates that nano ZnO particles were protruded out of the fracture surface of the samples. The distribution was satisfactory as the particles were isolated and scattered uniformly in the matrix at 1% filling amount, while agglomeration occurred at 5% addition.3.2 Breakdown voltage of nanocomposites under different filling amounts
The Weibull distribution was proposed by the Swedish physicist Weibull in 1939 and applied to fatigue testing. It reflected the probability of a material being broken down at a certain electric field strength E or the probability of failure at a certain time t. The Weibull distribution was widely used to evaluate the statistical law of the breakdown behavior of insulating materials under alternating electric fields.24–26 The expression of the two-parameter Weibull distribution was showed as follow:
 | (1) |
| lg(−ln(1−P)) = β(lg(E) − lg(E0)) | (2) |
For each determined value of E, the value of P(E) can be calculated by eqn (3).
 | (3) |
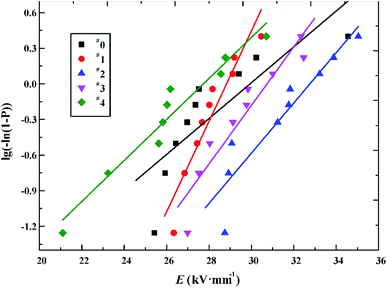
The breakdown characteristics of all samples are presented in Fig. 2. It can be seen that the breakdown strength of epoxy resin enhances first and then weakens with the increase of the content of nano ZnO. The calculation results of Weibull parameters are listed in Table 1. Coppard believes that the value of β can be used to evaluate the defects in the insulating material matrix and the distribution of filling particles.27 The larger value of β, the better dispersion of the inorganic phase in the polymer. The dispersibility of nanoparticles decreases greatly due to agglomeration at the addition amount of nanoparticles reaches 5%, while the dispersibility of nanoparticles is good at low addition amount. When the addition amount of nanoparticles is 1%, the breakdown strength of the material is the highest, reaching 31.83 kV mm−1, 15.6% higher than that of the pure epoxy resin.
| Sample | Shape factor (β) | Breakdown strength (E0, kV mm−1) |
|---|---|---|
| #0 | 0.151 | 27.53 |
| #1 | 0.381 | 28.17 |
| #2 | 0.212 | 31.83 |
| #3 | 0.246 | 29.84 |
| #4 | 0.173 | 26.18 |
3.3 Free volume test
Table 2 shows the free volume pore radius and concentration of epoxy resin material at different nano ZnO filling amount. Where the shortest lifespan τ1 mainly stems from p-Ps annihilation; the second longevity component τ2 derives from the annihilation of positrons in polymer body; and the long-life component τ3 stems from the annihilation of o-Ps, which is related to free volume in the polymer, and its strength I3 reflects the concentration of the free volume of the polymer.28 As can be seen from Table 2, τ3 value of pure epoxy resin is 1.691 ns and I3 value is 33.7%, which corresponds to the quenching of the positron in the free volume of the epoxy resin. The free volume of the nanocomposite epoxy resin decreases with the increase of the filling amount of the nano ZnO. However, at the low filling amount, the free volume of the modified epoxy resin is larger than that of the pure epoxy resin, but less than that of pure epoxy at a filling amount of more than 2.5%. It may be that the nanoparticles agglomerate in the epoxy resin matrix with the increase of the filling amount of nanoparticles. o-Ps not only annihilate in the epoxy resin matrix, but also annihilate in the aggregated nanoparticles. Therefore, the change of τ3 is small at low amount of addition, while τ3 decreases rapidly at high amount of addition.| Samples | τ1 (ns) | I1 (%) | τ2 (ns) | I2 (%) | τ3 (ns) | I3 (%) |
|---|---|---|---|---|---|---|
| #0 | 0.125 | 15.72 ± 0.61 | 0.378 ± 0.005 | 50.58 ± 0.51 | 1.691 ± 0.01 | 33.70 ± 0.29 |
| #1 | 0.125 | 15.69 ± 0.60 | 0.378 ± 0.005 | 50.70 ± 0.50 | 1.699 ± 0.01 | 33.61 ± 0.29 |
| #2 | 0.125 | 17.00 ± 0.59 | 0.384 ± 0.005 | 49.93 ± 0.49 | 1.695 ± 0.01 | 33.07 ± 0.29 |
| #3 | 0.125 | 13.53 ± 0.66 | 0.363 ± 0.004 | 53.77 ± 0.55 | 1.692 ± 0.01 | 32.70 ± 0.27 |
| #4 | 0.125 | 15.74 ± 0.62 | 0.372 ± 0.004 | 51.80 ± 0.52 | 1.677 ± 0.01 | 32.46 ± 0.28 |
In polymers, positron annihilation is characterized by the formation and annihilation of positronium, which is closely related to free volume. Based on the infinite deep spherical potential well model of free volume, the relationship between τ3 and the free volume radius R is expressed by the following formula:
 | (4) |
| fv = I3VF | (5) |
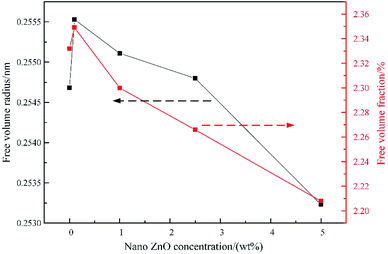
Fig. 3 shows that the free volume fraction shows an overall significant decline with the increase of ZnO nanoparticles. When the amount of nano ZnO reaches 5%, fv decreases from 2.33% to 2.21%. Nanoparticles may have two states in the polymer matrix, namely dispersion state and aggregation state, while the complete dispersion of nanoparticles in the polymer matrix is an ideal state, so the actual situation should be the coexistence of two states. At low addition amount, the dispersed state is much higher than the aggregation state, and a large number of interfaces are formed between the nanoparticles and the polymer matrix. As a result, more positrons are captured by the interface, and no o-Ps is formed, so there is a significant decrease in I3. When the nanoparticles are further increased, the interface volume increases less due to the formation of aggregation state. However, on the other hand, the interaction between nanoparticles and the polymer chain segment limits the movement of the polymer chain and reduces the free volume concentration. S. J. Wang et al. pointed out in their study of micro CaCO3/HDPE composites that the interaction between polymer chain segments and filling particles could slow down the movement of polymer chain segments and reduce the free volume concentration.29 Compared with micron particles, nanoparticles have larger specific surface area and higher surface activity. Under the action of coupling agent, they have stronger interaction with polymer chain segments and stronger action of restricting chain movement. Therefore, the combined effect of multiple actions can significantly reduce the free volume fraction.
3.4 Dielectric properties study
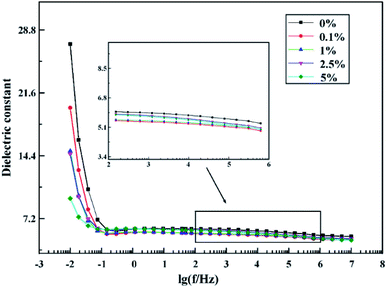
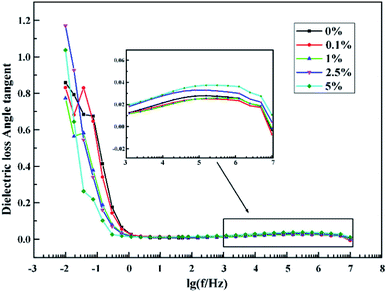
Fig. 4 shows the effect of nano ZnO content on the dielectric constant of the EP/ZnO nanocomposites. It can be seen that the dielectric constant of pure epoxy resin in the whole frequency band (10−2 to 107 Hz) is higher than that of nanocomposites. At low frequencies (10−2 to 10−1 Hz), the dielectric constant decreases with the increase of the content of nanoparticles. However, at middle and high frequencies (102 to 106 Hz), the dielectric constant of nanocomposites with low addition amounts is the smallest. There are several reasons for this phenomenon. First of all, the filling of nanoparticles introduces many interfaces, and these interfaces can limit the movement of the epoxy chain, resulting in the decrease of dielectric constant. Secondly, the addition of nano ZnO also leads to interfacial polarization, also referred to as the Maxwell–Wagner–Sillars (MWS) effect. According to the theory of dielectric, interface polarization appearing in low-frequency region (1 to 103 Hz), can make the dielectric constant of sample increases. However, the experimental results of test samples are reflecting that the dielectric constant of modified EP samples is lower than the unmodified EP samples, it proves that the limiting effect of the interface on the polymer molecular chain is greater than the interfacial polarization at low addition amount. At the test frequency ranging from 103 to 107 Hz, the dielectric constants of the same group of modified EP samples are not significantly different from each other, but still lower than the pure EP, which also proves that two phase interface between nano particles and matrix can block the orientation movement of matrix polar group under applied electric field orientation.Fig. 5 shows the dielectric loss of the neat epoxy and the ZnO/epoxy nanocomposites from 10−2 Hz to 107 Hz. Nanocomposites with 0.1% addition of nanofiller show the same trend with pure epoxy resin. At low frequencies, dielectric loss of epoxy resin decreases with the increase of the filling amount of nanoparticles. However, at high frequencies (>100 Hz), it can be seen that the effect of the content of nano ZnO on the dielectric loss of the composite medium can be ignored. The dielectric loss tends to increase progressively when the frequency is above 105 Hz with the content of ZnO increasing. Moreover, a dielectric loss peak appears in the high frequency band, which may due to the high surface energy of the nanoparticles can absorb the free polar molecules in the matrix and the interface dipole polarization increases with the increase of the interface area. As the electric field frequency increases, the dipolar groups find it difficult to complete the polarization, and increase the effect of polarization relaxation increase which can increase the dielectric loss of the nanocomposites.
3.5 Trap properties of nanocomposites
According to TSDC theory, the thermally stimulated current caused by the trap can be expressed as the following formula:30
 | (6) |
![[thin space (1/6-em)]](https://www.rsc.org/images/entities/char_2009.gif) exp(−Et/kT) is the emission rate of electrons at trap level E and temperature T. k is the Boltzmann constant, d is the sample thickness and β is the heating rate. v is commonly called the frequency factor or attempt-to-escape frequency, typically 1012 s−1. Ev and Ec are the valence band top energy and conduction band bottom energy, respectively.
exp(−Et/kT) is the emission rate of electrons at trap level E and temperature T. k is the Boltzmann constant, d is the sample thickness and β is the heating rate. v is commonly called the frequency factor or attempt-to-escape frequency, typically 1012 s−1. Ev and Ec are the valence band top energy and conduction band bottom energy, respectively.
And the amount of trap charge can be expressed as:
 | (7) |
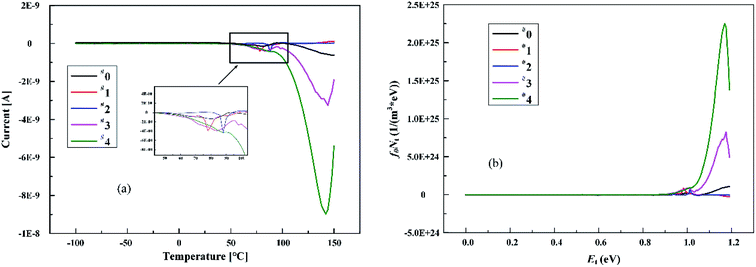
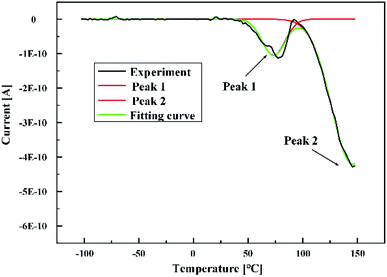
Fig. 6 shows the TSC curves of composites with different nano ZnO contents. The result shows that the depolarization current peaks of pure epoxy resins occurred in the range of 50–100 °C and 100–140 °C, respectively. The current peak at low temperature is mainly contributed by the charge decapitation in shallow traps, while the current peak at high temperature corresponds to the charge decapitation in deep traps. After adding nano ZnO into the epoxy resin, an interesting phenomenon appeared. The deep trap disappeared in the nanocomposites at a low amount (less than 1%), while the content of the deep trap increase rapidly with the increase of the nanoparticle content. The TSC data of the five composites are substituted into eqn (6) and (7) to calculate the trap depth and charge amount of the two current peaks respectively. Qt is defined as the total trapped charge in the material. The data in Table 3 show that the amount of trap charge decrease first and then increase rapidly with the increase of nano ZnO. There are a few physical and chemical defects in the pure epoxy resin, a small number of nanoparticles due to its good dispersion can repair some defects. With the increase of nanoparticles, nanoparticles will introduce a large number of traps as impurities because of agglomeration occurs between the particles. Moreover, the increase of nanoparticles rapidly increases the volume of the internal interface of the material, which can capture a large number of space charges and form a large number of traps.
| Sample | Peak 1 | Peak 2 | Qt/(10−7 C) | ||
|---|---|---|---|---|---|
| Q1/(10−8 C) | H1/eV | Q2/(10−7 C) | H2/eV | ||
| #0 | 3.33 | 1.00 | 2.45 | 1.19 | 2.78 |
| #1 | 2.94 | 0.98 | — | — | 0.29 |
| #2 | 1.51 | 1.01 | — | — | 0.15 |
| #3 | 18.18 | 1.00 | 12.98 | 1.18 | 14.80 |
| #4 | — | — | 38.81 | 1.17 | 38.81 |
It was a common understanding that there are deep traps in the interface of nanocomposite media. Lewis14 and Tanaka15 proposed two different interfacial models of nanocomposite media based on colloidal chemistry and electrostatics respectively, while Tanaka proposed a more complex multi-core model considering the possible relationship between surface-treated nanoparticles and polymer matrix. However, the physical basis of the electric two-layer hypothesis superimposed on the multi-core layer was consistent with Lewis. These models all emphasized the binding effect of interface on charge. The difference between Lewis and Takada's interface model lied in the different formation mechanism of the interface trap, but what they have in common was that there were a large number of deep traps in the interface area. However, neither interface model is associated with the free volume in the composite, the discussion on how free volume and interface trap affect the electrical properties of the composite is discussed below (Fig. 7).
3.6 Modification mechanism analysis of nanocomposites
According to the trap theory of solid media, the energy band of the medium was inclined under the action of the applied electric field. The charge injected from the electrode can pass through Schottky effect cross the barrier to the conduction band, or can tunnel through the trap under the Fowler–Nordheim effect. Because of the narrow width of the conduction band of the polymer medium, the electrons in the conduction band were trapped after a short path. The relaxation time of the captured charge in the trap was determined by the trap energy level and density. The larger trap energy level and density, the longer the relaxation time would be. The carrier needed a longer time and had to overcome a larger trap potential barrier before it can be released.31 The transport process of injected charge in the medium32 included charge injection, migration, trapping, detrapping and recombination. The addition of nanoparticles changed the trap characteristics in the medium, affected the charge transport process, and thus changed the breakdown characteristics.33T. Tanaka proposed a multi-core model to explain the space charge characteristics of nanocomposites. The multi-core model divided the interface between nanoparticles and polymer matrix into three layers, namely, bonded layer, bound layer and loose layer. (1) Bonded layer: there are a large number of unsaturated bonds, hydrogen bonds and organic groups on the surface of nanoparticles modified by silane coupling agent, which can interact with polymer matrix molecules through covalent bonds, ionic bonds, hydrogen bonds and other chemical bonds. The interaction strength between nanoparticles and matrix molecules was affected by the properties of nanoparticles (surface energy, polarity, etc.) and matrix. The strength of bonded layer was the strongest. (2) The bound layer was mainly composed of molecular chains of the polymer matrix. The ordered arrangement of molecular chains in the bound layer were affected by the action intensity and action properties of the bonded layer. The binding strength of the bound layer was not as strong as that of the bonded layer, but the volume fraction of the bound layer was larger, which significantly changed the crystal morphology of the material. Therefore, it can be considered that the bound layer was a region with higher crystallinity. (3) The loose layer was similar to the polymer matrix in nature, with molecular chains randomly arranged around the nanoparticles. The interaction between the loose layer and the particle surface was the weakest. Synthetically, as the distance from the surface of nanoparticles increased, the interaction between the nanoparticles and the matrix gradually weakened. Also, the trap energy level became shallower with the increase of the distance from the surface of the nanoparticles.
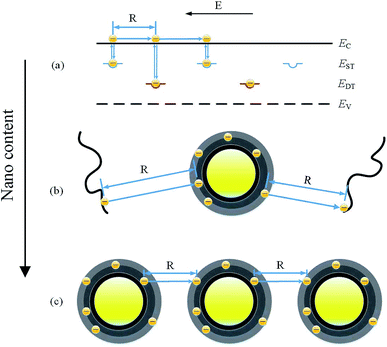
Under the action of external applied electric field E, the energy obtained by the carrier from the electric field after a certain distance λ in the free volume area is E(x)λ. If the energy enables the carrier to cross the trap potential barrier Ea, the carrier will continue to migrate to the other end and forms a hetero polar charge. If the number of carriers with such sufficient energy continues to increase, the hetero polar charge near the electrode will increase, resulting in electric field distortion.
TSC results show that the low addition of nanoparticles can reduce the number of traps in the material, while the high addition of nanoparticles shows the opposite trend. The trap density affects the dielectric constant to some extent, which corresponds to the dielectric spectrum of the composite above. The filling of nanoparticles will introduce a large number of interface traps, and its high surface energy will limit the movement of polymer molecular segments. As shown in Fig. 8, the limiting effect of nanoparticles on polymer chain segments will reduce the trap density in the amorphous zone. At low filling amount, the distance between nanoparticles is larger than that between traps in pure epoxy resin, so the free volume becomes larger. Also, the free volume concentration is decreased due to the limitation of the movement of the polymer chain. As the number of nanoparticles increases, the spacing of nanoparticles decreases, and the free volume concentration and size decrease continuously. The decrease of the free volume radius is beneficial to the improvement of breakdown strength. In addition, the effects of free volume and concentration on breakdown voltage should be combined with the trap density. Therefore, under the combined action of the free volume fraction and the trap density, the breakdown field strength of nanocomposites increases first and then decreases with the filling of nanoparticles.
4. Conclusion
Epoxy resin with high electrical properties was prepared by filling nano ZnO, and the present nanocomposite trap theory was improved. The specific conclusions are as follows:(1) The breakdown field strength of the epoxy resin increased first and then decreased with the addition of nano ZnO, reached the maximum value of 31.83 kV mm−1 at the 1% filling amount. Due to the agglomeration phenomenon of nanoparticles at a high filling amount, resulting in the breakdown voltage at a 5% filling amount is not as good as that of pure epoxy resin.
(2) The filling of nanoparticles will introduce a large number of interfacial deep traps into the polymer. At low filling amount, nanoparticles mainly play a role in limiting the polymer chain, so the number and level of traps decrease rapidly. At high filling amount, the interfacial deep traps introduced by nanoparticles increase rapidly, resulting in the increase of density and energy level of traps. At a low filling amount, the limiting effect of nanoparticles rapidly reduced the traps in the amorphous zone. As a result, the free path of carriers was increased and the concentration of free volume was decreased, which can limit the injection and transportation of carriers, resulting in the increase of material breakdown strength. At a high filling amount, a large number of interfacial deep traps were introduced into the nanoparticles, the carrier free volume concentration and size were reduced. The traps inside the material were mainly interfacial deep traps. Under the action of external electric field, hetero polar charge was formed on the other end to cause electric field distortion, thus the breakdown field strength of the material was weakened.
5. Funding sources
The National Engineering Laboratory Open Fund Project for Ultra High Voltage Engineering Technology (Kunming, Guangzhou, NEL201710).Conflicts of interest
There are no conflicts to declare.Acknowledgements
The financial and technical support of the National Engineering Laboratory Open Fund Project for Ultra High Voltage Engineering Technology (Kunming, Guangzhou, NEL201710) is also acknowledged.References
- Z. Li, G. H. Sheng, X. C. Jiang and T. Tanaka, Effects of inorganic fillers on withstanding short-time breakdown and long-time electrical aging of epoxy composites, IEEJ Trans. Electr. Electron. Eng., 2017, 12, S10–S15 CrossRef CAS.
- R. Wang, C. Z. Xie, L. L. Zeng and H. S. Xu, Thermal decomposition behavior and kinetics of nanocomposites at low-modified ZnO content, RSC Adv., 2019, 9(2), 790–800 RSC.
- E. T. Thostenson, S. Ziaee and T. W. Chou, Processing and electrical properties of carbon nanotube/vinyl ester nanocomposites, Compos. Sci. Technol., 2009, 69(6), 801–804 CrossRef CAS.
- H. Xu, X. Tong, Y. Y. Zhang, Q. W. Li and W. B. Lu, Mechanical and electrical properties of laminated composites containing continuous carbon nanotube film interleaves, Compos. Sci. Technol., 2016, 127, 113–118 CrossRef CAS.
- C. Chen, H. J. Wang, Y. Xue, Z. G. Xue, H. Y. Liu, X. L. Xie and Y. W. Mai, Structure, rheological, thermal conductive and electrical insulating properties of high-performance hybrid epoxy/nanosilica/AgNWs nanocomposites, Compos. Sci. Technol., 2016, 128, 207–214 CrossRef CAS.
- M. S. Cho, S. Y. Park, J. Y. Hwang and H. J. Choi, Synthesis and electrical properties of polymer composites with polyaniline nanoparticles, Mater. Sci. Eng., C, 2004, 24(1–2), 15–18 CrossRef.
- Y. C. Shin, D. Lee, K. Lee, K. H. Ahn and B. Kim, Surface properties of silica nanoparticles modified with polymers for polymer nanocomposite applications, J. Ind. Eng. Chem., 2008, 14(4), 515–519 CrossRef CAS.
- T. Takada, Y. Hayase, Y. Tanaka and T. Okamoto, Space charge trapping in electrical potential well caused by permanent and induced dipoles for LDPE/MgO nanocomposite, IEEE Trans. Dielectr. Electr. Insul., 2008, 15(1), 152–160 CAS.
- B. X. Du, J. G. Su and T. Han, Effects of Low Temperature and Nanoparticles on Electrical Trees in RTV Silicone Rubber, IEEE Trans. Dielectr. Electr. Insul., 2014, 21(4), 1982–1988 Search PubMed.
- X. L. Wang, J. Y. Guo, Y. W. Yao, Z. D. Jia, Q. S. Lv, and R. H. Huang, Study of Epoxy Resin Composites Doped with Nonlinear Fillers and Its Electrical Properties, 2017 IEEE Conference on Electrical Insulation and Dielectric Phenomenon (Ceidp), 2017, pp. 54–57 Search PubMed.
- S. Patil, S. Datar, N. Rekha, S. K. Asha and C. V. Dharmadhikari, Charge storage and electron transport properties of gold nanoparticles decorating a urethane-methacrylate comb polymer network, Nanoscale, 2013, 5(10), 4404–4411 RSC.
- C. A. Mills, F. L. M. Sam, A. S. Alshammari, L. J. Rozanski, N. G. Emerson and S. R. P. Silva, Storage Lifetime of Polymer-Carbon Nanotube Inks for Use as Charge Transport Layers in Organic Light Emitting Diodes, J. Disp. Technol., 2014, 10(2), 125–131 CAS.
- T. J. Lewis, Charge Transport in Polyethylene Nano Dielectrics, IEEE Trans. Dielectr. Electr. Insul., 2014, 21(2), 497–502 CAS.
- T. J. Lewis, Interfaces are the dominant feature of dielectrics at the nanometric level, IEEE Trans. Dielectr. Electr. Insul., 2004, 11(5), 739–753 CrossRef CAS.
- T. Tanaka, M. Kozako, N. Fuse and Y. Ohki, Proposal of a multi-core model for polymer nanocomposite dielectrics, IEEE Trans. Dielectr. Electr. Insul., 2005, 12(4), 669–681 CrossRef CAS.
- L. Schadler, Nanocomposites - Model Interfaces, Nat. Mater., 2007, 6(4), 257–258 CrossRef CAS PubMed.
- S. T. Tan, A. A. Umar, M. Yahaya, M. M. Salleh, C. C. Yap, H. Q. Nguyen, C. F. Dee, E. Y. Chang and M. Oyama, Formation of a Multi-Arm Branched Nanorod of ZnO on the Si Surface via a Nanoseed-Induced Polytypic Crystal Growth Using the Hydrothermal Method, Sci. Adv. Mater., 2013, 5(7), 803–809 CrossRef CAS.
- L. R. Zheng, Y. H. Zheng, C. Q. Chen, Y. Y. Zhan, X. Y. Lin, Q. Zheng, K. M. Wei and J. F. Zhu, Network Structured SnO2/ZnO Heterojunction Nanocatalyst with High Photocatalytic Activity, Inorg. Chem., 2009, 48(5), 1819–1825 CrossRef CAS PubMed.
- B. Wang, Z. Q. Zheng, L. F. Zhu, Y. H. Yang and H. Y. Wu, Self-assembled and Pd decorated Zn2SnO4/ZnO wire-sheet shape nano-heterostructures networks hydrogen gas sensors, Sens. Actuators, B, 2014, 195, 549–561 CrossRef CAS.
- N. S. Ramgir, D. J. Late, A. B. Bhise, M. A. More, I. S. Mulla, D. S. Joag and K. Vijayamohanan, ZnO multipods, submicron wires, and spherical structures and their unique field emission behavior, J. Phys. Chem. B, 2006, 110(37), 18236–18242 CrossRef CAS PubMed.
- N. S. Ramgir, I. S. Mulla, K. Vijayamohanan, D. J. Late, A. B. Bhise, M. A. More and D. S. Joag, Ultralow threshold field emission from a single multipod structure of ZnO, Appl. Phys. Lett., 2006, 88(4) CrossRef CAS.
- M. N. Xiong, G. X. Gu, B. You and L. M. Wu, Preparation and characterization of poly(styrene butylacrylate) latex/nano-ZnO nanocomposites, J. Appl. Polym. Sci., 2003, 90(7), 1923–1931 CrossRef CAS.
- M. Y. Choi, D. Choi, M. J. Jin, I. Kim, S. H. Kim, J. Y. Choi, S. Y. Lee, J. M. Kim and S. W. Kim, Mechanically Powered Transparent Flexible Charge-Generating Nanodevices with Piezoelectric ZnO Nanorods, Adv. Mater., 2009, 21(21), 2185-+ CrossRef CAS.
- S. Pelissou, P. Benca, and L. H. Gross, Electrical properties of metallocene polyethylene, Proceedings of the 2004 IEEE International Conference on Solid Dielectrics, 2004, vol. 1 and 2, pp. 466–469 Search PubMed.
- T. Kauerauf, R. Degraeve, E. Cartier, C. Soens and G. Groeseneken, Low Weibull slope of breakdown distributions in high-k layers, IEEE Electron Device Lett., 2002, 23(4), 215–217 CAS.
- G. C. Montanari, G. Mazzanti, M. Cacciari and J. C. Fothergill, In search of convenient techniques for reducing bias in the estimation of Weibull parameters for uncensored tests, IEEE Trans. Dielectr. Electr. Insul., 1997, 4(3), 306–313 CrossRef.
- R. W. Coppard, J. Bowman and L. A. Dissado, et al., The effect of aluminium inclusions on the dielectric breakdown of polyethylene, J. Phys. D: Appl. Phys., 1990, 23(12), 1554–1561 CrossRef CAS.
- Y. C. Jean, Positron annihilation spectroscopy for chemical analysis: a novel probe for microstructural analysis of polymers, Microchem. J., 1990, 42(1), 72–102 CrossRef CAS.
- S. J. Wang, C. L. Wang, X. G. Zhu and Z. N. Qi, Structural characteristics of HDPE/CaCO3 polymer composites probed by positron annihilation, Phys. Status Solidi A, 1994, 142(1), 6 CrossRef.
- F. Q. Tian, W. B. Bu, L. S. Shi, C. Yang, Y. Wang and Q. Q. Lei, Theory of modified thermally stimulated current and direct determination of trap level distribution, J. Electrost., 2011, 69(1), 7–10 CrossRef.
- G. Yin, Breakdown characteristics of polymeric nanodielectrics under power frequency and direct current voltage[D], Xi'an Jiaotong University, Xi'an, China, 2012 Search PubMed.
- S. T. Li, D. M. Min, W. W. Wang and G. Chen, Modelling of Dielectric Breakdown through Charge Dynamics for Polymer Nanocomposites, IEEE Trans. Dielectr. Electr. Insul., 2016, 23(6), 3476–3485 CAS.
- G. Chen, J. W. Zhao, S. T. Li and L. S. Zhong, Origin of thickness dependent dc electrical breakdown in dielectrics, Appl. Phys. Lett., 2012, 100(22), 222904 CrossRef.
| This journal is © The Royal Society of Chemistry 2019 |

