 Open Access Article
Electro-dewatering pretreatment of sludge to improve the bio-drying process
Li Sha a,
Xiaoyan Yub,
Xingxin Liua,
Xiaotong Yana,
Jingxiao Duana,
Yingte Lia and
Shuting Zhang
 *a
*a
aSchool of Environment Science and Engineering, Tianjin University, Tianjin 300354, China. E-mail: zhangst@tju.edu.cn; Fax: +86 15802211798; Tel: +86 15802211798
bSchool of Energy and Chemical Engineering, Liaoning Technical University, Huludao 125105, China
First published on 29th August 2019
Abstract
In this study, the feasibility of electro-dewatering (EDW) as a pretreatment of the subsequent bio-drying process (EB process) was investigated from the point of view of the influence of EDW on the microbial biodegradability of sludge. The results showed that suitable EDW pretreatment was beneficial for microbial growth in the sludge cake, and in the subsequent bio-drying process it increased the metabolic activity of microorganisms. However, electric field strength impacted microbial activity and soluble chemical oxygen demand (SCOD) of the sludge. As the applied electric field strength increased from 20 to 60 V cm−1, the microbial activity of sludge decreased gradually but SCOD of sludge increased. The specific oxygen uptake rate (SOUR) at electric field strength of 20 V cm−1 was 8.7% higher than that of raw sludge. EDW pretreatment accelerated the drying rate of bio-drying process, and the final water content of sludge (44%) was 6.3% lower than that of non-pretreated sludge. It was observed that in the bio-drying process with an EDW pretreatment, the first peak temperature of the sludge pile was 58.7 °C at 36 h and the second peak temperature was 48.7 °C at 56 h, whereas that of the non-pretreated sludge was only 46.5 °C at 42 h and 40.3 °C at 62 h, respectively. The EDW sludge incorporating straw as a bulking agent showed promising results during bio-drying. In addition, EDW pretreatment of sludge to improve the bio-drying process showed lower energy consumption and cost.
1. Introduction
In China, with rapidly accelerated urbanization in the recent decades, an increasing number of wastewater treatment plants (WWTPs) have been built to cope with the increasing sewage production of growing urban populations, and a large quantity of sewage sludge is produced.1 Sludge treatment and disposal accounts for approximately half of the operating costs of WWTPs.2 With more stringent legislation for the protection of the environment, the cost of sludge disposal has increased, and it depends directly on the volume of sludge to be treated and its water content.3 Currently mechanical pressure or centrifugation is widely used. However, it is not easy to attain high dehydration and sometimes the moisture content (MC) of sludge cakes reaches as high as 80%.4,5 Therefore, for mechanically dewatered sludge, a deeper dewatering is necessary for the significant savings for both operation costs and land applications.6Deep dewatering of sludge dewatered mechanically includes various methods such as thermal drying, lime conditioning, composting, bio-drying, and electro-dewatering (EDW). Thermal drying is a traditional but efficient method that can provide good control and achieve high dryness. However, high consumption of a nonrenewable energy resources and complicated apparatus lead to high operating and investment costs.7–9 Adding lime can speed up the sludge dewatering process, but the uses of inorganic and chemical conditioners not only result in incomplete combustion, equipment corrosion, and secondary pollution, but also greatly reduce the heat value of sludge cakes.10 Composting is an economical and effective biotechnology for sludge stabilization that can inactivate pathogens and convert organic pollutants into a humidified product. However, nitrous oxide (N2O), which has a global warming potential that is 298 times greater than an equivalent mass of CO2, is produced during the composting process.11 Lastly, the bio-drying method, which is similar to composting, is a solid-state aerobic process that degrades the easily biodegradable organic fraction in the waste. During this process, heat produced by microbial activities, with an adequate airflow-rate, enables fast evaporation of moisture.12 Bio-drying does not require an additional heat source and is an economical and energy-saving technology for deep dewatering of sludge.13 However, sludge dewatered mechanically cannot be treated by bio-drying alone, because its high MC and small particle size can lead to reduced gas permeability.14 Another deep dewatering method is EDW; by delaying the application of the electric field to the filter cake compression stage, potential savings in power consumption, of approximately 10–12% in the case of constant voltage and approximately 30–46% under constant current, were attained.3 When sludge cakes are compressed between an anode plate and a cathode net filled with an electric field of dozens of volts per centimeter, water in the sludge falls through the cathode net as filter liquor. After only minutes of the EDW treatment, the MC of sludge can decrease from 80% to 60% with a lower energy consumption.15,16 The EDW process has gained increasing attention and has been widely studied in recent years owing to its high efficiency and low energy consumption.17–20 However, at the terminal stages of EDW when the water content is less than 55–60%, the electric energy consumption increases sharply.21,22
Hence to resolve the low dewatering efficiency at the terminal stages of EDW and higher MC and small particle size at the start of bio-drying process, a deeper dewatering method of EDW pretreatment improving bio-drying has been proposed. In our previous study, Li et al.13 investigated the effects of the deep dewatering process combining EDW instead of bulking agent with bio-drying by the optimization of various parameters of EDW process. They showed that the MC decreased to 41.92% in the dewatered sewage sludge bio-dried after EDW. However, addition of inoculation and bulking agents is required to increase the stability of bio-drying process for industrial applications. Moreover, EDW could reduce the bacterial pathogens in wastewater sludge.23 At present, both systematic research and basic evaluations of EDW pretreatment to improve the bio-drying process are very scarce. Thus, the objective of this research was to investigate the performance of bio-drying for sludge pretreated by EDW, from the perspective of the influence of EDW on sludge biodegradability. Firstly, the biodegradability and microbial activity of sludge were evaluated after EDW by investigating the soluble chemical oxygen demand (SCOD), volatile fatty acids (VFAs), microbial culture, and specific oxygen uptake rate (SOUR). Then, the performance of EDW pretreatment of sludge to improve the bio-drying process was investigated, and the bulking agents were optimized. Finally, the energy consumption and costs of the entire process were analyzed.
2. Materials and methods
2.1 Experimental set-up
The experimental set-up for EDW is shown in Fig. 1a, which has previously been described by Zhang et al.24 A pressure of 2 bar was applied to ensure the close electrical contact between anode and sludge. The experimental set-up for bio-drying is shown in Fig. 1b. The column reactor (400 mm in height, 300 mm in internal diameter) was made of polymethyl methacrylate. The double-layer thermal insulation (40 mm in thickness), made of nitrile butadiene rubber and polyvinyl chloride, was wrapped around the outer wall of column. The three thermocouples were inserted at the top, the middle, and the bottom of sludge bed to monitor the corresponding temperature, and the transient temperature was recorded every 2 h using a computer. A perforated baffle, with 3 mm inner diameter of aeration pores, was fixed at 40 mm distance from the bottom of column to support the materials and facilitate aeration. A metal mesh (10 mesh) was placed on the perforated plate to prevent the sludge particles leaking down the bottom of the column. The air was pumped into the bottom of the column by a gas-flow meter. The sludge in the column was mixed every day before sampling.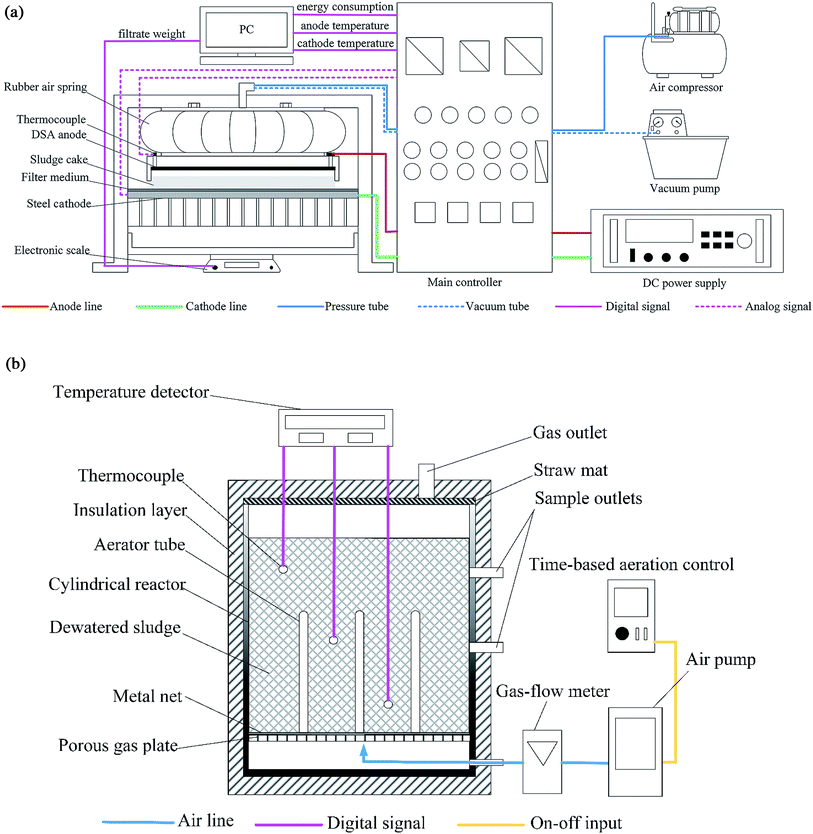 | ||
| Fig. 1 Schematic of (a) the EDW experimental equipment and (b) the bio-drying experimental equipment. | ||
2.2 Sludge samples and bulking agents
The sludge for deeper dewatering in this study was obtained from Tianjin Jingu Wastewater Treatment Plant (China). The MC and volatile solids (VS) of the sludge were approximately 79.8% and 54%, respectively. Sludge samples were kept in plastic bags and stored at 4 °C, and used within one week. For VFAs analysis, the feeding sludge used in anaerobic digestion (ADIS), was obtained from the anoxic pond in the anaerobic–anoxic–oxic (AAO) process of the Tianjin Jizhuangzi Wastewater Treatment Plant (China). Composting products (CP), which were used as inoculums for bio-drying, were obtained from Tangshan Fengrun Wastewater Treatment Plant (China).Bulking agents such as straw, sawdust, and plastic foam (Qikang Water Treatment Materials Limited) were used for bio-drying. The MC, VS, and particle size of the straw were 13%, 89%, and 5–15 mm, respectively. The MC, VS, and particle size of the sawdust were 6%, 82%, and less than 2 mm, respectively. The particle size of the plastic foam was 2–4 mm.
2.3 Experimental methods
1200 g sludge cake dewatered by filtration and compression was used for each electro-dewatering test. The electric field strength was used in a series of 20, 40 and 60 V cm−1. EDW was stopped when the MC of the sludge cakes decreased to approximately 65%. As a control, a sludge with no electro-dewatering pretreatment was air-dried in a fume hood to the same MC with the sludge by EDW to eliminate the differences caused by the initial water content in the subsequent bio-drying tests.The sludge prepared for bio-drying amounted to 16 kg. During the six-day bio-drying period, the sludge was turned every two days to ensure homogenization. A time-based aeration control system was adopted for intermittent air supply with a frequency of 3 min run/7 min stop. The air flow rate was 0.08 m3 (h−1 kg−1), that is, the ventilation volume was 0.08 m3 per hour per kilogram of sludge.
2.4 Analysis methods
The MC and VS contents were measured by drying at 105 °C for 24 h and 550 °C for 4 h, respectively. For SCOD analysis, 5 g sludge samples were placed in a conical flask containing 50 mL ultra-pure water and oscillated for 4 h. Then the sludge suspension was centrifuged at 8000 rpm for 5 min, and the supernatant filtered through the 0.45 μm membrane was used for analyzing the chemical oxygen demand (COD) according to the standard method described by Hua et al.25 During VFAs analysis, the samples were centrifuged at 10![[thin space (1/6-em)]](https://www.rsc.org/images/entities/char_2009.gif) 000 rpm for 8 min. The supernatant was filtered through 0.45 μm membrane, and the VFA content was determined by a liquid chromatography system equipped with a Refractive Index Detector and a BioRad Aminex HPX-87H chromatographic column (300 × 7.8 mm). The column temperature was 65 °C. The mobile phase was 5 mmol L−1 H2SO4 solution as a flow rate of 0.6 mL min−1. SOUR was measured by the method described by Hua et al.25 and dissolved oxygen (DO) was monitored by a HQ40d portable meter (HACH, USA).
000 rpm for 8 min. The supernatant was filtered through 0.45 μm membrane, and the VFA content was determined by a liquid chromatography system equipped with a Refractive Index Detector and a BioRad Aminex HPX-87H chromatographic column (300 × 7.8 mm). The column temperature was 65 °C. The mobile phase was 5 mmol L−1 H2SO4 solution as a flow rate of 0.6 mL min−1. SOUR was measured by the method described by Hua et al.25 and dissolved oxygen (DO) was monitored by a HQ40d portable meter (HACH, USA).
3. Results and discussion
3.1 Effect of EDW on sludge biodegradability
At the cathode:
 | (1) |
 | (2) |
At the anode:
| M(s) → M(aq)n+ + ne− | (3) |
 | (4) |
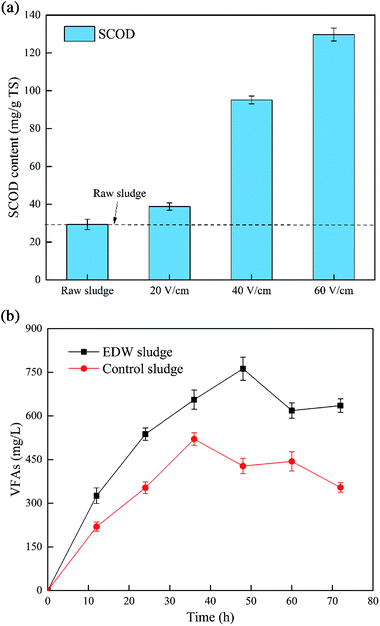
Reaction (1) produces hydroxide ions and reaction (4) produces protons, this may result in a pH gradient across the sludge bed. Acidic or alkaline environment could promote the solubilization or degradation of extracellular polymeric substances (EPS) in sludge, and the organic matters such as polysaccharides and proteins resulting from broken sludge wall are released into the sludge suspension,30 causing a rapid increase of sludge SCOD. The pH gradient in the sludge cake was intensified concomitantly with the electric field strength, and the organic substance of EDW sludge were released in increased amounts (seen in Fig. 2a). It indicates that EDW sludge could provide a substantial amount of substrate consumed directly by microbes.
![[thin space (1/6-em)]](https://www.rsc.org/images/entities/char_2009.gif) :
:![[thin space (1/6-em)]](https://www.rsc.org/images/entities/char_2009.gif) 1 between EDW sludge and the ADIS; control sludge was also treated simultaneously. After a start-up period of 72 h (Fig. 2b), VFAs accumulation in both the EDW sludge fermentation liquid (VFAs-EDW) and control sludge fermentation liquid (VFAs-control) first increased, and then decreased with time. VFAs-EDW reached a maximum of 762 mg L−1 after 48 h, while VFAs-control reached 520.2 mg L−1 after 36 h. VFAs-EDW was 241.8 mg L−1 higher than that of VFAs-control. The electroosmosis was able to rupture the cell wall and release intracellular substances, such as carbohydrates and proteins into the liquid phase,31 which increased the substrates in sludge available to microorganisms. This finding agrees with previous reports that solubilization of sludge contributes to increased VFAs in hydrolysate.32 VFAs-EDW reached a maximum 12 h later than VFAs-control; it may be due to the organic matter released from the microbiological cells ruptured by EDW, which has a high molecular weight and is difficult to decompose. In the later stage, VFAs-EDW and VFAs-control both exhibited a downward trend, possibly owing to the conversion of some VFAs into methane by microbes. At 72 h, VFAs-EDW and VFAs-control decreased by 16.6% and 31.9%, respectively.
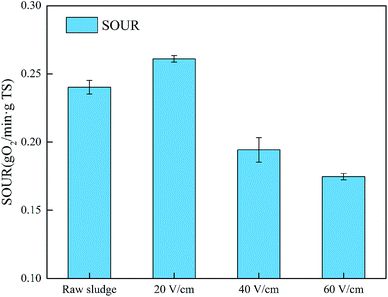
1 between EDW sludge and the ADIS; control sludge was also treated simultaneously. After a start-up period of 72 h (Fig. 2b), VFAs accumulation in both the EDW sludge fermentation liquid (VFAs-EDW) and control sludge fermentation liquid (VFAs-control) first increased, and then decreased with time. VFAs-EDW reached a maximum of 762 mg L−1 after 48 h, while VFAs-control reached 520.2 mg L−1 after 36 h. VFAs-EDW was 241.8 mg L−1 higher than that of VFAs-control. The electroosmosis was able to rupture the cell wall and release intracellular substances, such as carbohydrates and proteins into the liquid phase,31 which increased the substrates in sludge available to microorganisms. This finding agrees with previous reports that solubilization of sludge contributes to increased VFAs in hydrolysate.32 VFAs-EDW reached a maximum 12 h later than VFAs-control; it may be due to the organic matter released from the microbiological cells ruptured by EDW, which has a high molecular weight and is difficult to decompose. In the later stage, VFAs-EDW and VFAs-control both exhibited a downward trend, possibly owing to the conversion of some VFAs into methane by microbes. At 72 h, VFAs-EDW and VFAs-control decreased by 16.6% and 31.9%, respectively.As observed in Fig. 4, when the applied electric field strength increased from 20 V cm−1 to 60 V cm−1, SOUR of sludge after EDW decreased from 0.26 g O2 per min per g TS to 0.17 g O2 per min per g TS, and at the electric field strength of 20 V cm−1 it was 8.7% higher than that of raw sludge. This confirmed the findings of Nakanishi et al.35 who claimed that the electrostimulation of cells induced changes in DNA and protein synthesis, membrane permeability, and cell growth, that, at low-level current, can enhance bacterial activity and metabolism. Ibeid et al.36 also reported that a low-level current would maintain microbial activity. However, at the electric field strength of 40 V cm−1 and 60 V cm−1, SOUR of sludge after EDW decreased by 19.1% and 27.3% compared to that of control sludge, respectively, which is the opposite trend to that of the SCOD variation of sludge. This verified that higher electric field intensity would generate more serious cracking effects in the microorganisms, releasing more organics from the sludge cells. As a result, in EDW pretreatment, the electric field strength of 20 V cm−1 was suitable for the subsequent bio-drying.
3.2 Effect of EDW on the bio-drying process
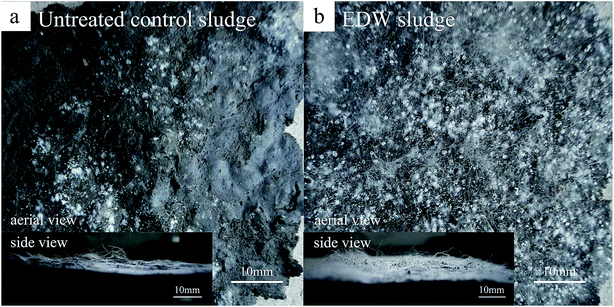
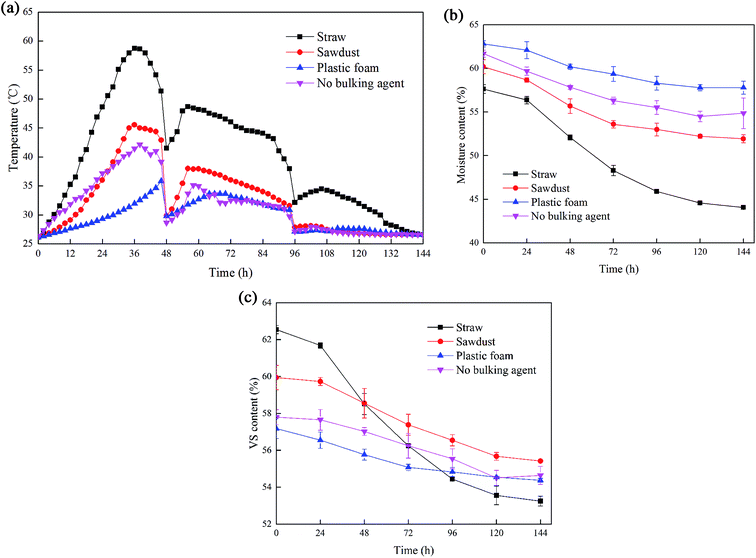
As observed in Fig. 5a, the first peak temperature of sludge pile after EDW was 58.7 °C after 36 h of bio-drying, whereas that of the control sludge pile was only 46.5 °C after 42 h. After the first homogenization of sludge, the second peak temperature of sludge pile after EDW remained high at 48.7 °C after 56 h, whereas that of the control sludge pile was 40.3 °C after 62 h. Clearly, the sludge pile after EDW had a faster drying rate and higher peak temperature than the control sludge pile, probably because the EDW pretreatment improved sludge disintegration and provided more soluble substances for the microorganisms. This was more conducive for the metabolic activity of the microorganisms, and thus more heat was produced. Furthermore, it was observed that the sludge after EDW due to the gas produced by electrochemical reactions formed particles more easily, resulting in a higher porosity and more uniform ventilation. This would create a favorable aerobic condition for the microbial activity in the bio-drying process.
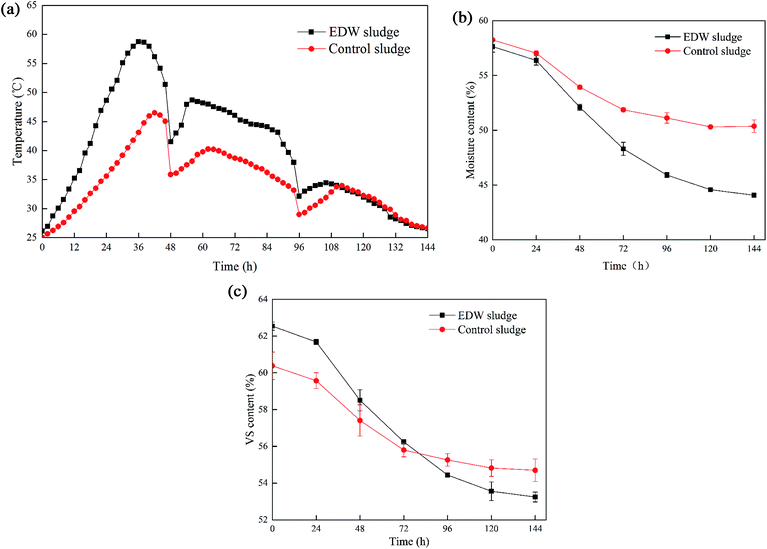 | ||
| Fig. 5 Variation of (a) temperature, (b) MC, and (c) VS content in EDW sludge and control sludge during bio-drying. | ||
Moreover, the MC of sludge after EDW decreased faster than the MC of the control sludge (Fig. 5b). After 144 h, the MC of sludge after EDW was 44%, which was 6.3% lower than the control sludge. According to Ma et al. and Velis et al.,40,41 these results may be attributed to the fact that higher microbial activity of sludge pile after EDW produces more heat, which increases the matrix temperature; the resulting higher temperature (T > 50 °C) effectively promotes water evaporation. Additionally, owing to the lysis of sludge after EDW, intracellular water can be easily removed. The results also clearly show that during the 144 h, the VS content of sludge pile after EDW decreased by 9.3%, whereas the VS content of the control sludge pile decreased by 5.7% (Fig. 5c). This is because in EDW sludge, an increased number of active microorganisms consumed more organic matter, along with a large amount of bio-heat, and it resulted in higher temperature and lower water content in the bio-drying process (seen in Fig. 5a and b). Villegas et al.42 also confirmed that the generation of bio-heat was dependent on the degradation of organic matter. As mentioned above, an EDW pretreatment of sludge improved the bio-drying process.
3.3 Effect of bulking agents during bio-drying
During the bio-drying process, adding bulking agents is widely implemented to improve the size and number of inter-particle voids in the pile, leading to its increased permeability to air, and decrease of the amount of (or completely avoid) leachate production.43,44 In the tests, EDW sludge, bulking agents, and CP were mixed in a mass ratio of 15![[thin space (1/6-em)]](https://www.rsc.org/images/entities/char_2009.gif) :
:![[thin space (1/6-em)]](https://www.rsc.org/images/entities/char_2009.gif) 3
3![[thin space (1/6-em)]](https://www.rsc.org/images/entities/char_2009.gif) :
:![[thin space (1/6-em)]](https://www.rsc.org/images/entities/char_2009.gif) 5, and the EDW sludge was pretreated at the electric field strength of 20 V cm−1. Simultaneously, sludge after EDW with no bulking agent was prepared as the control. As shown in Fig. 6a, adding the bulking agent potentially improved the bio-drying process. A higher drying rate was obtained when the bulking agent was straw, and the first peak temperature of the pile with straw was 13.2 °C and 22.9 °C higher than that of the piles with sawdust and plastic foam, respectively. After the first homogenization of sludge, the pile with straw still exhibited a good drying trend, with second peak temperatures being 10.7 °C and 15.0 °C higher than the piles with sawdust and plastic foam, respectively. After the second homogenization of sludge, the temperature of the pile with straw increased slightly to a third peak temperature of 34.5 °C, while the temperatures of piles with sawdust and plastic foam did not change significantly. During the bio-drying process, the water from sludge caused by microbial metabolism was absorbed by straw at most, followed by sawdust, and the plastic foam was the weakest. A low metabolic water accumulation would lead to an increase the porosity of the pile and the mass transfer rate between microorganisms and oxygen, enhancing microbial activity and increasing the temperature of the pile. Furthermore, according to the previous reports, straw has a substantial biodegradation potential during the aerobic process, and more biodegradable organic matter generates more heat, resulting in a higher temperature, which in turn, enhances organic matter degradation.45
5, and the EDW sludge was pretreated at the electric field strength of 20 V cm−1. Simultaneously, sludge after EDW with no bulking agent was prepared as the control. As shown in Fig. 6a, adding the bulking agent potentially improved the bio-drying process. A higher drying rate was obtained when the bulking agent was straw, and the first peak temperature of the pile with straw was 13.2 °C and 22.9 °C higher than that of the piles with sawdust and plastic foam, respectively. After the first homogenization of sludge, the pile with straw still exhibited a good drying trend, with second peak temperatures being 10.7 °C and 15.0 °C higher than the piles with sawdust and plastic foam, respectively. After the second homogenization of sludge, the temperature of the pile with straw increased slightly to a third peak temperature of 34.5 °C, while the temperatures of piles with sawdust and plastic foam did not change significantly. During the bio-drying process, the water from sludge caused by microbial metabolism was absorbed by straw at most, followed by sawdust, and the plastic foam was the weakest. A low metabolic water accumulation would lead to an increase the porosity of the pile and the mass transfer rate between microorganisms and oxygen, enhancing microbial activity and increasing the temperature of the pile. Furthermore, according to the previous reports, straw has a substantial biodegradation potential during the aerobic process, and more biodegradable organic matter generates more heat, resulting in a higher temperature, which in turn, enhances organic matter degradation.45
Both the MC and VS contents decreased with time (Fig. 6b and c). After 144 h, the MC of the pile with straw, sawdust, and plastic foam decreased by 13.6%, 8.3%, and 5.0%, respectively, while the VS content decreased by 9.3%, 4.5%, and 2.8%, respectively. The MC and VS content of the pile with straw arrived at 44.1% and 53.2%, respectively. According to the temperature curve, the high temperature of the pile with straw could promote water evaporation. Moreover, only the pile with straw reached the temperature values of the thermophilic phase (T > 50 °C). Thermophilic phase with the highest microbial activities displayed maximum organic matter decomposition.14 Furthermore, at the end of the experiment, a large amount of free water was found in the pores of the pile with plastic foam. This accumulation of water affected heat transfer and mass transfer; thus, temperature, MC and VS of the pile with plastic foam exhibited no significant changes.
3.4 Energy and cost analysis
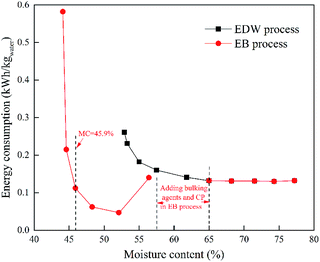
 | (a) |
 | (b) |
When the MC of sludge was lower than 65%, energy consumption of EDW process began to increase significantly. EDW process reached the dewatering limit when the MC of sludge was 52.9%, and the energy consumption was as high as 0.261 kW h kgwater−1. In bio-drying stage of EB process, energy consumption was maintained at a relatively low level when the MC was 56.4–45.9%. However, energy consumption increased sharply when the MC reached 44.1–45.9%. It was due to the reduction in heat production with the decrease of the MC, but input of power consumption because of aeration still continued. In the last 48 h of bio-drying, the MC of sludge decreased by only 1.5% but the energy consumption increased by 0.47 kW h kgwater−1. Therefore, 96 h of the optimal bio-drying time was chosen in EB process.
![[thin space (1/6-em)]](https://www.rsc.org/images/entities/char_2009.gif) 508.8, respectively. Thermal drying is very effective for deeper dewatering of sludge, wherein the MC decreased from 79.8% to 30% for 30 min. However, it had the highest energy consumption, operation costs, and equipment costs, which were approximately 2.0 (only electricity consumption), 3.8 and 1.2–2.5 times than those of the EB process, respectively. The energy consumption of lime drying was only 42 kW h traw sludge−1, which was 22.2% less than that of the EB process. However, the operation costs and equipment costs were approximately 1.2–1.7 and 1.2–2 times than those of the EB process, respectively. Dried sludge can not only be used as a renewable fuel replacing fossil fuels, but also it can be made into building materials such as bricks. Different dewatering processes affect the downstream resource utilization of sludge. In the last column of Table 1, ‘positive’ indicates that the dewatering process was beneficial for subsequent incineration and combustion treatment and ‘negative’ indicates the opposite. During the EB process, thermal drying, and composting, no chemical additives produced toxic substances in subsequent combustion or incineration processes. The three dewatering processes mentioned above can turn the sludge into solid recovered fuel, which can be combusted for energy production or replace other fuels in industrial processes.46 In addition, quality of cement and brick with lime-added sludge is poor, and lime explodes during the process.47 Thus, adding lime to sludge is disadvantageous for subsequent combustion or incineration treatment. The present analysis showed that the EB process is an environmentally friendly, energy-saving, and low-cost sludge dehydration process.
508.8, respectively. Thermal drying is very effective for deeper dewatering of sludge, wherein the MC decreased from 79.8% to 30% for 30 min. However, it had the highest energy consumption, operation costs, and equipment costs, which were approximately 2.0 (only electricity consumption), 3.8 and 1.2–2.5 times than those of the EB process, respectively. The energy consumption of lime drying was only 42 kW h traw sludge−1, which was 22.2% less than that of the EB process. However, the operation costs and equipment costs were approximately 1.2–1.7 and 1.2–2 times than those of the EB process, respectively. Dried sludge can not only be used as a renewable fuel replacing fossil fuels, but also it can be made into building materials such as bricks. Different dewatering processes affect the downstream resource utilization of sludge. In the last column of Table 1, ‘positive’ indicates that the dewatering process was beneficial for subsequent incineration and combustion treatment and ‘negative’ indicates the opposite. During the EB process, thermal drying, and composting, no chemical additives produced toxic substances in subsequent combustion or incineration processes. The three dewatering processes mentioned above can turn the sludge into solid recovered fuel, which can be combusted for energy production or replace other fuels in industrial processes.46 In addition, quality of cement and brick with lime-added sludge is poor, and lime explodes during the process.47 Thus, adding lime to sludge is disadvantageous for subsequent combustion or incineration treatment. The present analysis showed that the EB process is an environmentally friendly, energy-saving, and low-cost sludge dehydration process.
| Dewatering process | Moisture content (%) | Treatment time (min) | Energy consumptiona | Cost ($ traw sludge−1) | Subsequent combustion or incineration treatment | |
|---|---|---|---|---|---|---|
| Operating cost | Equipment cost | |||||
| a Energy consumption includes heat energy consumption (kJ kg−1) and electricity consumption (kW h traw sludge−1). | ||||||
| EB process | 79.8–65% | 9 | 40 kW h traw sludge−1 | 12.5 | 8631.6–11![[thin space (1/6-em)]](https://www.rsc.org/images/entities/char_2009.gif) 508.8 508.8 |
Positive |
| 65–45.9% | 5760 | 14 kW h traw sludge−1 | ||||
| Thermal drying | 79.8–30% | 30 | 3100–3500 kJ kg−1, 107.5 kW h traw sludge−1 | 47.6 | 14![[thin space (1/6-em)]](https://www.rsc.org/images/entities/char_2009.gif) 386–21 386–21![[thin space (1/6-em)]](https://www.rsc.org/images/entities/char_2009.gif) 579 579 |
Positive |
| Composting | 65–40% | 23![[thin space (1/6-em)]](https://www.rsc.org/images/entities/char_2009.gif) 040–28 040–28![[thin space (1/6-em)]](https://www.rsc.org/images/entities/char_2009.gif) 800 800 |
72–90 kW h traw sludge−1 | 17.3–21.6 | 17![[thin space (1/6-em)]](https://www.rsc.org/images/entities/char_2009.gif) 263.2 263.2 |
Positive |
| Lime drying | 79.8–60% | 7200–11![[thin space (1/6-em)]](https://www.rsc.org/images/entities/char_2009.gif) 520 520 |
42 kW h traw sludge−1 | 14.4–21.6 | 14![[thin space (1/6-em)]](https://www.rsc.org/images/entities/char_2009.gif) 386–17 386–17![[thin space (1/6-em)]](https://www.rsc.org/images/entities/char_2009.gif) 263 263 |
Negative |
4. Conclusions
Bio-drying is an energy-saving technology for deep dewatering of sludge. However, sludge dewatered mechanically cannot be treated by bio-drying alone because of the low gas permeability resulting from its high MC and small particle size. In this study, EDW, as an electrokinetic pretreatment to improve the bio-drying process, was investigated. It was found that EDW could improve the bio-drying process. EDW was able to increase the drying rate and decrease the final water content of sludge, resulting from increased microbial activity that caused the consumption of more degradable organics and produced more bio-heat. Lowering the applied electric field strength is proposed to increase microbial activity and to reduce the damage to microbial cells and EPS of sludge. The results also reveal that EDW sludge incorporating straw as a bulking agent is a good approach for bio-drying process with lower energy consumption and cost.Conflicts of interest
There are no conflicts to declare.Acknowledgements
This research is supported by the National Natural Science Foundation of China (51608247).References
- J. Jiang, Q. Zhao, J. Zhang, G. Zhang and D. J. Lee, Bioresour. Technol., 2009, 100, 5808–5812 CrossRef CAS PubMed.
- X. Qian, Y. Wang and H. Zheng, Water Res., 2016, 88, 93–103 CrossRef CAS PubMed.
- A. Mahmoud, A. F. A. Hoadley, J. B. Conrardy, J. Olivier and J. Vaxelaire, Water Res., 2016, 103, 109–123 CrossRef CAS PubMed.
- L. Cai, T. B. Chen, D. Gao and J. Yu, Water Res., 2015, 90, 44–51 CrossRef PubMed.
- S. Visigalli, A. Turolla, H. Zhang, P. Gronchi and R. Canziani, J. Environ. Chem. Eng., 2017, 5, 6122–6131 CrossRef CAS.
- S. Heimersson, M. Svanström, C. Cederberg and G. Peters, Resour., Conserv. Recycl., 2017, 122, 126–134 CrossRef.
- A. Mahmoud, A. Hoadley, M. Citeau, J. M. Sorbet, G. Olivier, J. Vaxelaire and J. Olivier, Water Res., 2018, 129, 66–82 CrossRef CAS PubMed.
- J. Vaxelaire, J. M. Bongiovanni, P. Mousques and J. R. Puiggali, Water Res., 2000, 34, 4318–4323 CrossRef CAS.
- L. Zhao, W. M. Gu, P. J. He and L. M. Shao, Water Res., 2010, 44, 6144–6152 CrossRef CAS PubMed.
- H. Liu, H. Xiao, B. Fu and H. Liu, Chem. Eng. J., 2017, 313, 655–662 CrossRef CAS.
- W. Ke, Y. Wu, W. Zhe, W. Wei and N. Ren, Bioresour. Technol., 2018, 265, 25–32 CrossRef PubMed.
- F. Tambone, B. Scaglia, S. Scotti and F. Adani, Bioresour. Technol., 2011, 102, 7443–7450 CrossRef CAS PubMed.
- Q. Li, X. Lu, H. Guo, Z. Yang, Y. Li, S. Zhi and K. Zhang, Bioresour. Technol., 2018, 263, 94–102 CrossRef CAS PubMed.
- X. L. Zhao, L. I. Bi-Qiong, N. I. Jiu-Pai and D. T. Xie, J. Integr. Agric., 2016, 15, 232–240 CrossRef CAS.
- A. Mahmoud, J. Olivier, J. Vaxelaire and A. F. Hoadley, Water Res., 2010, 44, 2381–2407 CrossRef CAS PubMed.
- A. Mahmoud, J. Olivier, J. Vaxelaire and A. F. Hoadley, Water Res., 2011, 45, 2795–2810 CrossRef CAS PubMed.
- J. L. Feng, Z. H. Zhao, F. Chen and H. P. Hu, J. Volcanol. Geotherm. Res., 2014, 287, 1–11 CrossRef CAS.
- M. H. M. Raats, A. J. G. V. Diemen, J. Lavèn and H. N. Stein, Colloids Surf., A, 2002, 210, 231–241 CrossRef CAS.
- H. Xu, K. Shen, T. Ding, J. Cui, M. Ding and C. Lu, Chem. Eng. J., 2016, 293, 207–215 CrossRef CAS.
- J. Olivier, J. B. Conrardy, A. Mahmoud and J. Vaxelaire, Water Res., 2015, 82, 66–77 CrossRef CAS PubMed.
- X. Y. Yu, S. T. Zhang, L. Zheng, Y. Liu and H. Xu, Trans. Tianjin Univ., 2011, 17, 39–44 CrossRef CAS.
- J. B. Conrardy, J. Vaxelaire and J. Olivier, Water Res., 2016, 100, 194–200 CrossRef CAS PubMed.
- T. Navab-Daneshmand, R. Beton, R. J. Hill, R. Gehr and D. Frigon, Water Res., 2012, 46, 3999–4008 CrossRef CAS PubMed.
- S. Zhang, Z. Yang, X. Lv, S. Zhi, Y. Wang, Q. Li and K. Zhang, Chem. Eng. Res. Des., 2017, 121, 44–56 CrossRef CAS.
- L. C. Hua, C. Huang, Y. C. Su, T. N. P. Nguyen and P. C. Chen, J. Membr. Sci., 2015, 495, 29–36 CrossRef CAS.
- S. S. Yang, W. Q. Guo, G. L. Cao, H. S. Zheng and N. Q. Ren, Bioresour. Technol., 2012, 124, 347–354 CrossRef CAS PubMed.
- Z. G. Liu, Z. H. Ruan, Y. Xiao, Y. Yi, Y. J. J. Tang, W. Liao and Y. Liu, Bioresour. Technol., 2013, 132, 166–170 CrossRef CAS PubMed.
- H. P. Yuan, X. F. Yan, C. F. Yang and N. W. Zhu, J. Hazard. Mater., 2011, 187, 82–88 CrossRef CAS PubMed.
- Q. Yu, X. Jin and Y. Zhang, Water Res., 2018, 135, 44–56 CrossRef CAS PubMed.
- B. Cao, W. Zhang, Y. Du, R. Wang, S. P. Usher, P. J. Scales and D. Wang, Water Res., 2018, 130, 363–375 CrossRef CAS PubMed.
- B. Yu, J. Xu, H. Yuan, Z. Lou, J. Lin and N. Zhu, Fuel, 2014, 130, 279–285 CrossRef CAS.
- J. Zhang, J. Zhang, Y. Tian, N. Li, L. Kong, L. Sun, M. Yu and W. Zuo, Chem. Eng. J., 2016, 301, 238–248 CrossRef CAS.
- L. C. Hua, C. Huang, Y. C. Su, T. N. P. Nguyen and P. C. Chen, J. Membr. Sci., 2015, 495, 29–36 CrossRef CAS.
- D. Boruszko, Environ. Res., 2017, 155, 344–352 CrossRef CAS PubMed.
- K. Nakanishi, H. Tokuda, T. Soga, T. Yoshinaga and M. Takeda, J. Ferment. Bioeng., 1998, 85, 250–253 CrossRef CAS.
- S. Ibeid, M. Elektorowicz and J. A. Oleszkiewicz, Water Res., 2013, 47, 903–910 CrossRef CAS PubMed.
- X. Shi, X. Guo, J. Zuo, Y. Wang and M. Zhang, Waste Manag., 2018, 75, 261–269 CrossRef CAS PubMed.
- M. A. Rahman, H. B. Møller, C. K. Saha, M. M. Alam, R. Wahid and L. Feng, Renewable Energy, 2018, 128, 241–249 CrossRef CAS.
- R. Lin, J. Cheng, L. Ding and J. D. Murphy, Chem. Eng. J., 2018, 350, 681–691 CrossRef CAS.
- J. Ma, L. Zhang, L. Mu, K. Zhu and A. Li, Waste Manag., 2018, 80, 327–338 CrossRef PubMed.
- C. A. Velis, P. J. Longhurst, G. H. Drew, R. Smith and S. J. T. Pollard, Bioresour. Technol., 2009, 100, 2747–2761 CrossRef CAS PubMed.
- M. Villegas and C. Huiliãir, Bioresour. Technol., 2014, 174, 33–41 CrossRef CAS PubMed.
- F. Yang, G. X. Li, Q. Y. Yang and W. H. Luo, Chemosphere, 2013, 93, 1393–1399 CrossRef CAS PubMed.
- J. Yuan, Q. Yang, Z. Zhang, G. Li, W. Luo and D. Zhang, J. Environ. Sci., 2015, 37, 83–90 CrossRef CAS PubMed.
- L. Zhao, W. M. Gu, P. J. He and L. M. Shao, Water Res., 2011, 45, 2322–2330 CrossRef CAS.
- A. Papageorgiou, J. R. Barton and A. Karagiannidis, J. Environ. Manage., 2009, 90, 2999–3012 CrossRef CAS PubMed.
- B. Rao, Y. Zhu, M. Yu, X. Lu, Y. Wan, G. Huang, X. Su and X. Liu, Process Saf. Environ. Prot., 2019, 122, 288–297 CrossRef CAS.
| This journal is © The Royal Society of Chemistry 2019 |

