 Open Access Article
The relationship between crystalline disorder and electronic structure of Pd nanoparticles and their hydrogen storage properties†
Okkyun Seo‡
ab,
Jaemyung Kim‡ab,
Akhil Tayal a,
Chulho Song§
a,
L. S. R. Kumara¶
a,
Chulho Song§
a,
L. S. R. Kumara¶
 a,
Shun Dekura||
c,
Hirokazu Kobayashic,
Hiroshi Kitagawa
 c and
Osami Sakata
 *abd
*abd
aSynchrotron X-ray Group, Research Center for Advanced Measurement and Characterization, National Institute for Materials Science, 1-1-1 Kouto, Sayo, Hyogo 679-5148, Japan. E-mail: SAKATA.Osami@nims.go.jp; Tel: +81 791 58 1970
bSynchrotron X-ray Station at SPring-8, Research Network and Facility Services Division, National Institute for Materials Science, 1-1-1 Kouto, Sayo, Hyogo 679-5148, Japan
cDivision of Chemistry, Graduate School of Science, Kyoto University, Kitashirakawa Oiwake-cho, Sakyo-ku, Kyoto 606-8502, Japan
dDepartment of Innovative and Engineered Materials, Tokyo Institute of Technology, 4259-J3-16, Nagatsuta, Midori, Yokohama 226-8502, Japan
First published on 9th July 2019
Abstract
We investigated the relationship between crystalline disorder and electronic structure deviations of Pd nanoparticles (NPs) and their hydrogen storage properties as a function of their particle diameter (2.0, 4.6 and 7.6 nm) using various synchrotron techniques. The lattice constant of the 2.0 nm-diameter Pd NPs was observed to be larger than that of the 4.6 or 7.6 nm-diameter Pd NPs. With increasing particle diameter the structural ordering was improved, the lattice constant and atomic displacement were reduced and the coordination numbers increased, as determined using high-energy X-ray diffraction, reverse Monte Carlo modelling and X-ray absorption fine structure spectroscopy. The structural order of the core part of the larger NPs was also better than that of the smaller NPs. In addition, the bond strength of the Pd–H formation increased with increasing particle diameter. Finally, the surface order of the Pd NPs was related to enhancement of the hydrogen storage capacity and Pd–H bond strength.
1 Introduction
Various materials including metals, metal alloys, carbon composites and metal organic frameworks (MOFs) have been intensively investigated because of their hydrogen storage capabilities.1–10 Metals and metal alloys are some of the promising candidates for hydrogen storage materials because they can effectively and safely store hydrogen with stable hydride formation.2 Pd metal, in particular, is widely used for hydrogen storage because of its Pd–H bonding and ability to store large amounts of hydrogen.11–15 Pd–H formation has been actively pursued for various technological applications including hydrogen storage materials, purifying filters, isotope separation membranes and sensors.16–21 With the development of nanotechnology, metal nanoparticles (NPs) have emerged as a new type of hydrogen storage material.4 The high surface area to volume ratio of metal NPs results in an enhanced catalytic effect.22–24 With decreasing particle size, the amount of hydrogen storage and equilibrium pressure for the formation of Pd–H bonding both decrease.25,26 In addition, the hydrogen storage properties of metal NPs have been shown to be related to their electronic structure.27–29 It is expected that the electronic structure of metal NPs can be tuned by adjusting the particle size and local structure.24,30–32 Furthermore, in 2008, Yamauchi et al. reported that the strength of Pd–H bond formation of smaller Pd NPs is weaker than that of larger Pd NPs and that the unavailable surface part of smaller NPs should be accounted for in determining the hydrogen capacity.26 These authors assumed that the large surface atoms in Pd NPs affected the hydrogen storage properties.26 Therefore, evaluations of the whole structure of metal NPs, including the local structure, crystal structure and electronic structure, are important. In addition, three-dimensional (3D) reverse Monte Carlo (RMC) modelling has been used to depict the core and surface atoms in metal NPs.33–36 Various structural analysis methods have revealed the local and average structural information related to the hydrogen storage properties of Pd NPs as a function of their particle diameter.34 In this study, we demonstrate the correlation between the hydrogen storage properties and structure of Pd NPs with particle diameters of 2.0, 4.6 and 7.6 nm. We discuss the origin of the weak Pd–H chemical bond formation and lowering of the working temperature and pressure related to surface crystalline disordering and electronic structure. In addition we evaluate the crystal parameters using high-energy X-ray diffraction (HE-XRD) and Rietveld refinement. The local atomic configuration, coordination number, degree of disordering and nearest-neighbour distance between Pd atoms are determined using the X-ray pair distribution function (PDF), RMC modelling and X-ray absorption fine structure spectroscopy (XAFS). Finally, the electronic structure of the Pd NPs is investigated through analysis of the valence band spectra obtained using hard X-ray photoelectron spectroscopy (HAXPES).2 Experimental
2.1 Sample preparation
Pd NPs covered with poly(N-vinyl-2-pyrrolidone) (PVP) were synthesized using a chemical reduction method. For the synthesis of the 2.0 nm-diameter Pd NPs, 80 mL of 2 mM H2PdCl4 (0.16 mmol Pd) and 1.6 mmol (in monomer unit) PVP were dissolved in 720 mL of a 4![[thin space (1/6-em)]](https://www.rsc.org/images/entities/char_2009.gif) :
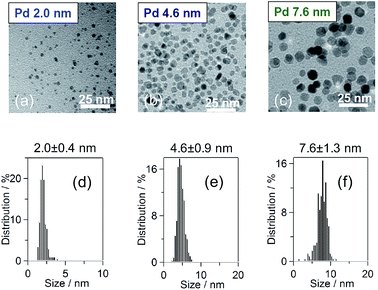
:![[thin space (1/6-em)]](https://www.rsc.org/images/entities/char_2009.gif) 1 H2O/ethanol mixture solvent and then refluxed for 3 h, following a method previous described in the literature.37 For the 4.6 nm-diameter Pd NPs, 10 mmol PVP was dissolved in 300 mL of ethylene glycol and heated to 170 °C. In addition, 1 mmol Na2PdCl4 was dissolved in 40 mL of H2O. The precursor solution was sprayed with an ethylene glycol solution while maintaining a temperature of 170 °C. For the 7.6 nm-diameter Pd NPs, 2 mmol Na2PdCl4 and PVP were dissolved in 1000 mL of ethanol and then refluxed for 3 h. After the reactions, all the samples were washed with a mixture of the solution/diethylether/acetone once, a H2O/diethylether/acetone mixture twice and an ethanol/diethylether mixture 5 times and were then collected by centrifugation and dried in vacuum at room temperature to obtain a black powder sample. The particle diameter and particle shape were measured using transmission electron microscopy (TEM; Hitachi HT7700) at an accelerating voltage of 100 kV, as shown in Fig. 1(a)–(c). The particle shape was circular. Fig. 1(d)–(f) show the distributions of the particle diameters of the Pd NPs, which exhibited mean diameters of 2.0 ± 0.4, 4.6 ± 0.9 and 7.6 ± 1.3 nm.
1 H2O/ethanol mixture solvent and then refluxed for 3 h, following a method previous described in the literature.37 For the 4.6 nm-diameter Pd NPs, 10 mmol PVP was dissolved in 300 mL of ethylene glycol and heated to 170 °C. In addition, 1 mmol Na2PdCl4 was dissolved in 40 mL of H2O. The precursor solution was sprayed with an ethylene glycol solution while maintaining a temperature of 170 °C. For the 7.6 nm-diameter Pd NPs, 2 mmol Na2PdCl4 and PVP were dissolved in 1000 mL of ethanol and then refluxed for 3 h. After the reactions, all the samples were washed with a mixture of the solution/diethylether/acetone once, a H2O/diethylether/acetone mixture twice and an ethanol/diethylether mixture 5 times and were then collected by centrifugation and dried in vacuum at room temperature to obtain a black powder sample. The particle diameter and particle shape were measured using transmission electron microscopy (TEM; Hitachi HT7700) at an accelerating voltage of 100 kV, as shown in Fig. 1(a)–(c). The particle shape was circular. Fig. 1(d)–(f) show the distributions of the particle diameters of the Pd NPs, which exhibited mean diameters of 2.0 ± 0.4, 4.6 ± 0.9 and 7.6 ± 1.3 nm.
2.2 High-energy X-ray diffraction
To analyze the structural information of the Pd NPs we performed HE-XRD at beamline BL04B2 at SPring-8 in Japan. An incident X-ray energy of 61.46 keV was selected using a Si (220) monochromator with a single-bounce and bent crystal. The respective Pd NP samples were placed in a capillary tube with an inner diameter of 1 mm using transmission X-ray geometry at room temperature. The crystal structure and lattice constant were evaluated from the HE-XRD patterns using the Rietveld refinement method. The local structure, coordination number, degree of disordering and 3D atomic configuration of the Pd NPs were determined from RMC modelling and the bond orientational order (BOO) parameter.2.3 X-ray absorption fine structure spectroscopy
The local atomic structure of the Pd NPs was determined using XAFS. The incident X-rays were tuned using a Si (311) double-crystal monochromator near the Pd K-edge at beamline BL01B1 at SPring-8 in Japan. The XAFS measurements were performed using transmission X-ray geometry at room temperature and the data were calibrated using standard Pd foil. The X-ray intensities of the incident and transmitted beams were recorded using ionization chambers located in front and behind the respective samples. The standard procedure was applied to remove the pre-edge and post-edge background. Extended absorption fine structure (EXAFS) spectra were derived by subtracting the background using a third-order polynomial spline function defined over a series of intervals within the entire k-range. The node positions of the resulting polynomial were then optimized to remove the EXAFS signal below R = 1 Å. The metrical parameters were derived by performing a non-linear least squares fit of the EXAFS spectra in the k-range of 3–14 Å−1 and R-range of 1–4 Å.2.4 Hard X-ray photoelectron spectroscopy
The electronic structure of the Pd NPs was investigated using HAXPES at the NIMS beamline BL15XU at SPring-8 in Japan. The photon energy was fixed at 5.95 keV using a Si (111) double crystal monochromator and the Si (333) reflection of a channel-cut monochromator. The photon energy was calibrated using a standard Au sample. The X-ray penetration depth of the sample was approximately 17–20 nm, which is greater than the particle diameter of the Pd NPs with a PVP layer.32 The Pd NPs were mixed with carbon powder to remove any charge-up effects. The HAXPES measurements were performed in a vacuum of 10−7 Pa at room temperature.3 Results and discussion
Fig. 2(a)–(c) present the HE-XRD patterns of the Pd NPs as a function of particle diameter (black circles in Fig. 2(a)–(c)) and estimated profiles obtained using the Rietveld refinement method (red lines in Fig. 2(a)–(c)). The XRD peak positions of the Pd NPs matched well with the fcc crystal structure (red marks in Fig. 2(a)–(c)). The weighted profile R-factor, Rwp, values of the Rietveld results were between 5% and 7%, which appears to fit well. The lattice constants of the 2.0, 4.6 and 7.6 nm-diameter Pd NPs were determined to be 3.960 ± 0.019, 3.904 ± 0.012 and 3.902 ± 0.005 Å, respectively, as shown in Fig. 2(d). The 2.0 nm diameter NPs had a much larger lattice constant than those of the other NPs. The evaluated lattice constants were slightly larger than the bulk Pd value of 3.891 Å. Fig. 2(e) shows the crystalline domain size of the Pd NPs, which were 1.3, 1.6 and 2.6 nm for the NPs with particle diameters of 2.0, 4.6 and 7.6 nm, respectively. Fig. 2(f) presents the mean square displacement, which corresponds to the thermal vibration and static displacement of atoms and is related to the Debye temperature factor.38 The relation is M = B![[thin space (1/6-em)]](https://www.rsc.org/images/entities/char_2009.gif) sin2(θ)/λ2 and the B factor is B = 8π2〈u2〉, where 〈u2〉 is the mean square amplitude of the vibration of the atoms.38 The crystalline domain and square displacement results indicate that larger NPs have less defects and a less disordered structure.
sin2(θ)/λ2 and the B factor is B = 8π2〈u2〉, where 〈u2〉 is the mean square amplitude of the vibration of the atoms.38 The crystalline domain and square displacement results indicate that larger NPs have less defects and a less disordered structure.
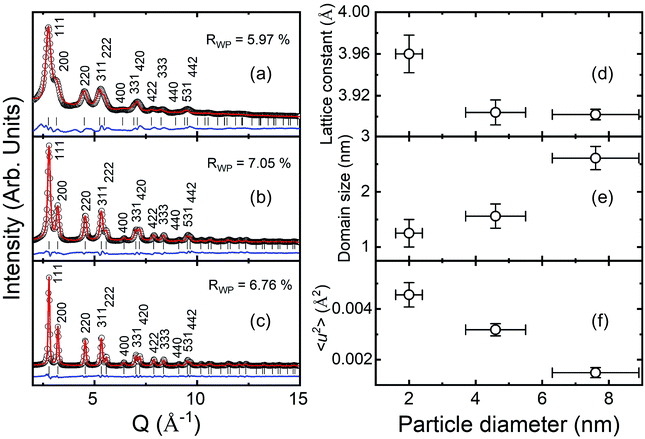 | ||
| Fig. 2 HE-XRD patterns of Pd NPs with diameters of (a) 2.0, (b) 4.6 and (c) 7.6 nm and analysis of their crystal structures using Rietveld refinement method. (d) Lattice constant, (e) crystalline domain size and (f) Debye–Waller factor of the Pd NPs as a function of particle diameter.38 | ||
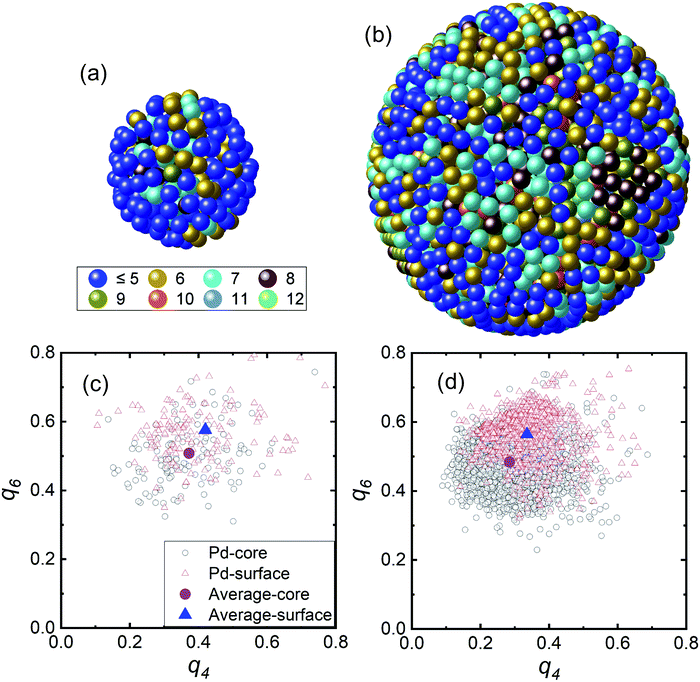
The RMC modelling provided the 3D atomic positions of the Pd NPs based on a hard sphere model using RMCPOT software.39 Fig. 3(a) and (b) show the atomic pair distribution and coordination number. The particle numbers in the hard sphere models for the 2.0 and 4.6 nm-diameter NPs were N = 277 and N = 3447, respectively. Fig. S1† shows the RMC structure factor and experimental results, which matched well. The average coordination numbers of the first nearest neighbour for the 2.0 and 4.6 nm-diameter NPs were 4.8 ± 1.6 and 7.3 ± 1.9, respectively. These values were smaller than those expected from the EXAFS results.40–42 The EXAFS technique is often used to estimate the coordination number of particles of various sizes and indicated a reduction of 30–40% compared with the bulk value for the 2 nm-diameter NPs. Higher intra-particle disordering of the Pd NPs from the crystalline domain size can be inferred compared with an ideal model.41 In addition, in Fig. 3(a) and (b) based on hard sphere models with coordination number, the coordination numbers of the inner regions were higher than those of the surface regions, which indicates that the surface region was composed of more disordered structures. The surface part is defined as the 0.33 nm-thick outer region, and the core is the remainder. For the 2.0 nm-diameter NPs, the blue colored atoms of low coordination number covered the surface region unlike the case for the 4.6 nm-diameter NPs. In addition, the 2.0 nm-diameter NPs had more cavity space in the surface region than the 4.6 nm-diameter NPs. The crystalline disordering of the NPs with smaller particle diameter was much larger than that of the NPs with larger particle diameter. Hydrogen is known to be readily dissolved and trapped in grain boundaries and dislocations in metals.43,44 Thus, the high degree of disorder of the smaller Pd NPs may be the origin of the weak hydride formation. In addition, the hydrogen storage capacity of smaller Pd NPs has been reported to be reduced because hydrogen atoms are intensively located in the core region of the Pd NPs.26
Fig. 3(c) and (d) show the distribution of the BOO parameters of the Pd NPs in the q4 and q6 plane from the 3D positions in Fig. 3(a) and (b).45–47 The q4 and q6 values were calculated using the spherical harmonic function of nearest-neighbouring atoms with consideration of the bond angles and numbers of nearest neighbors. The equations for calculating the BOO distribution are expressed by eqn (S1) and (S2).† The black open circles represent the Pd core atoms and the red open triangles represent the Pd surface atoms. The mean values of the core and surface parts are represented by the purple circles and blue triangle, respectively. The mean values for the core and surface regions using the BOO distribution were evaluated. In Table 1, the q4 and q6 values are tabulated as a function of particle diameter and it is apparent that these values decreased with increasing particle diameter. To evaluate the degree of disorder we calculated the PBOO value which indicates the local structural deviation from an ideal fcc crystal structure (q4,ideal: 0.190 and q6,ideal: 0.575).47 The PBOO value represents the local structural deviation of the metal NPs from an ideal crystal structure, as defined by eqn (S3).†38,48 We evaluated the PBOO parameters for the core and surface regions. The PBOO values for the core part for the Pd NPs with diameters of 2.0 and 4.6 nm were 0.970 and 0.524, respectively, and those of the surface parts were 1.211 and 0.769, respectively. These results indicate that the ordering of the surface region was worse than that of the core region and that the degree of disorder was reduced with increasing particle diameter.
| Diameter | q4 | q6 | PBOO | |||
|---|---|---|---|---|---|---|
| Core | Surface | Core | Surface | Core | Surface | |
| 2.0 nm | 0.373 | 0.420 | 0.508 | 0.576 | 0.970 | 1.211 |
| 4.6 nm | 0.285 | 0.336 | 0.484 | 0.565 | 0.524 | 0.769 |
Fig. 4 presents the χ(k) × k3 EXAFS (a) and Fourier-transform (FT) (b) spectra at the Pd K-edge. With decreasing particle diameter the amplitude of the (k) spectra (Fig. 4(a)) decreased over the entire k-range. The monotonic decrease in the (k) amplitude over the entire k-range is concomitant with the continuous reduction in the coordination number. With decreasing Pd NP diameter the contribution from the surface atoms, which have a lower coordination number compared with the Pd bulk, increased in the EXAFS signal. Consequently, the coordination number decreased with decreasing particle diameter.
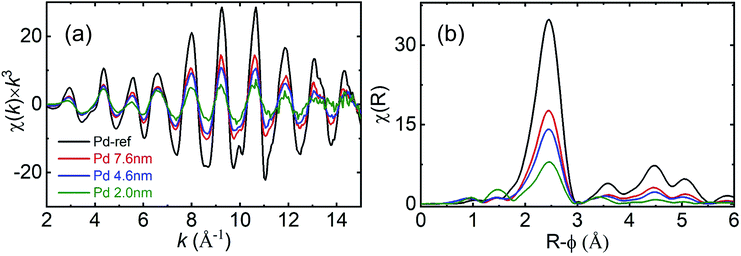 | ||
| Fig. 4 (a) Pd K-edge XAFS spectra of χ(k) × k3 and (b) Fourier-transform moduli of the Pd NPs and reference Pd foils (black: Pd reference, red: 7.6 nm, blue: 4.6 nm and olive: 2.0 nm). | ||
In the FT spectra, the FT amplitude decreased with decreasing particle diameter. For the 7.6 and 4.6 nm-diameter NPs, the higher R features within the range of 3–5.5 Å and were similarly relative to those observed for the bulk Pd, indicating that the fcc structure was preserved. However, the reduction in the amplitude of the higher R features indicates the formation of smaller NPs. For the 2.0 nm-diameter NPs, the amplitude of the higher R features decreased rapidly relative to those of the other samples. This finding indicates that structural disordering also increases with decreasing particle diameter. To determine the coordination number and Debye–Waller factor, we performed a non-linear least squares fit on the EXAFS data. The obtained parameters (Table S1†) and fitted profiles (Fig. S2†) are presented in the ESI.† We observed that the value of the shell distance was close to those obtained for fcc bulk Pd in all the samples. However, the coordination numbers were reduced and the Debye–Waller factor increased with decreasing particle diameter. Despite the differences observed in the coordination number and Debye–Waller factor determined using HE-XRD and XAFS analysis, the trend of increasing disordering and decreasing coordination number remained the same. Due to the low scattering cross-section with respect to X-rays and low electron number density of hydrogen, it is difficult to observe the hydrogen positions inside Pd NPs. Absorbed hydrogen affected the lattice constant variation of Pd indirectly by observing XRD results.12
Fig. 5(a) presents the valence band (VB) HAXPES spectra of bulk Pd and the Pd NPs. The electronic state of Pd is closely linked to the hydrogen absorption properties. The VB HAXPES spectra of only the Pd NPs are shown after the background carbon powder signal was properly subtracted. The VB area intensity was the same after the intensity normalization. The VB density of state (DOS) shifted toward a higher binding energy for the 4.6 and 7.6 nm-diameter Pd NPs. Yang et al. reported that the Pd 4d DOS is a main contributor to the Pd VB HAXPES spectrum, which was obtained from density functional theory (DFT) calculation of the Pd bulk.29 The d state of Pd is an important parameter in determining the hydrogen absorption and chemical reaction properties. The d-band model proposed by Hammer and Norskov was applied to explain the catalytic activities of the metal, which are related to the position of the d-band center.49,50 In addition, the width and center position of the d-band are related to the coordination numbers of the metal.24 The broadening of the VB spectra decreased and the d-band center position increased with decreasing particle diameter, as indicated by the black squares in Fig. 5(b). This finding corresponds with the XAFS and RMC results that the coordination number decreased with decreasing particle diameter.40–42 The d-band center position and thermodynamic parameters of the exothermic heat of hydride formation (ΔHα→β) reported by Yamauchi et al. in 2008 are plotted in Fig. 5(b).26 The stability of the hydride formation showed a similar trend with the results of the d-band center position. The bond strength of Pd–H formation decreased with decreasing particle diameter. When the d-band states approach the Fermi level, the anti-bonding states are able to move above it and become empty in the metal. As a result, the bond strength is increased. We concluded that the lower hydrogen storage capability and weaker Pd–H bonding strength of the smaller NPs can be owing to a higher d-band center position originating from the higher surface disordering of the Pd NPs.
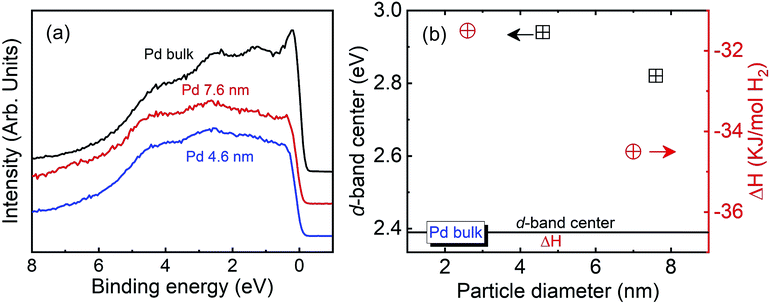 | ||
| Fig. 5 (a) Valence band HAXPES spectra of bulk Pd and Pd NPs. (b) d-Band center position and exothermic heat of hydride formation of Pd bulk and Pd NPs.26 | ||
4 Conclusions
We characterized the structures of Pd NPs and their relationship to hydrogen storage properties using various synchrotron X-ray techniques. The lattice constant and nearest-neighbour distance increased with decreasing particle diameter, whereas the degree of disordering in the Pd NPs, especially of the surface atoms, increased. In addition, the coordination numbers decreased with decreasing particle diameter. Degradation of the surface part can easily result in the formation of Pd–H bonding. The bond strength of the Pd–H formation was shown to decrease with decreasing particle diameter according to the d-band center model. Analysis of the whole crystal structure and electronic structure using HE-XRD, XAFS and HAXPES was used to interpret the relationships between the hydrogen storage capability, bond strength of Pd–H formation and particle diameter of the Pd NPs.Conflicts of interest
There are no conflicts to declare.Acknowledgements
This work was partly supported by ACCEL, Japan Science and Technology Agency (JST) under Grant No. JPMJAC1501. Hard X-ray Photoelectron Spectroscopy and High-energy XRD measurements were performed at SPring-8 with the approval of the NIMS synchrotron X-ray Station at SPring-8 under proposal No. 2015B4907, 2017A4501 and 2017B4503. High-energy XRD and X-ray absorption fine structure measurements performed at SPring-8 with the approval of the Japan Synchrotron Radiation Research Institute under Proposal No. 2014B1210, 2015B1245, 2016B1033, 2017A1320, 2017B1019, 2017B1368 and 2018A1351. This work was also partly supported by the Ministry of Education, Culture, Sports, Science and Technology of Japan (OS:18K04868) and Basic Science Research Program through the National Research Foundation of Korea (NRF) funded by the Ministry of Education (2018R1A6A3A03012052). The authors would also like to thank Tiffany Jain, M.S., from the Edanz Group (http://www.edanzediting.com/ac) for editing a draft of this manuscript.References
- G. Li, H. Kobayashi, S. Dekura, R. Ikeda, Y. Kubota, K. Kato, M. Takata, T. Yamamoto, S. Matsumura and H. Kitagawa, J. Am. Chem. Soc., 2014, 136, 10222–10225 CrossRef CAS
.
- S.-I. Orimo, Y. Nakamori, J. R. Eliseo, A. Züttel and C. M. Jensen, Chem. Rev., 2007, 107, 4111–4132 CrossRef CAS
.
- G. Alefeld and J. Völkl, Hydrogen in Metals, Springer, Berlin, 1978 Search PubMed
.
- K. Kusada, M. Yamauchi, H. Kobayashi, H. Kitagawa and Y. Kubota, J. Am. Chem. Soc., 2010, 132, 15896–15898 CrossRef CAS
.
- K. Kusada, H. Kobayashi, R. Ikeda, Y. Kubota, M. Takata, S. Toh, T. Yamamoto, S. Matsumura, N. Sumi, K. Sato, K. Nagaoka and H. Kitagawa, J. Am. Chem. Soc., 2014, 136, 1864–1871 CrossRef CAS
.
- H. Kobayashi, M. Yamauchi, R. Ikeda, T. Yamamoto, S. Matsumura and H. Kitagawa, Chem. Sci., 2018, 9, 5536–5540 RSC
.
- H. Kobayashi, M. Yamauchi, H. Kitagawa, Y. Kubota, K. Kato and M. Takata, J. Am. Chem. Soc., 2010, 132, 5576–5577 CrossRef CAS
.
- W.-C. Xu, K. Takahashi, Y. Matsuo, Y. Hattori, M. Kumagai, S. Ishiyama, K. Kaneko and S. Iijima, Int. J. Hydrogen Energy, 2007, 32, 2504–2512 CrossRef CAS
.
- O. K. Farha, Ö. Yazaydin, I. Eryazici, C. D. Malliakas, B. G. Hauser, M. G. Kanatzidis, S. T. Nguyen, R. Q. Snurr and J. T. Hupp, Nat. Chem., 2010, 2, 944 CrossRef CAS
.
- G. Li, H. Kobayashi, J. M. Taylor, R. Ikeda, Y. Kubota, K. Kato, M. Takata, T. Yamamoto, S. Toh, S. Matsumura and H. Kitagawa, Nat. Mater., 2014, 13, 802 CrossRef CAS
.
- D. E. Eastman, J. K. Cashion and A. C. Switendick, Phys. Rev. Lett., 1971, 27, 35–38 CrossRef CAS
.
- H. Kobayashi, M. Yamauchi, H. Kitagawa, Y. Kubota, K. Kato and M. Takata, J. Am. Chem. Soc., 2008, 130, 1828–1829 CrossRef CAS
.
- H. Kobayashi, H. Morita, M. Yamauchi, R. Ikeda, H. Kitagawa, Y. Kubota, K. Kato, M. Takata, S. Toh and S. Matsumura, J. Am. Chem. Soc., 2012, 134, 12390–12393 CrossRef CAS
.
- R. Griessen and A. Driessen, Phys. Rev. B: Condens. Matter Mater. Phys., 1984, 30, 4372–4381 CrossRef CAS
.
- S. K. Konda and A. Chen, Mater. Today, 2016, 19, 100–108 CrossRef CAS
.
- A. J. Maeland and T. R. P. Gibb, J. Phys. Chem., 1961, 65, 1270–1272 CrossRef CAS
.
- J. W. Simons and T. B. Flanagan, J. Phys. Chem., 1965, 69, 3581–3587 CrossRef CAS
.
- S. Yun, J. H. Ko and S. T. Oyama, J. Membr. Sci., 2011, 369, 482–489 CrossRef CAS
.
- J. Tong and Y. Matsumura, Chem. Commun., 2004, 2460–2461 RSC
.
- H. Li, A. Caravella and H. Y. Xu, J. Mater. Chem. A, 2016, 4, 14069–14094 RSC
.
- J. RaviPrakash, A. McDaniel, M. Horn, L. Pilione, P. Sunal, R. Messier, R. McGrath and F. Schweighardt, Sens. Actuators, B, 2007, 120, 439–446 CrossRef CAS
.
- H. Kobayashi, M. Yamauchi and H. Kitagawa, J. Am. Chem. Soc., 2012, 134, 6893–6895 CrossRef CAS
.
- K. Kusada, H. Kobayashi, R. Ikeda, H. Morita and H. Kitagawa, Chem. Lett., 2013, 42, 55–56 CrossRef CAS
.
- C. Song, A. Yang, O. Sakata, L. S. R. Kumara, S. Hiroi, Y.-T. Cui, K. Kusada, H. Kobayashi and H. Kitagawa, Phys. Chem. Chem. Phys., 2018, 20, 15183–15191 RSC
.
- M. Yamauchi, H. Kobayashi and H. Kitagawa, ChemPhysChem, 2009, 10, 2566–2576 CrossRef CAS
.
- M. Yamauchi, R. Ikeda, H. Kitagawa and M. Takata, J. Phys. Chem. C, 2008, 112, 3294–3299 CrossRef CAS
.
- T. Yayama, T. Ishimoto and M. Koyama, J. Alloys Compd., 2015, 653, 444–452 CrossRef CAS
.
- T. Yayama, T. Ishimoto and M. Koyama, J. Alloys Compd., 2016, 662, 404–408 CrossRef CAS
.
- A. Yang, O. Sakata, K. Kusada, T. Yayama, H. Yoshikawa, T. Ishimoto, M. Koyama, H. Kobayashi and H. Kitagawa, Appl. Phys. Lett., 2014, 105, 153109 CrossRef
.
- A. Bruix, J. V. Lauritsen and B. Hammer, Faraday Discuss., 2016, 188, 323–343 RSC
.
- D. Cho, K. C. Ko, O. Lamiel-García, S. T. Bromley, J. Y. Lee and F. Illas, J. Chem. Theory Comput., 2016, 12, 3751–3763 CrossRef CAS
.
- N. Palina, O. Sakata, L. S. R. Kumara, C. Song, K. Sato, K. Nagaoka, T. Komatsu, H. Kobayashi, K. Kusada and H. Kitagawa, Sci. Rep., 2017, 7, 41264 CrossRef CAS
.
- L. S. R. Kumara, O. Sakata, S. Kohara, A. Yang, C. Song, K. Kusada, H. Kobayashi and H. Kitagawa, Phys. Chem. Chem. Phys., 2016, 18, 30622–30629 RSC
.
- L. S. R. Kumara, O. Sakata, H. Kobayashi, C. Song, S. Kohara, T. Ina, T. Yoshimoto, S. Yoshioka, S. Matsumura and H. Kitagawa, Sci. Rep., 2017, 7, 14606 CrossRef
.
- V. Petkov, T. Ohta, Y. Hou and Y. Ren, J. Phys. Chem. C, 2007, 111, 714–720 CrossRef CAS
.
- V. Petkov, B. Prasai, S. Shastri and T.-Y. Chen, ACS Appl. Mater. Interfaces, 2015, 7, 23265–23277 CrossRef CAS
.
- T. Teranishi and M. Miyake, Chem. Mater., 1998, 10, 594–600 CrossRef CAS
.
- O. Seo, O. Sakata, J. M. Kim, S. Hiroi, C. Song, L. S. R. Kumara, K. Ohara, S. Dekura, K. Kusada, H. Kobayashi and H. Kitagawa, Appl. Phys. Lett., 2017, 111, 253101 CrossRef
.
- O. Gereben and L. Pusztai, J. Comput. Chem., 2012, 33, 2285–2291 CrossRef CAS
.
- N. S. Marinković, K. Sasaki and R. R. Adžić, Zast. Mater., 2016, 57, 101–109 Search PubMed
.
- A. I. Frenkel, A. Yevick, C. Cooper and R. Vasic, Annu. Rev. Anal. Chem., 2011, 4, 23–39 CrossRef CAS PubMed
.
- A. Jentys, Phys. Chem. Chem. Phys., 1999, 1, 4059–4063 RSC
.
- H.-B. Zhou, Y.-L. Liu, S. Jin, Y. Zhang, G.-N. Luo and G.-H. Lu, Nucl. Fusion, 2010, 50, 025016 CrossRef
.
- M. Q. Chandler, M. Horstemeyer, M. Baskes, G. Wagner, P. Gullett and B. Jelinek, Acta Mater., 2008, 56, 619–631 CrossRef CAS
.
- P. J. Steinhardt, D. R. Nelson and M. Ronchetti, Phys. Rev. B: Condens. Matter Mater. Phys., 1983, 28, 784–805 CrossRef CAS
.
- S. Ogata, Phys. Rev. A: At., Mol., Opt. Phys., 1992, 45, 1122–1134 CrossRef CAS
.
- W. Mickel, S. C. Kapfer, G. E. Schröder-Turk and K. Mecke, J. Chem. Phys., 2013, 138, 044501 CrossRef
.
- O. Seo, J. Kim, S. Hiroi, C. Song, L. S. R. Kumara, A. Tayal, Y. Chen, H. Kobayashi, H. Kitagawa and O. Sakata, Appl. Phys. Lett., 2018, 113, 071907 CrossRef
.
- B. Hammer and J. K. Norskov, Nature, 1995, 376, 238–240 CrossRef CAS
.
- B. Hvolbaek, T. V. Janssens, B. S. Clausen, H. Falsig, C. H. Christensen and J. K. Norskov, Nano Today, 2007, 2, 14–18 CrossRef
.
Footnotes |
| † Electronic supplementary information (ESI) available: RMC modeling, BOO equation, PBOO equation and EXAFS analysis of Pd NPs (Fig. S1 and S2, eqn (S1)–(S3) and Table S1). See DOI: 10.1039/c9ra02942g |
| ‡ These authors contributed equally to this work. |
| § Present address: NISSAN ARC, Ltd., 1 Natsushima-cho, Yokosuka, Kanagawa 237-0061, Japan. |
| ¶ Present address: Research & Utilization Division, Japan Synchrotron Radiation Research Institute (JASRI), 1-1-1 Kouto, Sayo, Hyogo 679-5198, Japan. |
| || Present address: The Institute for Solid State Physics, The University of Tokyo, Kashiwanoha 5-1-5, Kashiwa, Chiba, 277-8581, Japan. |
| This journal is © The Royal Society of Chemistry 2019 |

