 Open Access Article
Creative Commons Attribution 3.0 Unported Licence
Effect of Ta addition on the structural, thermodynamic and mechanical properties of CoCrFeNi high entropy alloys†
Zhenyu
Du
a,
Jie
Zuo
*b,
Nanyun
Bao
a,
Mingli
Yang
 c,
Gang
Jiang
a and
Li
Zhang
 *a
*a
aInstitute of Atomic and Molecular Physics, Sichuan University, Chengdu 610065, China. E-mail: jiezuo@scu.edu.cn; lizhang@scu.edu.cn
bCollege of Computer Science, Sichuan University, Chengdu 610065, China
cResearch Center for Materials Genome Engineering, Sichuan University, Chengdu 610065, China
First published on 28th May 2019
Abstract
Ta addition has considerable effects on the microstructures and mechanical performances of CoCrFeNi alloy systems. Structure search with the special quasirandom structure method and structure identification with first-principles calculations were carried out to investigate the structural, thermodynamic and mechanical properties of CoCrFeNiTax (x = 0.0–1.0) high-entropy alloys in the fcc and bcc lattice frameworks. The predicted lattice parameters of identified structures are in agreement with available experiments. Phase transition between the fcc and bcc lattices was predicted for the lowest-energy structures with increasing Ta content. The predicted temperature dependence of specific heat capacity for the identified structures matches well with the Dulong–Petit, Kepp and Debye Models. Both vibration and configuration entropy contribute to the stabilization of alloy systems, while the latter is about 2–3 times greater than the former. The elastic constants and moduli vary with composition and phase structure. Ta atoms have preference to some atoms like Ni, and form relatively strong bonds with adjacent atoms. The introduction of Ta promotes the electron localization and favors the formation of mixed structures.
1. Introduction
High-entropy alloys (HEAs) have attracted extensive research attention in the past decade, most of which was aimed at developing a series of alloy systems with novel properties.1–8 A number of HEAs with unique microstructures,9,10 predominant mechanical,11,12 great thermal stability,13 complex magnetic behavior14 and brilliant properties of corrosion resistance6 have been reported. Compared with conventional alloys, HEAs have high entropy of mixing that promote the formation of solid solution phase and intermetallic compounds in simple crystal structures. Three kinds structures, face-centered cubic (fcc),15 body-centered cubic (bcc)15 and hexagonal close-packed (hcp) crystallographic structures,16 have so far been characterized for HEAs.In recent years, HEAs with broad atomic compositions were investigated based on CoCrFeNi systems.17–21 Elements like Al, Mo, Ti and Si were successfully added into the CoCrFeNi system to assess their alloying influences on the structures and properties of the multi-component alloys.22–28 Wang et al.29 studied the transition from paramagnetism to superparamagnetism in the amorphous phase for the CoCrFeNiCuTix alloys. Liu et al.30 concluded that the CoCrFeNiMo0.3 HEA exhibits a tensile strength as high as 1.2 GPa and a good ductility of ∼19%. Zhang et al.31 found that the as-cast structure of AlxCoCrFeNiTi tends to be a single bcc phase. Ma et al.32 reported that the compressive yielding strength and Vickers hardness of AlCoCrFeNbxNi systems have significant variations with the addition of Nb. On the computational side, Feng et al.33 investigated the effects of Mn and Al additions on the structural stability and magnetic properties of FeCoNi-based alloys by means of density functional theory (DFT) calculations at Perdew, Burke, and Ernzerhof (PBE) level.34 The alloy structures change from fcc to bcc with the increase of Mn and Al content for FeCoNi(MnAl)x alloys. First-principles electronic structure calculations at the PBE level were performed by Zaddach et al.35 to determine the elastic constants and lattice parameters of NiFeCrCoMn alloys, which are in agreement with the mechanical testing and microstructure characterization. Tian et al.36 predicted that NiCoFeCrAlx HEAs have excellent micromechanical properties, and strong metallic and ductility characters when x = 1 through ab initio calculations using the PBE functional. Those computational studies have proven that computations are an effective approach to identify the microstructures and properties of alloy systems.
Ta, with a high melting point,37 was often added to alloys to enhance their structure stability. Zheng et al.38 investigated the effect of Ta addition on the stress rupture properties and microstructural stability of Ni-based alloys, verifying that the eutectic phase enhances the stress rupture. Stelmakh et al.39 synthesized the Ta–W solid solution alloy photonic crystals as spectrally selective components for high-temperature energy conversion. Jiang et al.37 reported the alloying effects of Ta on the microstructures and mechanical properties of CoCrFeNi alloy, finding a high fracture strength of 2.29 GPa for CoCrFeNiTa0.4. It has been proven experimentally that Ta addition has great influence on the performances of alloys. However, such influence has been scarcely investigated computationally, especially for the case of Ta-containing HEAs. Computational studies not only predict the microstructures of alloys lack of experimental characterization, but also suggest the correlation between the microstructures and the properties, which are helpful for the design of new alloys with target performances. This work aims to establish the relationship between the microstructures and the performances of CoCrFeNiTax alloys. The microstructures of CoCrFeNiTax alloys, including their interatomic bonding, g(r), ELF, and formation energy, etc., were computed and correlated with their performances, such as heat capacity, elastic constant and modulus.
2. Computational methods
Despite of the single solid solution phase, it is still a great challenge to study HEAs by first-principles calculations because of their multiple-component and complex structures with numerous possible candidates. One strategy to solve this problem is to use the special quasirandom structure (SQS)40 method to construct the most disordered HEA structures, which are then sent to subsequent first-principles calculations for further identification. For example, Feng et al.33 investigated structural stability of quaternary FeCoNiX (X = Al, Mn) alloys using the model structures screened with the SQS method. Wang et al.41 applied the first-principles phonon method to predict the major phase separations for the refractory VNbMoTaW HEAs which are based on the SQS structures.In the studied CoCrFeNiTax structures, the fraction of Ta varies between x = 0.0 and x = 1.0 with an interval of 0.2. It has been noted that lattice structures of HEAs are relevant to their average valence electron concentrations (VEC).42 As an indicator of phase structures, VEC is often used to predict that a solid solution adopts fcc or bcc structure.6 HEAs usually adopt bcc phase for VEC < 6.87, fcc phase for VEC > 8, and fcc–bcc mixture for 6.87 < VEC < 8. The VEC of CoCrFeNiTax alloys are listed in Table 1, which are about 7.60–8.25, suggesting that the alloys may have both bcc and fcc phases.
The Alloy-Theoretic Automated Toolkit (ATAT) developed by van de Walle and coworkers43,44 was used to generate the SQS structures of the quinary random solid solution CoCrFeNiTax HEAs. Screening the best SQS structure from the numerous candidates of a five-component alloy system is a challenging job. One can hardly figure out the SQS structures for these systems with completely random atomic distribution. In our computations, the screening process was interrupted when the best SQS structure did not change on the list after a long period of time (>100 hours). The lattice vector and atomic positions of the acquired SQS models were given in Table S1 in the ESI.† Ten SQS runs were performed for each composition and all these ten SQS structures were collected for further identification at the first-principles level.
A number of quantities were used to identify the structures of the alloys. Valence electron concentration is computed with
 | (1) |
 | (2) |
 | (3) |
The structural optimization and energy calculation were carried out for all the SQS screened structures using the DFT calculations with the Vienna Ab initio Simulation Package (VASP).48 The projector augmented-wave (PAW) method and standard PBE exchange-correlation functional were employed.34 The convergence criteria were set to 10−8 eV in energy and 10−3 eV Å−1 in force in structure optimization. The cut-off energy was selected as 600 eV in the simulations and a Monkhorst–Pack k-point mesh of 19 × 19 × 19 was applied for Brillouin zone sampling. It has been shown that these settings35 produce reliable results for HEA systems.
The lowest-energy structures screened at the first-principles level for all the studied compositions were further verified with phonon spectroscopy calculations.49,50 No imaginary frequencies were found for these structures. The phonon density of states and the heat capacity at constant volume (Cv) and the vibration entropy ΔSvib were then computed. The formation energy, ΔEf, is evaluated with
 | (4) |
 | (5) |
| B = (C11 + C12)/3, | (6) |
 | (7) |
Young's modulus (E) can be derived from the B and G:
| E = (9BG)/(3B + G) | (8) |
3. Results and discussion
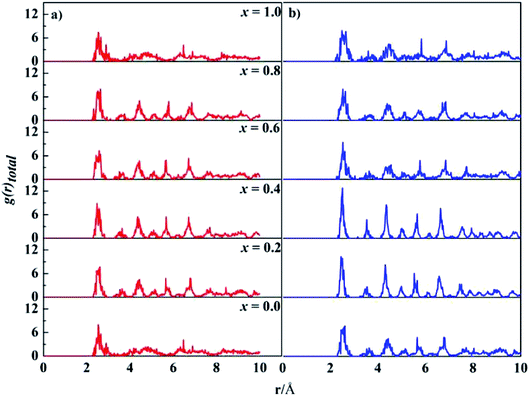
The computed lattice parameters of the studied structures are presented in Table 1. The XRD measured parameters are also given for comparison.35,37,55 Good agreement between our calculations and measurements were reached. The deviations from the measurements for fcc structures are about 2.0%, 1.4%, and 0.1%, for x = 0, 0.2 and 0.4, respectively. Moreover, the lattice parameters increase with Ta content for both bcc and fcc structures. Ta has big atomic size, its addition usually leads to lattice expansion, which has been observed in other experiments.56–58Total PDF, g(r), measures the number of atoms around given atoms as a function of distance (r). Fig. 1 shows the total PDF of the studied CoCrFeNiTax structures. There are several sharp peaks at r < 8.0 Å, which implies ordered structures adopted by the atoms at short distances. The g(r) approaches to 1 when r > 8.0 Å, indicating disordered structures in the system at long distance. g(r) approaches to 1 when r increases because the density of atoms in a large concentric layer is close to that of averaged density of atoms of the whole system. The partial PDF, which measures the number of specific atoms around a given atom as a function of r. The partial PDFs of all pairs in CoCrFeNiTax are given in Fig. S1 to S12 in the ESI,† which highlight the relative locations of all atoms. Basically, the first peaks of g(r) occur at about 2.6 Å for all the structures, reflecting the fact that these atoms have similar bondlengths with each other. However, the atomic environments are to some extent different from each other. For example, Co atoms have a tendency to coordinate with each other and with Ni atoms in the fcc structure of x = 0.4 (Fig. S5†), while Cr atoms tend to coordinate with Ta and Ni atoms. Moreover, such tendencies are different in the corresponding bcc structures (Fig. S6†) in which Co atoms prefer Ta and Cr atoms, and Fe atoms prefer Cr and Ta atoms. The preferences of interatomic coordinations also change with Ta content. For example, Co atoms prefer Fe, Ta, Co, Ta, Co and Ni atoms, respectively, in the fcc structures when x changes from 0 to 1. Ta atoms show some preference in their coordinations. The highest peaks of x = 0.2–1.0 are for Ni, Ni, Co, Ni and Cr atoms in the fcc structures, and Ni, Ni, Ni, Fe and Cr atoms in the bcc structures, respectively. These preferences reflect that the diverse microstructures of CoCrFeNiTax alloys.
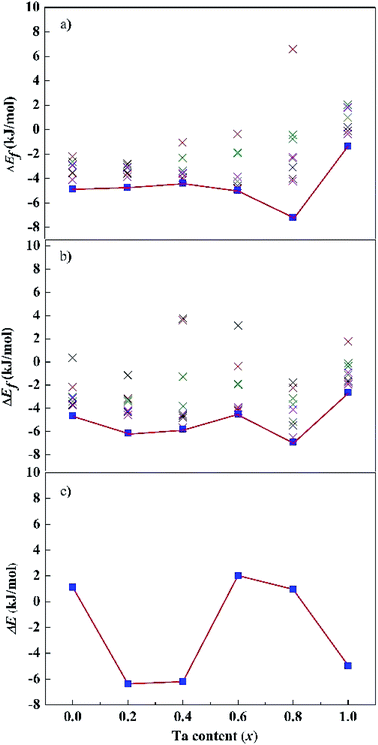
Fig. 2a and b show the dependence of formation energies ΔEf per atom on Ta content. The ΔEf values of all the SQS structures are marked in the figures. Most of them have negative ΔEf values except in isolated cases. Our calculations indicate that SQS may predict reasonable structures but repeated runs are necessary to avoid the rare instances. For both the fcc and bcc phases, their ΔEf of the lowest-energy structures are negative for all the calculated x values. Moreover, the ΔEf values vary with Ta content. For the fcc structures, the ΔEf values are close for x = 0.0–0.6. A drop occurs at x = 0.8, followed by an remarkable increase at x = 1.0. For the bcc structures, the ΔEf values oscillate and reach a bottom at x = 0.8, and a peak at x = 1.0. The composition of x = 0.8 is preferred for both the fcc and bcc structures, while the equimolar alloys have high energy. The relative stability of the alloys with a given composition is measured with their energy difference (ΔE) between the bcc and fcc phases, i.e., ΔE = (Ebcc – Efcc)/N, as shown in Fig. 2c. A positive ΔE implies a stable fcc structure, and vice versa. ΔE changes when the Ta content increases from 0.0 to 1.0. The bcc structure is more stable than the corresponding fcc one for x = 0.2, 0.4, and 1.0, the fcc structure becomes more stable for x = 0.0, 0.6, and 0.8. Our calculations predict that the CoCrFeNiTax alloys may adopt bcc or fcc lattice, or their mixture, depending on the Ta contents. However, one can note that absolute values of ΔEf are rather small for all these structures. Jiang et al.37 found that with increasing Ta content, the microstructure changes from an initial fcc solid solution to a mixed structure in CoCrFeNiTax consisting of bcc and other phases.
One should note that the SQS structures represent the most randomly distributed configuration of atoms in the bcc or fcc lattice at a given composition. These structures were generated within a reasonable period of computing time. Other configurations with similar random atomic distributions may also exist. The characterization of all these possible structures are extremely challenging for multi-component alloys, and we used only one of the most possible structures to explore the thermodynamic and mechanical properties of CoCrFeNiTax alloys.
Phonon frequencies were calculated under the harmonic approximation for the lowest-energy bcc and fcc structures. The computed density of phonon states (PHDOS) are given in Fig. S13 in the ESI.† No imaginary frequency was noted in the PHDOS for all the structures, verifying that the identified structures were local minimum on the potential energy surfaces. In addition, the PHDOS were used to calculate heat capacity, Cv, as a function of temperature, as presented in Fig. 3. The Cv values appear to be quite similar for the studied alloys, increasing rapidly at low temperature (<150 K), increasing slowing at 150–400 K and approaching to 25 J K−1 mol−1 at high temperature. For T near to 0 K, the valence electrons contribute mainly to Cv, making it proportional to γT, where γ = 10−4. Both phonons and electrons make contribute to the total Cv when T < θD (Debye temperature). When T ≫ θD, Cv = 3Nk ≈ 25 J K−1 mol−1. The Cv variations of CoCrFeNiTax are consistent with the prediction of Dulong–Petit, Kepp and Debye Models.59–61
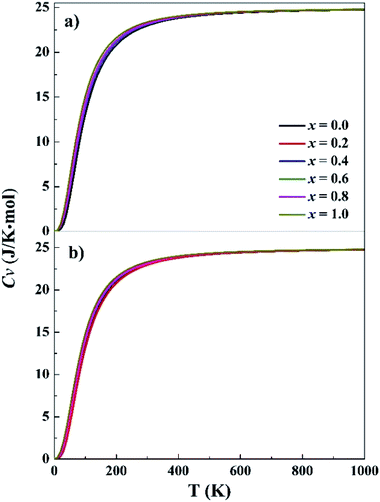 | ||
| Fig. 3 Specific heat capacity at constant volume for the fcc (a) and bcc (b) structures. x represents Ta content in the CoCrFeNiTax alloys. | ||
For HEA systems entropy changes are usually dominant because of their rather small formation energies. In contrast to the small ΔEf values presented above, relatively large entropy contributions were noted in the CoCrFeNiTax systems. The entropy change contains two parts, vibration (ΔSvib) and configuration (ΔScon). The ΔSvib values of CoCrFeNiTax, which were computed based on the phonon frequencies at the first-principles level, are given in Fig. 4. The ΔSvib exhibits similar variations with temperature, close to zero at low temperature and increasing gradually with temperature. The magnitudes of ΔSvib vary with Ta content. The differences are small at low temperature, increase with temperature between 0–250 K, but become almost unchanged at T > 300 K. The largest differences are about 2.5 J K−1 mol−1 for the fcc structures between x = 0.0 and 0.6, and for the bcc structures between x = 0.2 and 0.4. The configurational entropy ΔScon and ΔSvib at 300 K of the studied alloys are presented in Table 2. Both ΔScon and ΔSvib values are positive, implying that the formation of the alloys is a process of entropy increment. The magnitudes of ΔScon are about 2–3 times greater than those of ΔSvib, indicating that configurational entropy plays a dominant role in stabilizing the alloys. Although ΔSvib becomes greater at high temperature, its contribution to total entropy is still smaller than the ΔScon. A high entropy change promotes the extent of confusion in alloys and reduces the Gibbs free energy, favoring the random distribution of different elements in crystal lattice.
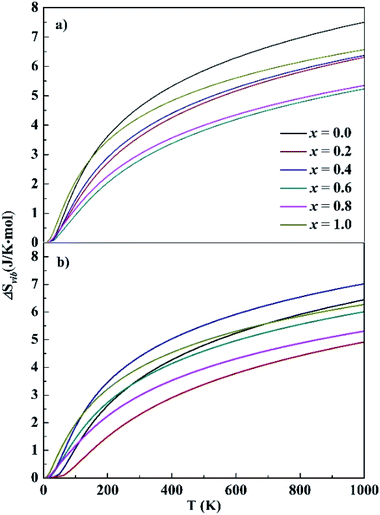 | ||
| Fig. 4 Calculated vibrational entropy of the fcc (top) and bcc (bottom) structures. x represents the Ta content in CoCrFeNiTax alloys. | ||
| x | ΔSvib (J K−1 mol−1) | ΔScon (J K−1 mol−1) | |
|---|---|---|---|
| bcc | fcc | ||
| 0.0 | 3.58 | 4.62 | 11.53 |
| 0.2 | 2.29 | 3.61 | 12.57 |
| 0.4 | 4.39 | 3.78 | 13.01 |
| 0.6 | 3.55 | 2.81 | 13.24 |
| 0.8 | 2.98 | 3.02 | 13.35 |
| 1.0 | 3.99 | 4.27 | 13.38 |
The computed averaged elastic constants C11, C12 and C44, as well as the Cauchy pressure (C12–C44) and the Zener ratio Az = 2C44/(C11 − C12) of CoCrFeNiTax are presented in Table 3. The dynamical stability conditions, i.e., C44 > 0, C11 > |C12| and C11 + 2C12 > 0,62 are satisfied by the presented lowest-energy fcc and bcc structures. For the structures with the same compositions, their elastic constants are different for the fcc and bcc ones. Some components, for example, C11 of x = 0.2 and C12 of x = 0.8, differ remarkably between the two phases. In the same phase, either fcc or bcc, the elastic constants are also different for the structures with different compositions. For example, C44 of the fcc structures varies between 66 and 160 GPa for x = 0–1, while the C44 of the bcc structures varies between 86 and 148 GPa. Therefore, the elastic constants of CoCrFeNiTax alloys vary with their phase structures and compositions. Positive Cauchy pressure is featured by ductile alloys, while negative Cauchy pressure is a signature of brittle alloys.63 The fcc structure of x = 0 and the bcc structures of x = 0, 0.4 and 0.8 are brittle, the rest of the structures are ductile. Az is used to predict the elastic anisotropy of materials. Az = 1 represents completely elastic isotropy, and its deviation from 1 measures the degree of elastic anisotropy.64 The predicted Az values of most structures are far from 1, verifying the anisotropic distribution of atoms in those lattice framework, as noted in the SQS structures presented in Table S1.†
| x | C 11 | C 12 | C 44 | C 12–C44 | A z |
|---|---|---|---|---|---|
| fcc | |||||
| 0.0 | 321 | 130 | 160 | −30 | 1.68 |
| 0.2 | 392 | 108 | 105 | +3 | 0.74 |
| 0.4 | 323 | 121 | 98 | +23 | 0.97 |
| 0.6 | 287 | 142 | 110 | +32 | 1.52 |
| 0.8 | 244 | 117 | 97 | +20 | 1.52 |
| 1.0 | 297 | 126 | 66 | +60 | 0.77 |
![[thin space (1/6-em)]](https://www.rsc.org/images/entities/char_2009.gif) |
|||||
| bcc | |||||
| 0.0 | 304 | 134 | 148 | −14 | 1.75 |
| 0.2 | 317 | 146 | 87 | +59 | 1.02 |
| 0.4 | 318 | 76 | 103 | −27 | 0.85 |
| 0.6 | 271 | 120 | 105 | +15 | 1.39 |
| 0.8 | 275 | 62 | 86 | −24 | 0.80 |
| 1.0 | 263 | 91 | 88 | +3 | 1.02 |
Based on the computed elastic constants, we further evaluated the shear modulus G, Young's modulus E, bulk modulus B, and Pugh ratio B/G of the CoCrFeNiTax alloys, which are presented in Fig. 5. Tian et al. predicted 207, 280 and 110 GPa for the B, E and G of CoCrFeNi alloys using DFT calculations.36 The corresponding values are 194, 319 and 130 GPa, which are in good agreement with Tian's computations. The moduli vary in a narrow ranges, 160–203 GPa for B, 73–130 GPa for G and 194–319 GPa for E of the fcc structures. The corresponding variations are 133–203, 87–119 and 219–295 GPa phase for the bcc structures. The E, G and B values exhibit a decreasing trend with Ta content, but the decreases are small. Moreover, the E, G and B values are dependent on the phase structure and composition. These moduli are to some extent different between the fcc and bcc structures with the same composition. B/G is also an empirical index to estimate the ductile-brittle behavior of alloys.65 Materials with B/G > 1.75 are ductile, whereas those with lower B/G values are considered to be brittle. According to the computed results, with the addition of Ta, the fcc structures become more ductile, whereas the bcc structures for x = 0.4 and 0.8 are brittle, which complies with the prediction with Cauchy pressure.
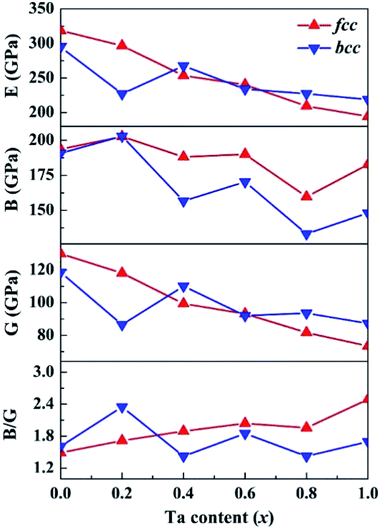 | ||
| Fig. 5 Calculated shear modulus (G), Young's modulus (E), bulk modulus (B), and B/G of the CoCrFeNiTax alloys. | ||
The microstructures, thermodynamic and mechanical properties of CoCrFeNiTax alloys are related to their electronic structures. Analysis on their electronic structures may shed light on their composition- and structure-dependent variations that are presented above. Electron localization function (ELF) is often used to analyze the interatomic interaction in alloy systems. ELF illustrates electron density among adjacent atoms that is used to classify the interatomic bonds and measure their bonding strengths.66 To highlight the effect of Ta addition on interatomic interaction, we calculated the ELF on the Ta-containing facets of the studied structures, as given in Fig. 6. In the figures ELF = 0 and 1 corresponds to a completely delocalized state and a perfect localized state, respectively. The ELF values are about 0.20–0.30 in the regions around Ta atoms, indicating that they has a great tendency to localize electrons. The electron localization tends to be enhanced with increasing Ta content for both the fcc and bcc structures. Two structures of x = 1.0 exhibit the largest ELF values around the Ta atoms. Although the enhanced localization strengthens the interatomic interaction between Ta and other atoms, it favors to form other phases. Similar interatomic interaction strengths are one of the features in HEA systems. The strong interaction between Ta and other atoms may disequilibrate the random distribution in alloys. Other experiments37,67 have verified that the addition of Ta in CoCrFeNi tend to form a mixed structures.
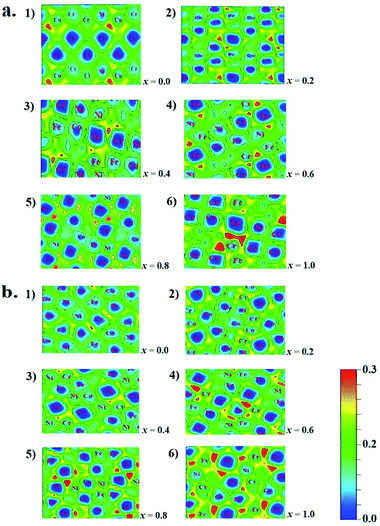 | ||
| Fig. 6 Electron localization function of fcc (a) and bcc (b) of CoCrFeNiTax alloys. (1–6) Denote the ELF values of the structures of x = 0.0 to 1.0, respectively. | ||
The band structures of CoCrFeNiTax are presented in Fig. S14 and S15 in the ESI.† All these alloys exhibit metallicity, as illustrated by their dense distribution at the Fermi level. The band structures are similar for all the fcc and bcc structures except Ta-free sample shows some differences in its conductive band. Fig. S16† depicts the total density of states (DOS) of CoCrFeNiTax. The overall DOS are similar for the alloys. The spin-up and spin-down distributions are almost symmetric and only some small changes are noted for the alloys with Ta addition.
4. Conclusions
Using a combined SQS structure search and first-principles calculation approach, we have investigated the microstructures, thermodynamic and mechanical properties of CoCrFeNiTax (x = 0.0–1.0) high entropy alloys. The SQS method was used to construct the disordered candidate structures, which were further verified with first-principles calculations. The identified structures have their lattice constants in good agreement well with the measures. The total and partial PDF reveal that the atoms have different environments from each other, varying with composition and phase structures. Ta atoms have preferences to coordinating with specific atoms. The Cv variations with temperature are similar for the studied alloys, and are consistent with the prediction of Dulong–Petit, Kepp and Debye Models. Structure transition between the fcc and bcc structures was noted with Ta addition, but the formation energies are small for both phases. The magnitudes of ΔScon are about 2–3 times greater than their ΔSvib counterparts. It is configurational entropy that plays a crucial role in stabilizing the alloys. The computed elastic constants and moduli revealed that the mechanical properties of the CoCrFeNiTax alloys vary with Ta content and phase structure, but the variations are relatively small. Using the computed moduli, the fcc structure of x = 0 and the bcc structures of x = 0, 0.4, and 0.8 were predicted to be brittle, and the rest of the structures ductile. The Ta addition alters the electron localization that has considerable influence on the equilibrium among atoms in HEA systems because Ta atoms have relatively stronger interaction with some specific atoms in the systems. Our computations revealed the variations in microstructures, thermodynamic and mechanical properties of the CoCrFeNiTa alloys, which would be helpful for their design and preparation with target performances.Conflicts of interest
There are no conflicts to declare.Acknowledgements
This work was supported by National Natural Science Foundation of China (21773159) and Science Challenge Project (TZ2016001).References
- J. W. Yeh, S. K. Chen, S. J. Lin, J. Y. Gan, T. S. Chin, T. T. Shun, C. H. Tsau and S. Y. Chang, Adv. Eng. Mater., 2004, 6, 299–303 CrossRef CAS.
- J. W. Yeh, S. J. Lin, T. S. Chin, J. Y. Gan, S. K. Chen, T. T. Shun, C. H. Tsau and S. Y. Chou, Metall. Mater. Trans. A, 2004, 35, 2533–2536 CrossRef.
- B. Cantor, I. T. H. Chang, P. Knight and A. J. B. Vincent, Mater. Sci. Eng. A, 2004, 375–377, 213–218 CrossRef.
- B. Cantor, Entropy, 2014, 16, 4749–4768 CrossRef.
- J. W. Yeh, JOM, 2013, 65, 1759–1771 CrossRef CAS.
- Y. Zhang, T. T. Zuo, Z. Tang, M. C. Gao, K. A. Dahmen, P. K. Liaw and Z. P. Lu, Prog. Mater. Sci., 2014, 61, 1–93 CrossRef CAS.
- M. H. Tsai and J. W. Yeh, Mater. Lett., 2014, 2, 107–123 CrossRef.
- K. Y. Tsai, M. H. Tsai and J. W. Yeh, Acta Mater., 2013, 61, 4887–4897 CrossRef CAS.
- N. D. Stepanov, D. G. Shaysultanov, G. A. Salishchev and M. A. Tikhonovsky, Mater. Lett., 2015, 142, 153–155 CrossRef CAS.
- O. N. Senkov, S. V. Senkova and C. Woodward, Acta Mater., 2014, 68, 214–228 CrossRef CAS.
- J. W. Yeh, Y. L. Chen, S. Jien Lin and P. H. Lee, Mater. Sci. Forum, 2007, 560, 1–9 CAS.
- J. W. Yeh, Ann. Chim. Sci. Mat., 2006, 31, 633–648 CrossRef CAS.
- O. N. Senkov, G. B. Wilks, D. B. Miracle, C. P. Chuang and P. K. Liaw, Intermetallics, 2010, 18, 1758–1765 CrossRef CAS.
- W. H. Liu, Y. Wu, J. Y. He, T. G. Nieh and Z. P. Lu, Scripta Mater., 2013, 68, 526–529 CrossRef CAS.
- J. Lužnik, P. Koželj, S. Vrtnik, A. Jelen, Z. Jagličić, A. Meden, M. Feuerbacher and J. Dolinšek, Phys. Rev. B: Condens. Matter Mater. Phys., 2015, 92, 224201 CrossRef.
- Z. Tang, L. Huang, W. He and K. P. Liaw, Entropy, 2014, 16, 895–911 CrossRef.
- J. Y. He, H. Wang, Y. Wu, X. J. Liu, H. H. Mao, T. G. Nieh and Z. P. Lu, Intermetallics, 2016, 79, 41–52 CrossRef CAS.
- Y. F. Kao, S. K. Chen, T. J. Chen, P. C. Chu, J. W. Yeh and S. J. Lin, J. Alloys Compd., 2011, 509, 1607–1614 CrossRef CAS.
- T. T. Shun and Y. C. Du, J. Alloys Compd., 2009, 479, 157–160 CrossRef CAS.
- C. Li, J. C. Li, M. Zhao and Q. Jiang, J. Alloys Compd., 2010, 504, 515–518 CrossRef.
- W. R. Wang, W. L. Wang and J. W. Yeh, J. Alloys Compd., 2014, 589, 143–152 CrossRef CAS.
- M. H. Tsai, A. C. Fan and H. A. Wang, J. Alloys Compd., 2017, 695, 1479–1487 CrossRef CAS.
- T. Yang, S. Xia, S. Liu, C. Wang, S. Liu, Y. Zhang, J. Xue, S. Yan and Y. Wang, Mater. Sci. Eng. A, 2015, 648, 15–22 CrossRef CAS.
- T. T. Shun, L. Y. Chang and M. H. Shiu, Mater. Charact., 2012, 70, 63–67 CrossRef CAS.
- L. Jiang, Y. Lu, Y. Dong, T. Wang, Z. Cao and T. Li, Intermetallics, 2014, 44, 37–43 CrossRef CAS.
- G. A. Salishchev, M. A. Tikhonovsky, D. G. Shaysultanov, N. D. Stepanov, A. V. Kuznetsov, I. V. Kolodiy, A. S. Tortika and O. N. Senkov, J. Alloys Compd., 2014, 591, 11–21 CrossRef CAS.
- W. H. Liu, J. Y. He, H. L. Huang, H. Wang, Z. P. Lu and C. T. Liu, Intermetallics, 2015, 60, 1–8 CrossRef CAS.
- F. He, Z. Wang, P. Cheng, Q. Wang, J. Li, Y. Dang, J. Wang and C. T. Liu, J. Alloys Compd., 2016, 656, 284–289 CrossRef CAS.
- X. F. Wang, Y. Zhang, Y. Qiao and G. L. Chen, Intermetallics, 2007, 15, 357–362 CrossRef CAS.
- W. H. Liu, Z. P. Lu, J. Y. He, J. H. Luan, Z. J. Wang, B. Liu, Y. Liu, M. W. Chen and C. T. Liu, Acta Mater., 2016, 116, 332–342 CrossRef CAS.
- K. Zhang and Z. Fu, Intermetallics, 2012, 22, 24–32 CrossRef CAS.
- S. G. Ma and Y. Zhang, Mater. Sci. Eng. A, 2012, 532, 480–486 CrossRef CAS.
- F. Wenqiang, Q. Yang and W. Shaoqing, Mater. Res. Express, 2018, 5, 106511 CrossRef.
- Z. Wang, H. Weng, Q. Wu, X. Dai and Z. Fang, Phys. Rev. B: Condens. Matter Mater. Phys., 2013, 88, 125427 CrossRef.
- A. J. Zaddach, C. Niu, C. C. Koch and D. L. Irving, JOM, 2013, 65, 1780–1789 CrossRef CAS.
- F. Tian, L. Delczeg, N. Chen, L. K. Varga, J. Shen and L. Vitos, Phys. Rev. B: Condens. Matter Mater. Phys., 2013, 88, 085128 CrossRef.
- H. Jiang, K. Han, D. Qiao, Y. Lu, Z. Cao and T. Li, Mater. Chem. Phys., 2018, 210, 43–48 CrossRef CAS.
- L. Zheng, G. Zhang, T. L. Lee, M. J. Gorley, Y. Wang, C. Xiao and Z. Li, Mater. Des., 2014, 61, 61–69 CrossRef CAS.
- V. Stelmakh, V. Rinnerbauer, R. Geil, P. Aimone, J. Senkevich, J. D. Joannopoulos, M. Soljacic and I. Celanovic, Appl. Phys. Lett., 2013, 103, 123903 CrossRef.
- A. Zunger, S. Wei, L. G. Ferreira and J. E. Bernard, Phys. Rev. Lett., 1990, 65, 353–356 CrossRef CAS PubMed.
- Y. Wang, M. Yan, Q. Zhu, W. Y. Wang, Y. Wu, X. Hui, R. Otis, S. L. Shang, Z. K. Liu and L. Q. Chen, Acta Mater., 2018, 143, 88–101 CrossRef CAS.
- S. Guo, C. Ng, J. Lu and C. T. Liu, J. Appl. Phys., 2011, 109, 103505 CrossRef.
- A. van de Walle, M. Asta and G. Ceder, CALPHAD, 2002, 26, 539–553 CrossRef CAS.
- A. van de Walle, CALPHAD, 2009, 33, 266–278 CrossRef CAS.
- T. H Kim and K. Kelton, J. Chem. Phys., 2007, 126, 054513 CrossRef PubMed.
- G. Duan, D. Xu, Q. Zhang, G. Zhang, T. Cagin, W. L. Johnson and W. A. Goddard, Phys. Rev. B: Condens. Matter Mater. Phys., 2005, 71, 224208 CrossRef.
- P. Vashishta, R. K. Kalia, J. P. Rino and I. Ebbsjö, Phys. Rev. B: Condens. Matter Mater. Phys., 1990, 41, 12197–12209 CrossRef CAS PubMed.
- P. E. Blöchl, Phys. Rev. B: Condens. Matter Mater. Phys., 1994, 50, 17953–17979 CrossRef PubMed.
- A. Togo, F. Oba and I. Tanaka, Phys. Rev. B: Condens. Matter Mater. Phys., 2008, 78, 134106 CrossRef.
- A. Togo and I. Tanaka, Scripta Mater., 2015, 108, 1–5 CrossRef CAS.
- M. C. Gao, Y. Suzuki, H. Schweiger, Ö. N. Doğan, J. Hawk and M. Widom, J. Phys.: Condens. Matter, 2013, 25, 075402 CrossRef CAS PubMed.
- L. Vitos, Computational Quantum Mechanics for Materials Engineers, Springer, London, 2007 Search PubMed.
- M. J. Mehl, J. E. Osburn, D. A. Papaconstantopoulos and B. M. Klein, Phys. Rev. B: Condens. Matter Mater. Phys., 1990, 41, 10311–10323 CrossRef CAS PubMed.
- M. C. Gao, Ö. N. Doğan, P. King, A. D. Rollett and M. Widom, JOM, 2008, 60, 61–65 CrossRef CAS.
- J. Li, W. Jia, J. Wang, H. Kou, D. Zhang and E. Beaugnon, Mater. Des., 2016, 95, 183–187 CrossRef CAS.
- I. Wesemann, A. Hoffmann, T. Mrotzek and U. Martin, Int. J. Refract. Met. Hard Mater., 2010, 28, 709–715 CrossRef CAS.
- S. M. Cardonne, P. Kumar, C. A. Michaluk and H. D. Schwartz, Int. J. Refract. Met. Hard Mater., 1995, 13, 187–194 CrossRef CAS.
- E. Chicardi, Y. Torres, J. M. Córdoba, P. Hvizdoš and F. J. Gotor, Mater. Des., 2014, 53, 435–444 CrossRef CAS.
- Z. Huang, J. Feng and W. Pan, Comput. Mater. Sci., 2011, 50, 3056–3062 CrossRef CAS.
- G. N. Lewis, J. Am. Chem. Soc., 1907, 29, 1165–1168 CrossRef.
- S. L. Shang, Y. Wang, D. Kim and Z. K. Liu, Comput. Mater. Sci., 2010, 47, 1040–1048 CrossRef CAS.
- G. Grimvall, Thermophysical Properties of Materials, Elsevier Science B. V., 1999 Search PubMed.
- D. Nguyen-Manh, M. Mrovec and S. P. Fitzgerald, Mater. Trans., 2008, 49, 2497–2506 CrossRef CAS.
- Z. J. Wu, E. J. Zhao, H. P. Xiang, X. F. Hao, X. J. Liu and J. Meng, Phys. Rev. B: Condens. Matter Mater. Phys., 2007, 76, 054115 CrossRef.
- S. F. Pugh, London, Edinburgh Dublin Philos. Mag. J. Sci., 1954, 45, 823–843 CrossRef CAS.
- A. Savin, R. Nesper, S. Wengert and T. F. Fässler, Angew. Chem., Int. Ed. Engl., 1997, 36, 1808–1832 CrossRef CAS.
- W. Huo, H. Zhou, F. Fang, X. Zhou, Z. Xie and J. Jiang, J. Alloys Compd., 2018, 735, 897–904 CrossRef CAS.
Footnote |
| † Electronic supplementary information (ESI) available. See DOI: 10.1039/c9ra03055g |
| This journal is © The Royal Society of Chemistry 2019 |

